. 2023 Jul;24(7):1124-1137.
doi: 10.1038/s41590-023-01519-9. Epub 2023 May 22.

Spatial dysregulation of T follicular helper cells impairs vaccine responses in aging

Affiliations

Spatial dysregulation of T follicular helper cells impairs vaccine responses in aging

Alyssa Silva-Cayetano et al. Nat Immunol. 2023 Jul.

Abstract

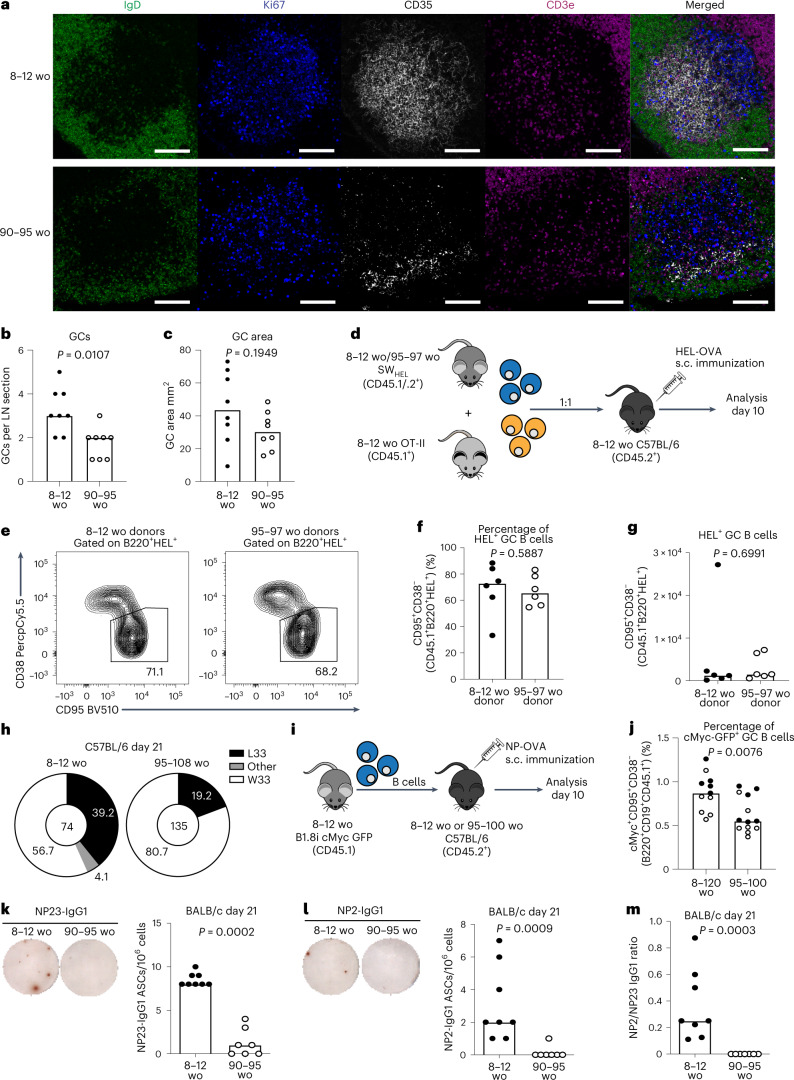
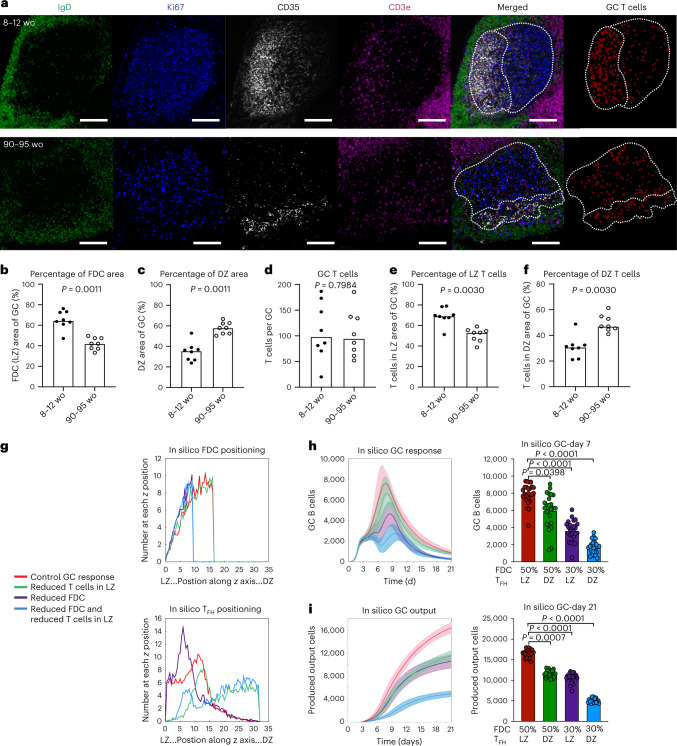
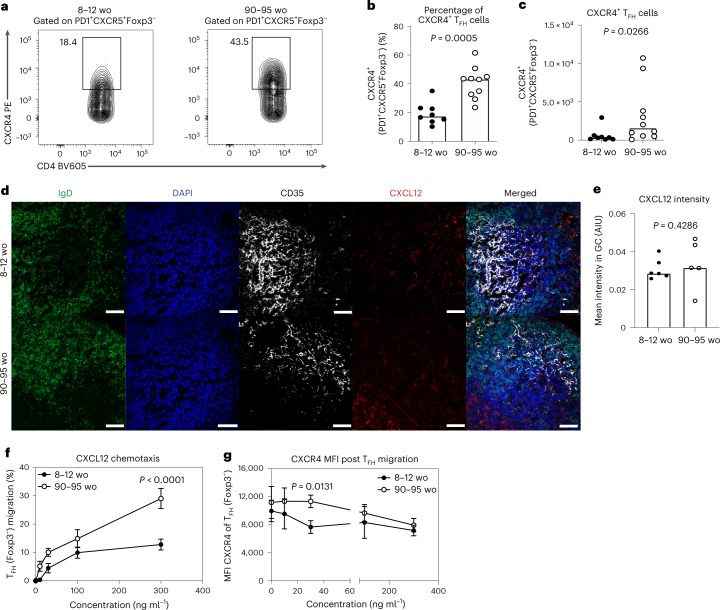
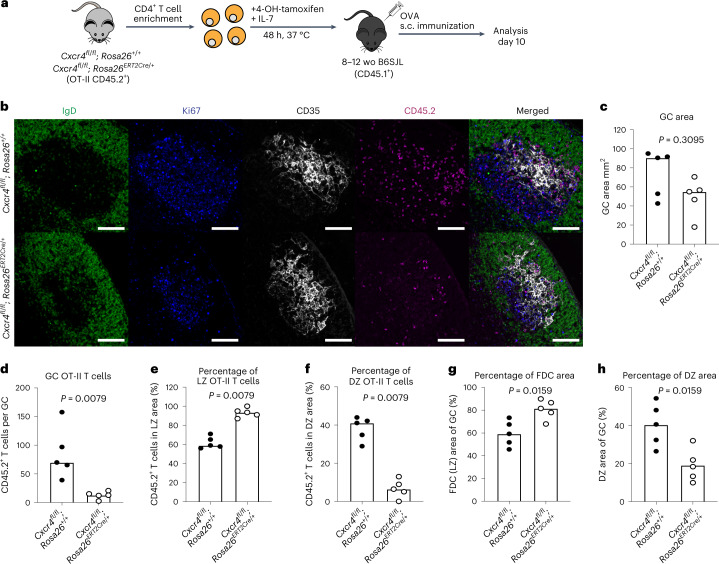
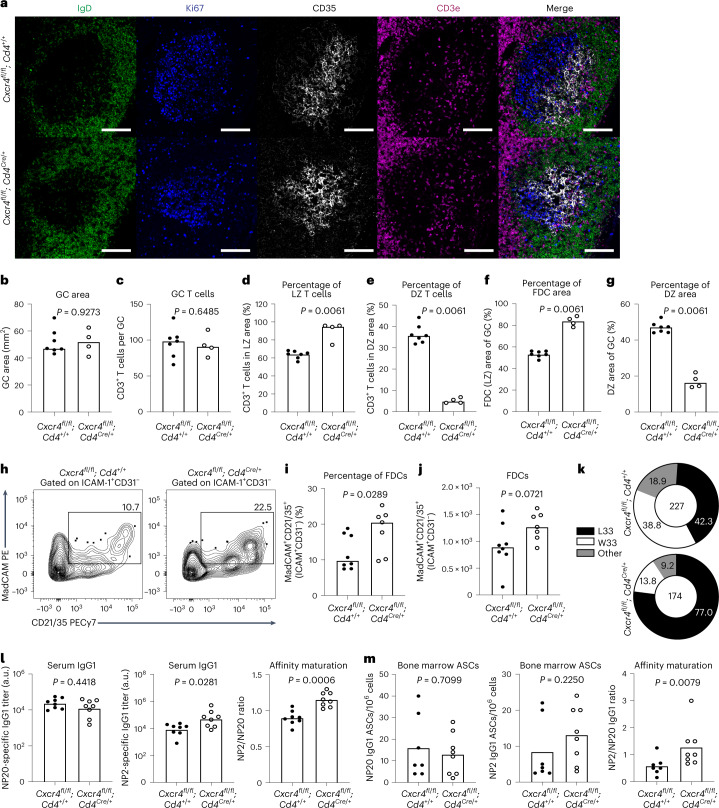
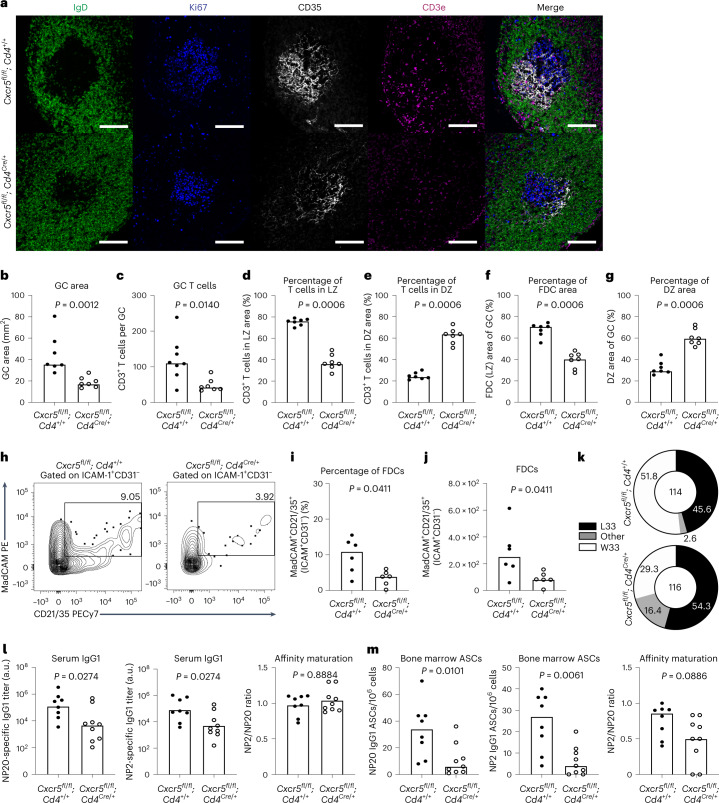
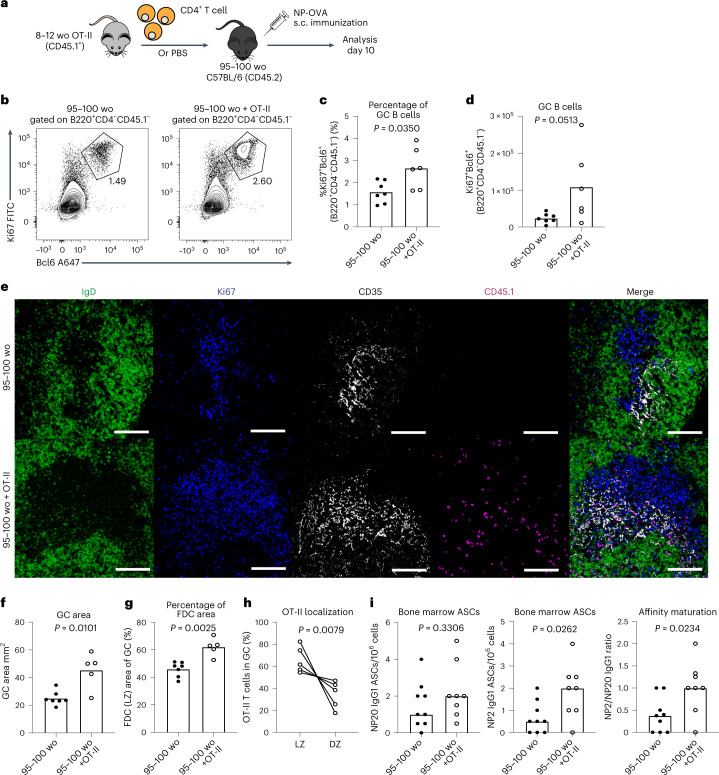
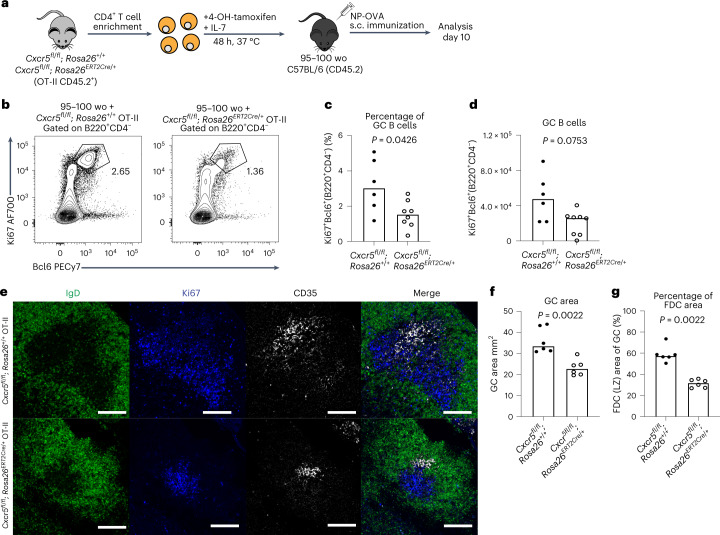
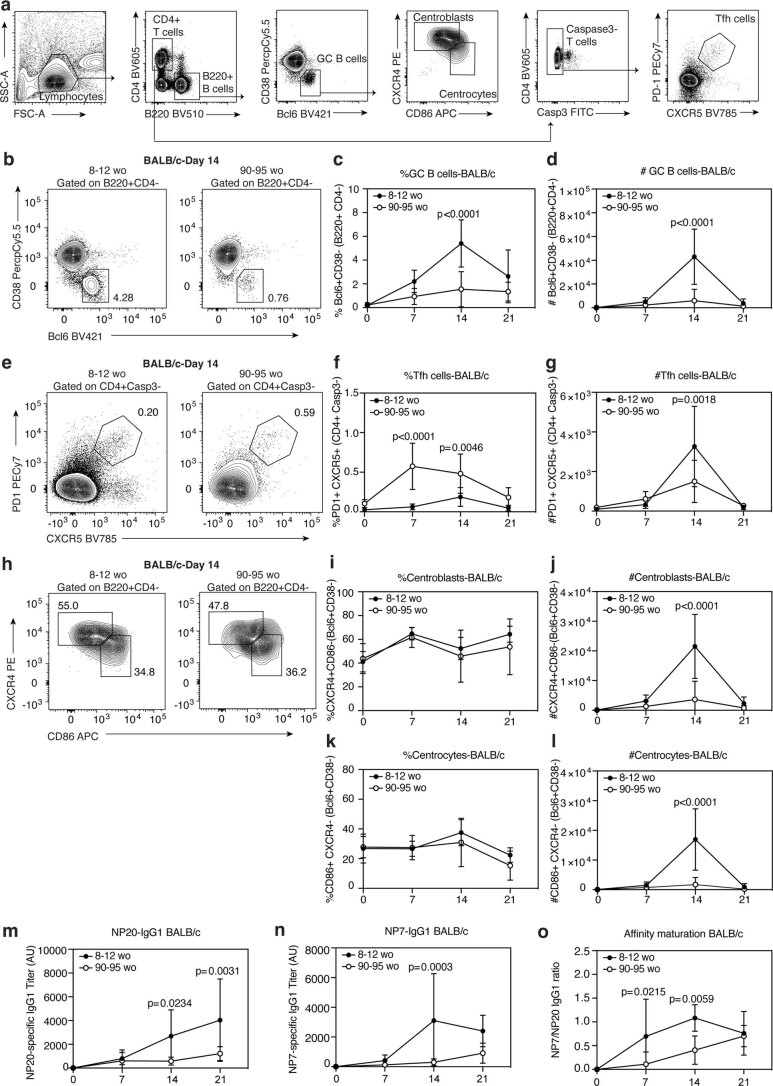
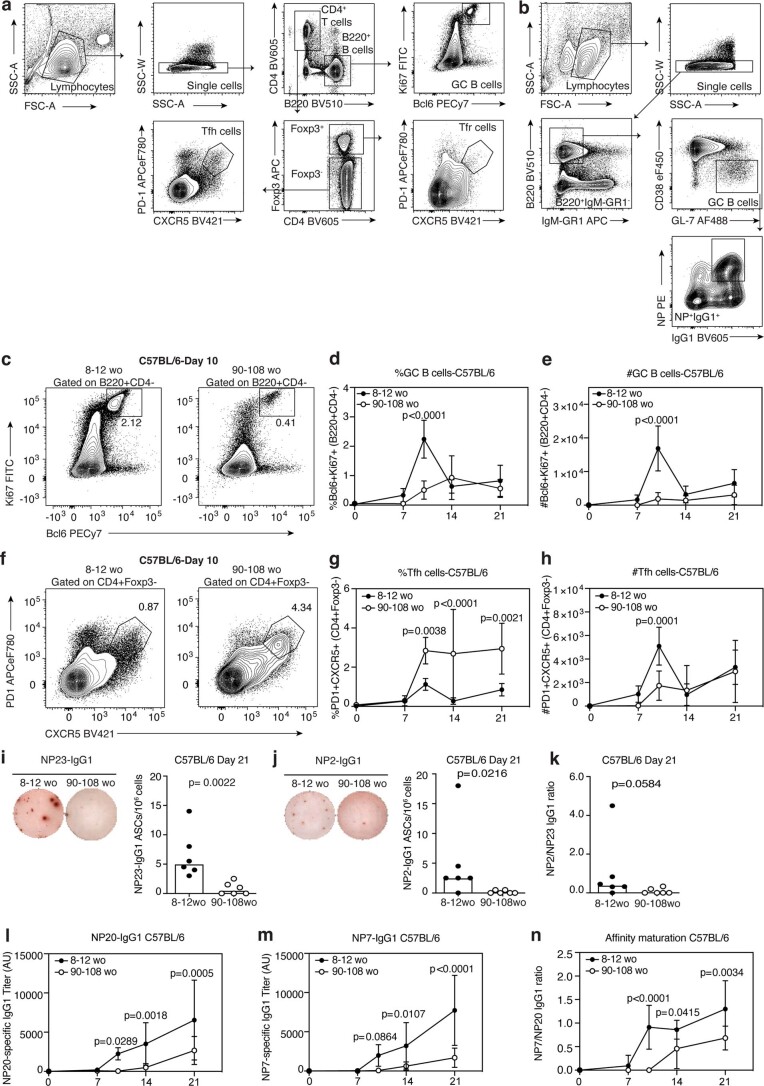
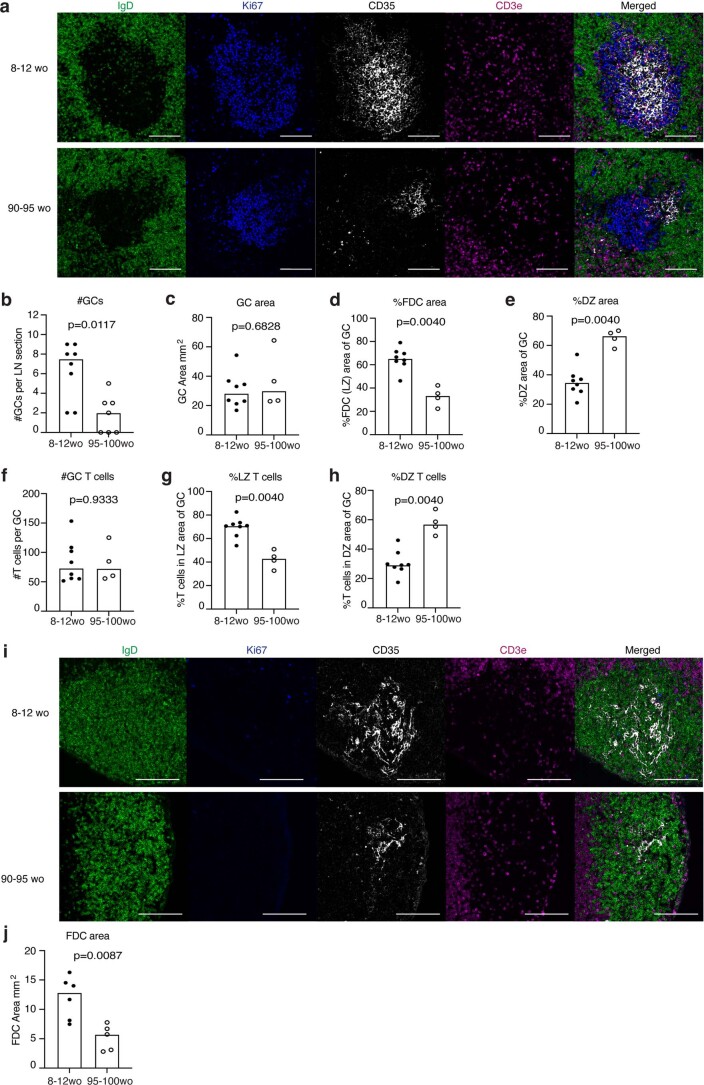
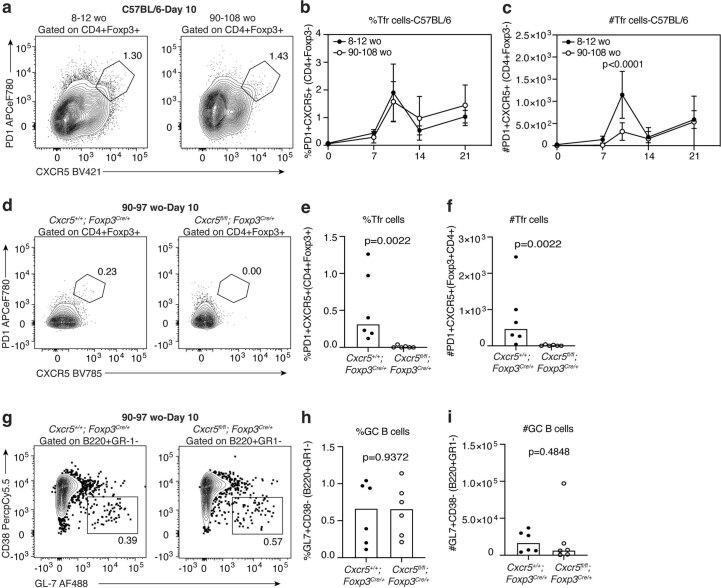
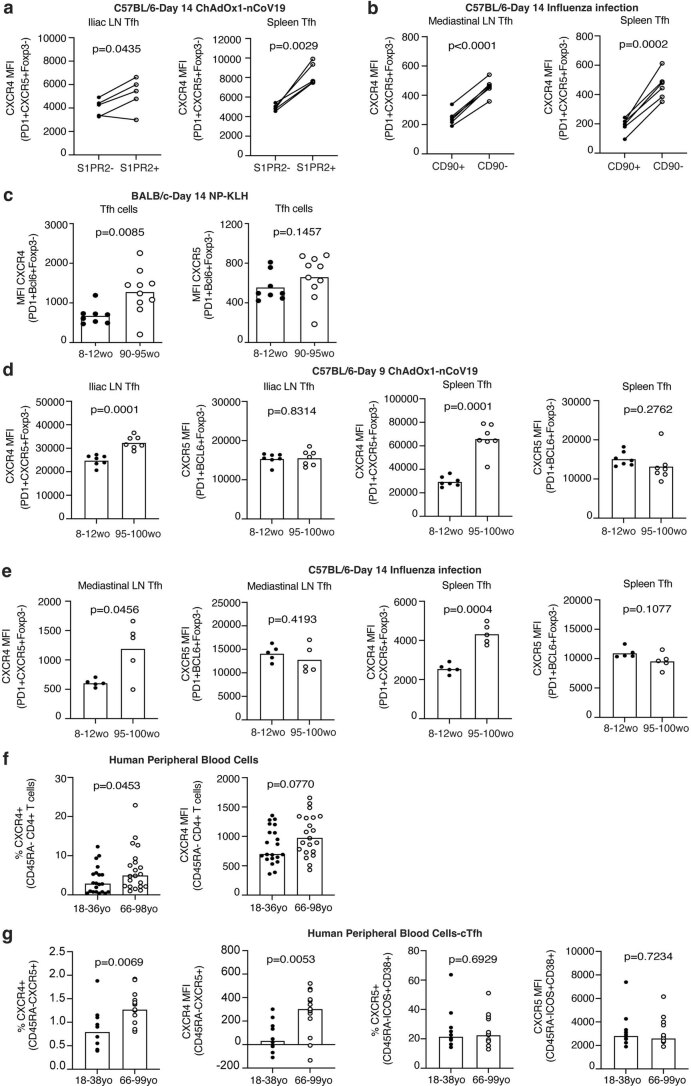
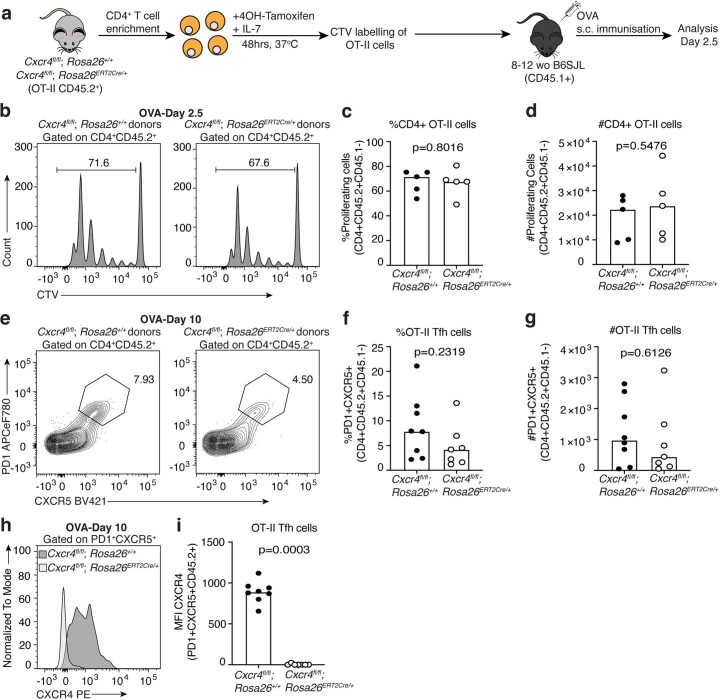
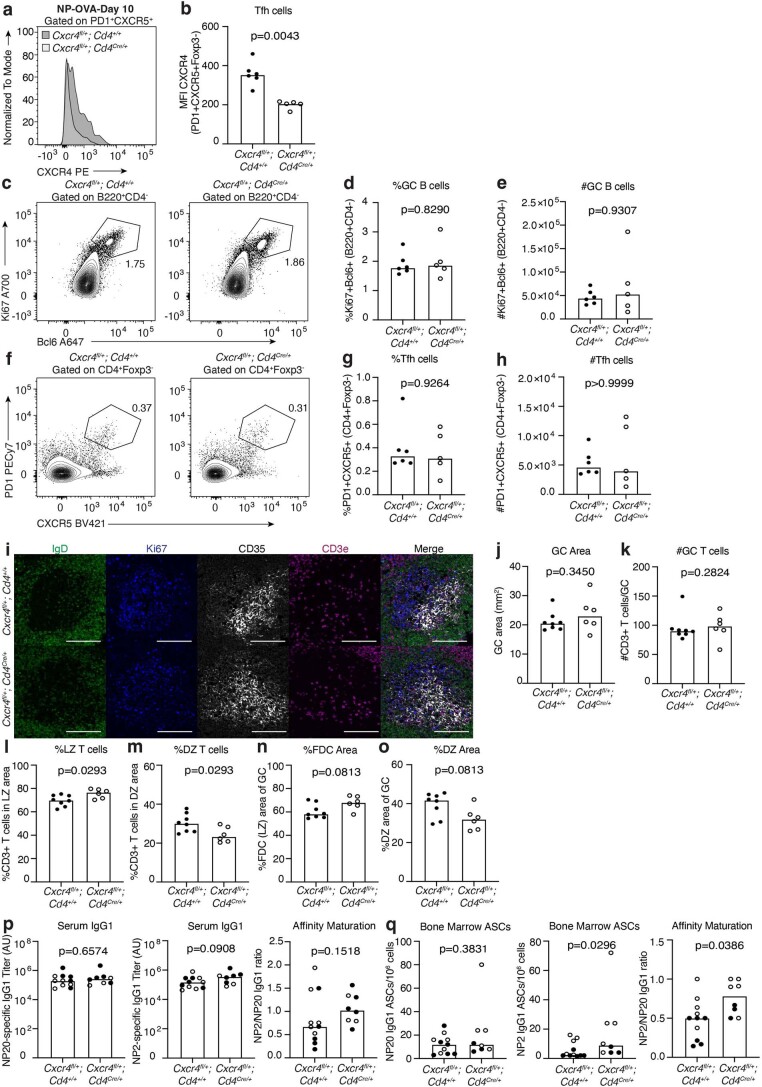
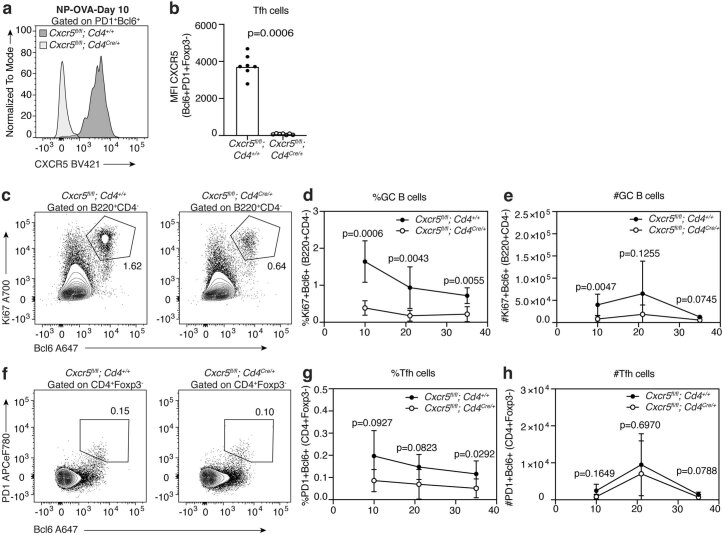
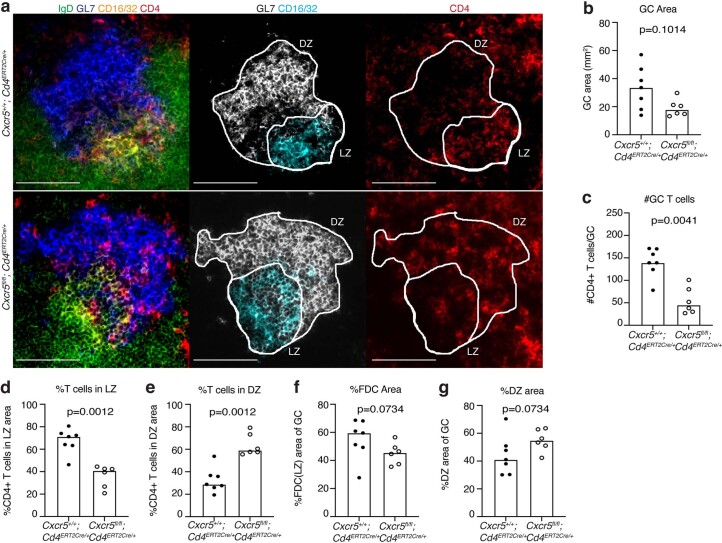
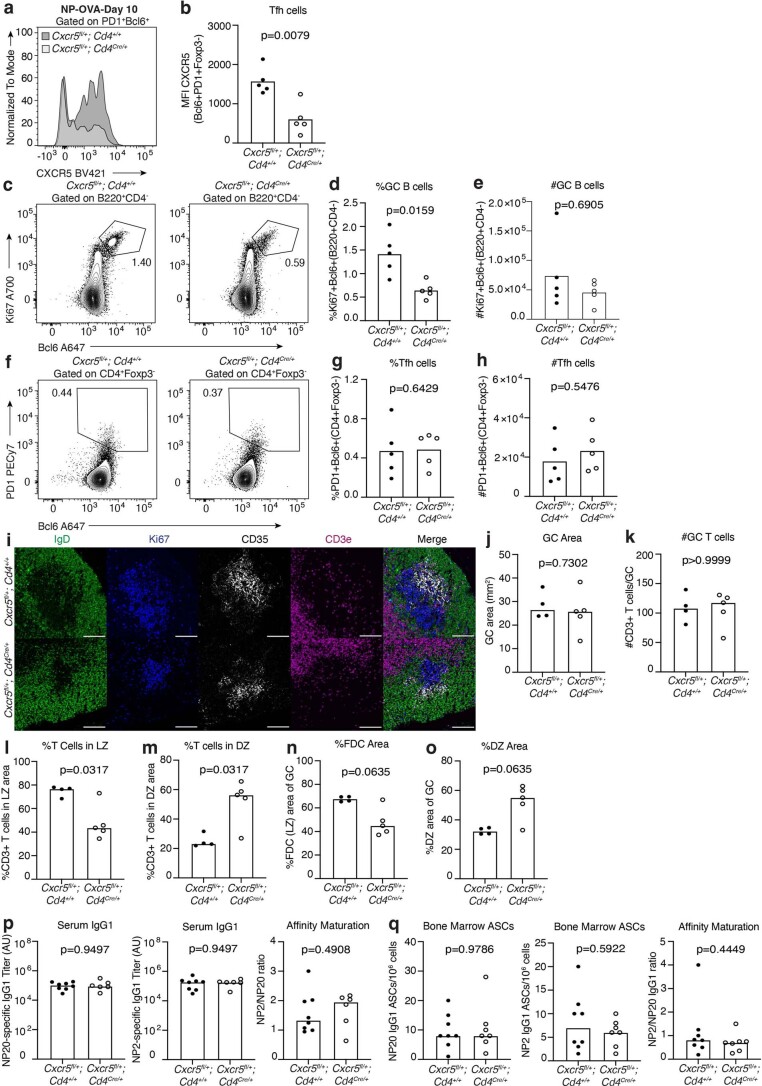
The magnitude and quality of the germinal center (GC) response decline with age, resulting in poor vaccine-induced immunity in older individuals. A functional GC requires the co-ordination of multiple cell types across time and space, in particular across its two functionally distinct compartments: the light and dark zones. In aged mice, there is CXCR4-mediated mislocalization of T follicular helper (TFH) cells to the dark zone and a compressed network of follicular dendritic cells (FDCs) in the light zone. Here we show that TFH cell localization is critical for the quality of the antibody response and for the expansion of the FDC network upon immunization. The smaller GC and compressed FDC network in aged mice were corrected by provision of TFH cells that colocalize with FDCs using CXCR5. This demonstrates that the age-dependent defects in the GC response are reversible and shows that TFH cells support stromal cell responses to vaccines.


Conflict of interest statement

The authors declare no competing interests.

Figures

Fig. 1
Fig. 1. The GC response, and its output, is diminished in aged mice.
a, Representative confocal images of GCs at ×40 from adult and aged BALB/c mice 14 d after immunization with NP-KLH in alum; scale bars, 50 µm. LN sections were stained for IgD (green), CD35 (white), Ki67 (blue) and CD3e (magenta). b, Enumeration of GCs per LN. c, Quantification of the total GC area (n = 16). d, Experimental outline of the cotransfer of SWHEL B cells from either adult or aged donors alongside OT-II T cells from adult donors into adult C57BL/6 recipient mice in which GC formation was analyzed 10 d after immunization with HEL-OVA in alum. e, Representative flow cytometry plots identifying SWHEL-derived GC B cells (CD95+CD38CD45.1+B220+HEL+) in recipient mice. The values next to the gates indicate the population percentage. f,g, Quantification of the frequency (f) and total number (g) of SWHEL-derived GC B cells (n = 12). h, Pie charts indicating the frequency of the affinity-inducing mutation W33L in the CDR1 region of VH186.2 sequenced from single-cell sorted NP+IgG1+ GC B cells of adult and aged C57BL/6 mice 21 d postimmunization with 1W1K-NP/alum. The values in the chart center indicate the total number of cells sequenced per group (n = 16). i, Experimental outline of the transfer of B1.8i mycGFP/GFP B cells from adult donors into adult or aged C57BL/6 recipient mice in which GC formation was analyzed 10 d after NP-OVA in alum immunization. j, Quantification of the frequency of B1.8i-derived cMyc+ GC B cells in adult or aged mice; data are pooled from two independent experiments, first experiment in black, second experiment in white (n = 23). k,l, Representative ELISpot well images (left) and quantification (right) of bone marrow NP23- (k) and NP2- (l) specific IgG1 ASCs in BALB/c mice 21 d after immunization with NP-KLH in alum. m, Affinity maturation of bone marrow ASCs from BALB/c mice as determined by the ratio of NP2/NP23-specific ASCs (n = 15). For all experiments, 2–4 experimental repeats were performed with biologically independent samples. In bar graphs, each symbol represents a mouse, and the bar height represents the median. The P values were generated by performing an unpaired two-tailed Mann–Whitney U test. ELISpot, enzyme-linked immunosorbent spot; s.c., subcutaneous; wo, weeks old. Source data
Fig. 2
Fig. 2. The spatial organization of the GC is altered in aged mice.
a, Representative confocal images of GCs at ×20 magnification from adult and aged BALB/c mice 14 d after immunization with NP-KLH in alum; scale bars, 100 µm. LN sections were stained for IgD (green), CD35 (white), Ki67 (blue) and CD3e (magenta). Representative masked images identifying GC T cells (red) generated by Cell Profiler used for enumeration (right panel). bf, Quantification of the CD35+ FDC network light zone area (b), the Ki67+CD35 dark zone area (c) of the GC, the number of CD3+ T cells (d) within the GC area, and the proportion of T cells positioned in the CD35+ FDC light zone area (e) and Ki67+CD35 dark zone (f) of the GC. For bf, the data are representative of four independent experiments (n = 16) where each symbol on the graph represents a mouse and the bar height represents the median. The P values were generated by performing an unpaired, two-tailed Mann–Whitney U test. g, Computational modeling of the age-associated changes to the spatial organization of the GC (control GC response in red, GC response with reduced TFH cell positioning in the light zone in green, GC response with reduced FDC network in purple and the combined effect of both defects in blue). Graphical representation of the FDC network size (top) and TFH cell positioning (bottom) within the GC compartment for the simulations performed. The units on x axes of plots are the positions of cells along the z axis in ×10 µm. h, Computational modeling of the impact on the number of GC B cells (left) with quantification at day 7 of the GC response (right). i, Computational modeling of the impact on the total number of produced output cells (left) with quantification at day 21 of the GC response (right). For h and i, lines on time-course graphs show the mean of 25 independent simulations and the shaded areas indicate the standard deviation. For bar graphs, the bar height represents the mean (n = 25). The P values indicated on the graphs were generated by performing a Kruskal–Wallis test with Dunn’s multiple comparison correction. Source data
Fig. 3
Fig. 3. CXCR4 expression is increased in TFH cells from aged mice.
a, Representative flow cytometry plots showing CXCR4+PD1+CXCR5+Foxp3 TFH cells in adult and aged BALB/c mice 14 d after immunization with NP-KLH in alum. Values adjacent to gates represent percentages. b,c, Quantification of the percentage (b) and total number (c) of CXCR4+PD1+CXCR5+Foxp3 TFH cells in adult and aged BALB/c mice (n = 18). Data are representative of two independent experiments. d,e, Representative ×40 confocal images (d) and quantification (e) of CXCL12 in red within the dark zone of GCs in the iLNs of adult and aged mice at day 14 postimmunization with NP-KLH in alum; IgD (green), DAPI (blue) and CD35 (white). AIU, arbitrary intensity units. n = 11 biologically independent samples. Scale bars, 50 µm. Bar heights represent the median and P values were obtained by performing an unpaired, two-tailed Mann–Whitney U test. Each symbol represents a single mouse. f,g, CXCL12 chemotaxis assays with TFH cells isolated 14 d after NP-KLH in alum immunization. f,g, Percentage of PD1+CXCR5+Foxp3 TFH cells of the total input cells that migrated to the indicated concentrations of CXCL12 (f) and median fluorescence intensity (MFI) of cell-surface CXCR4 expression (g) (n = 16). Each symbol represents the mean ± s.d. and P values are from two-way ANOVA with Sidak’s multiple comparisons test. Data are representative of two independent experiments performed with biologically independent samples. PE, phycoerythrin. Source data
Fig. 4
Fig. 4. CXCR4 expression determines T cell dark zone positioning.
a, Experimental outline of in vitro 4-OH-tamoxifen treatment of CD4+ T cells isolated from Cxcr4fl/fl; Rosa26ERT2Cre/+ OT-II mice that were treated for 48 h, after which the cells were transferred into adult B6SJL recipient mice. Recipient mice were immunized subcutaneously with OVA in alum and analysis was performed after 10 d. b, Representative ×20 magnification confocal images of the GCs from the iLNs of B6SJL mice that received tamoxifen-treated OT-II cells from either Cxcr4fl/fl; Rosa26+/+ or Cxcr4fl/fl; Rosa26ERT2Cre/+ mice; scale bars, 100 µm. LN sections were stained for IgD (green), CD35 (white), Ki67 (blue) and CD45.2 (magenta). ch, Quantification of the GC area (c), the number of CD45.2+ transferred cells in the GC (d), percentages of OT-II TFH cells in the CD35+ FDC light zone area (e) and Ki67+CD35 dark zone area (f), percentage of the GC occupied by the CD35+ FDC network (g) and percentage of the GC occupied by the dark zone (h), from the iLNs of recipient B6SJL mice (n = 10). Data are representative of two independent experiments performed with biologically independent samples. In graphs, bar heights represent the median and P values were obtained by performing an unpaired, two-tailed Mann–Whitney U test. Each symbol represents a single mouse. LZ, light zone. DZ, dark zone. Source data
Fig. 5
Fig. 5. TFH restriction to the light zone can boost FDC expansion and alter the quality of the GC output.
a, Representative ×20 confocal images of GCs at day 10 after NP-OVA/alum immunization in the iLNs of Cxcr4fl/fl; Cd4+/+ mice (top) and Cxcr4fl/fl; Cd4Cre/+ mice (bottom); scale bar, 100 µm. LN sections were stained for IgD (green), Ki67 (blue), CD35 (white) and CD3e (magenta). bg, Quantification of the total GC area (b), the total number of CD3+ T cells within the GC (c), and the percentage of CD3+ T cells localizing to the CD35+ light zone area (d) and the Ki67+CD35 dark zone area (e), and the CD35+ FDC light zone area (f) and the Ki67+CD35 dark zone area (g) (n = 11). h, Representative plots showing gp38+ICAM+CD31MadCAM+CD21/35+ FDCs in adult Cxcr4fl/fl; Cd4+/+ and Cxcr4fl/fl; Cd4Cre/+ mice 10 d after immunization with NP-OVA/alum. Values adjacent to the gates represent percentages. i,j, Quantification of this population frequency (i) and total number (j) (n = 15). k, Pie charts indicating the frequency of the affinity-inducing mutation W33L in the CDR1 region of VH186.2 sequenced from NP+IgG1+ GC B cells of Cxcr4fl/fl; Cd4+/+ and Cxcr4fl/fl; Cd4Cre/+ mice at 21 d postimmunization with NP-OVA/alum. The values in the center indicate the number of cells sequenced per group (n = 11). l, Serum titers of NP20- (left) and NP2- (middle) specific IgG1 of Cxcr4fl/fl; Cd4+/+ and Cxcr4fl/fl; Cd4Cre/+ mice and antibody affinity maturation indicated by the NP2/NP20 antibody ratio (right) at 35 d postimmunization with NP-OVA (n = 16). Titers were normalized to a positive control and are displayed as arbitrary units. m, Enumeration of NP20 (left) and NP2 (middle) IgG1 ASCs and affinity maturation indicated by the ratio of NP2/NP20 ASCs (right) in the bone marrow of Cxcr4fl/fl; Cd4+/+ and Cxcr4fl/fl; Cd4Cre/+ mice at 35 d postimmunization with NP-OVA (n = 15). For all bar graphs, bar height indicates the median, each symbol represents a mouse and P values were obtained by performing an unpaired, two-tailed Mann–Whitney U test. Data are representative of two independent experiments. FDC, follicular dendritic cells. LZ, light zone. DZ, dark zone. ASCs, antibody secreting cells. Source data
Fig. 6
Fig. 6. TFH restriction to the dark zone in adult mice mimics certain aspects of the aged GC response.
a, Representative ×20 confocal images of GCs at day 10 after NP-OVA/alum immunization in the iLNs of Cxcr5fl/fl; Cd4+/+ mice (top) and Cxcr5fl/fl; Cd4Cre/+ mice (bottom); scale bar, 100 µm. LN sections were stained for IgD (green), Ki67 (blue), CD35 (white) and CD3e (magenta). bg, Quantification of the total GC area (b), the total number of CD3+ T cells within the GC (c), and the percentage of CD3+ T cells localizing to the CD35+ light zone area (d) and the Ki67+CD35 dark zone area (e), and the CD35+ FDC light zone area (f) and the Ki67+CD35 dark zone area (g) (n = 11). h, Representative plots showing gp38+ICAM+CD31MadCAM+CD21/35+ FDCs in adult Cxcr5fl/fl; Cd4+/+ and Cxcr5fl/fl; Cd4Cre/+ mice 10 d after immunization with NP-OVA/alum. Values adjacent to the gates represent percentages. i,j, Quantification of this population frequency (i) and total number (j) (n = 15). k, Pie charts indicating the frequency of the affinity-inducing mutation W33L in the CDR1 region of VH186.2 sequenced from NP+IgG1+ GC B cells of Cxcr5fl/fl; Cd4+/+ and Cxcr5fl/fl; Cd4Cre/+ mice at 21 d postimmunization with NP-OVA/alum. The values in the center indicate the number of cells sequenced per group (n = 11). l, Serum titers of NP20- (left) and NP2- (middle) specific IgG1 of Cxcr5fl/fl; Cd4+/+ and Cxcr5fl/fl; Cd4Cre/+ mice and antibody affinity maturation indicated by the NP2/NP20 antibody ratio (right) at 35 d postimmunization with NP-OVA (n = 16). Titers were normalized to a positive control and are displayed as arbitrary units. m, Enumeration of NP20 (left) and NP2 (middle) IgG1 ASCs and affinity maturation indicated by the ratio of NP2/NP20 ASCs (right) in the bone marrow of Cxcr5fl/fl; Cd4+/+ and Cxcr5fl/fl; Cd4Cre/+ mice at 35 d postimmunization with NP-OVA (n = 15). For all bar graphs, bar height indicates the median, each symbol represents a mouse and P values were obtained by performing an unpaired, two-tailed Mann–Whitney U test. Data are representative of two independent experiments. Source data
Fig. 7
Fig. 7. T cell transfer can boost the aged GC response, FDC expansion and humoral immunity.
a, Experimental outline of the adoptive transfer of CD4+ T cells, isolated from adult OT-II mice, into aged C57BL6 recipients which were then subcutaneously immunized with NP-OVA/alum and analyzed 10 d after immunization. Control aged C57BL/6 recipient mice were injected with PBS instead of OT-II cells. bd, Representative flow cytometry plots (b) and the percentage (c) and total number (d) of Ki67+Bcl6+ GC B cells in aged C57BL/6 mice that received either an injection of PBS (left) or CD4+ OT-II T cells (right); values adjacent to gates indicate percentage (n = 13). e, Representative confocal images of GCs at day 10 after NP-OVA immunization in the iLNs of aged C57BL/6 mice that received either an injection of PBS (top) or CD4+ OT-II T cells (bottom). Images were taken at ×20 magnification; scale bar, 100 µm. LN sections were stained for IgD (green), Ki67 (blue), CD35 (white) and CD45.1 (magenta). fh, Quantification of the total area of GCs (f), the CD35+ FDC network area (g) and the percentage of transferred OT-II cells in the light or dark zones (h) in the iLNs of aged C57BL/6 mice that received an injection of PBS or CD4+ OT-II T cells (n = 12). i, Enumeration of NP20 (left) and NP2 (middle) IgG1 ASCs and affinity maturation indicated by the ratio of NP2/NP20 ASCs (right) in the bone marrow of aged mice that received OT-II cells or PBS at 35 d postimmunization with NP-OVA/alum (n = 17). For all bar graphs, bar height indicates the median, each symbol represents a mouse and P values were obtained by performing an unpaired, two-tailed Mann–Whitney U test. In h, P value is from a paired t-test, and individual mice are connected with a line. Data are representative of two independent experiments. Source data
Fig. 8
Fig. 8. T cell light zone positioning can boost the aged GC response and FDC expansion.
a, Experimental outline of in vitro 4-OH-tamoxifen treatment of CD4+ T cells isolated from Cxcr5fl/fl; Rosa26ERT2Cre/+ OT-II mice that were treated for 48 h, after which the cells were transferred into aged C57BL/6 recipient mice. Recipient mice were immunized subcutaneously with NP-OVA in alum and analysis was performed after 10 d. b, Representative flow cytometry plots identifying Ki67+Bcl6+ GC B cells in aged C57BL/6 mice that received either Cxcr5fl/fl; Rosa26+/+ (left) or Cxcr5fl/fl; Rosa26ERT2Cre/+ (right) CD4+ OT-II T cells; values adjacent to gates indicate percentage. c,d, Quantification of the percentage (c) and total number (d) of Ki67+Bcl6+ GC B cells in aged C57BL/6 mice that received either Cxcr5fl/fl; Rosa26+/+ or Cxcr5fl/fl; Rosa26ERT2Cre/+ OT-II cells (n = 14). e, Representative ×20 confocal images of GCs at day 10 after NP-OVA immunization in the iLNs of aged C57BL/6 mice that received an injection of either Cxcr5fl/fl; Rosa26+/+ (top) or Cxcr5fl/fl; Rosa26ERT2Cre/+ (bottom) OT-II cells; scale bar, 100 µm. LN sections were stained for IgD (green), Ki67 (blue) and CD35 (white). f,g, Quantification of the total area of GCs (f) and the CD35+ FDC network area representative of the light zone compartment within the GCs (g) of aged C57BL/6 mice that received an injection of either Cxcr5fl/fl; Rosa26+/+ (left) or Cxcr5fl/fl; Rosa26ERT2Cre/+ (right) OT-II cells (n = 12). For bar graphs, bar heights represent the median, each symbol represents a mouse and P values were obtained by performing an unpaired, two-tailed Mann–Whitney U test. Data are representative of two independent experiments. Source data
Extended Data Fig. 1
Extended Data Fig. 1. Kinetic analysis of GC response in aged BALB/c mice after NP-KLH/Alum immunization.
(a) Gating strategy for the analysis of GC B cells, centroblasts, centrocytes and Tfh cell populations in the iLNs of adult and aged BALB/c mice immunized with NP-KLH in alum. (b) Representative flow cytometry plots identifying GC B cells (Bcl6 + CD38B220 + CD4-) in the inguinal lymph nodes (iLNs) of adult and aged BALB/c mice and their frequency (c) and total number (d) at the indicated timepoints post immunization. (e) Representative flow cytometry plots identifying Tfh cells (PD1 + CXCR5 + CD4 + Casp3-B220-) and their frequency (f) and total number (g) in the iLN at the indicated timepoints post immunization. (h) Representative flow cytometry plots identifying centroblasts (CXCR4hiCD86loBcl6+CD38) and centrocytes (CD86hiCXCR4loBcl6+CD38-) and their frequency and number (i-l) at the indicated timepoints after immunization. Adult and aged BALB/c serum antibody titers of NP20 (m) and NP7 (n) specific IgG1 and antibody affinity maturation (o) as determined by the ratio of NP7/NP20 IgG1 titers, at the indicated time point post immunization. The data is representative of two independent experiments (n = 14) where each symbol represents the mean ± SD and p-values were generated by performing a two-way ANOVA with Sidak’s multiple comparisons test. Source data
Extended Data Fig. 2
Extended Data Fig. 2. Kinetic analysis of GC response in aged C57BL/6 mice after 1W1K-NP in alum immunization.
(a) Gating strategy for the analysis of GC B cells, Tfh and Tfr populations in the iLNs of adult and aged C57BL/6 mice immunized with 1W1K-NP in alum. (b) Single-cell sorting strategy of NP + IgG1+ GC B cells from iLNs of C57BL/6 mice 21 days after immunization with 1W1K-NP in alum for VH186.2 sequencing. (c) Representative flow cytometry plots identifying GC B cells (Ki67+Bcl6+B220+CD4) in the inguinal lymph nodes (iLNs) of adult and aged C57BL/6 mice 10 days after subcutaneous immunization with 1W1K-NP in alum and their frequency (d) and total number (e) at the indicated timepoints post immunization. (f) Representative flow cytometry plots identifying Tfh cells (PD1+CXCR5+CD4+Foxp3B220) in the iLNs of adult and aged C57BL/6 mice 10 days post-immunization with 1W1K-NP in alum and their frequency (g) and total number (h) at the indicated timepoints post immunization. (i-k) Representative ELISpot well images (left) and quantification (right) of bone marrow NP23 (i) and NP2 (j) specific IgG1 antibody-secreting cells (ASCs) in C57BL/6 mice 21 days after immunization. (k) Affinity maturation of bone marrow ASCs from C57BL/6 mice as determined by the ratio of NP2/NP23-specific ASCs. For (i-k) the data is representative of two independent experiments (n = 12) where each symbol represents a mouse, and the bar height represents the median. The p-values were obtained by performing an unpaired, two-tailed Mann Whitney U test. (l-n) Adult and aged C57BL/6 serum antibody titers of NP20 (l) and NP7 (m) specific IgG1 at the indicated timepoints after immunization with NP-KLH in alum and antibody affinity maturation (n) as determined by the ratio of NP7/NP20 IgG1 titers. For (l-n) antibody titers shown are displayed as arbitrary units (AU). For (c-h, l-n) The data are representative of two independent experiments (n = 16) where each symbol represents the mean ± SD and p-values were generated by performing a two-way ANOVA with Sidak’s multiple comparisons test. Source data
Extended Data Fig. 3
Extended Data Fig. 3. The spatial organization of the GC is disrupted in aged C57BL/6 mice.
(a) Representative confocal images of GCs at 20x from adult and aged C57BL/6 mice 12 days after immunization with NP-OVA in alum. Scale bars are 100 µm. LN sections were stained for IgD (green), CD35 (white), Ki67 (blue) and CD3 (magenta). Enumeration of GC number (b) and area (c) per LN was performed by examining 6–10 sections throughout each LN and identifying GCs as CD35+Ki67+IgD structures. (d) Quantification of the CD35+ FDC network light zone area of the GC. (e) Quantification of the Ki67+CD35 dark zone area of the GC. (f) Quantification of the number of CD3+ T cells identified within the total Ki67+CD35+IgD GC area. Quantification of the proportion of T cells positioned in the CD35+ FDC light zone area (g) and Ki67+CD35 dark zone (h) of the GC (n = 15). (i) Representative confocal images of GCs at 40x from unimmunized naive adult and aged C57BL/6 mice and (j) quantification of the CD35+ FDC network in the primary B cell follicle (n = 11). For (b-h, j), quantification of the GC compartments and T cell positioning was performed using an automated Cell Profiler pipeline. The data is representative of two independent experiments where each symbol on the graph represents a mouse and the bar height represents the median. The p-values were generated by performing an unpaired, two-tailed Mann Whitney U test. Source data
Extended Data Fig. 4
Extended Data Fig. 4. Tfr cell reduction in aged mice does not enhance GC responses.
(a) Representative flow cytometry plots identifying Tfr cells (PD1+CXCR5+CD4+Foxp3+B220) in the iLNs of adult and aged C57BL/6 mice 10 days post-immunization with 1W1K-NP in alum. The frequency (b) and total number (c) of Tfr cells in adult and aged C57BL/6 mice was quantified at days 0, 7,10, 14 and 21 after immunization with 1W1K-NP in alum. The data is representative of two independent experiments (n = 14) where each symbol represents the mean ± SD and p-values were generated by performing a two-way ANOVA with Sidak’s multiple comparisons test. (d) Representative flow cytometry plots indicating deletion of Tfr cells in aged 90–97-week-old Foxp3creCxcr5fl/fl mice compared to aged littermate control Foxp3cre mice 10 days after immunization with NP-KLH in alum. Quantification of the frequency (e) and total number (f) of Tfr cells (n = 12). (g) Representative flow cytometry plots identifying GC B cells (GL7+CD38B220+GR-1-) in Foxp3creCxcr5fl/fl mice 10 days after immunization with NP-KLH in alum. Quantification of the frequency (h) and total number (i) of GC B cells (n = 12). The values next to the gates on flow cytometry plots indicate the population percentage. The data is representative of two independent experiments where each symbol represents a mouse, and the bar height represents the median. The p-values were obtained by performing an unpaired, two-tailed Mann-Whitney U test. Source data
Extended Data Fig. 5
Extended Data Fig. 5. A proportion of GC Tfh cells express CXCR4 and its expression is also increased in Tfh cells from aged mice upon ChAdOx1-nCoV19 immunization and influenza infection as well as in CD4+ T cells from human peripheral blood cells.
(a) Five S1pr2ERTcre Rosa26stop-flox-RFP mice were immunized with 50uL of ChAdOx1 nCoV-19 intramuscularly, followed by oral gavage of Tamoxifen at 8- and 10-days post immunization. Dots show CXCR4 expression on S1PR2- Tfh cells and S1PR2-fatemapped GC Tfh cells 14 days after immunization (n = 10 biologically independent samples). (b) Six C57BL/6 mice were infected with influenza and CXCR4 expression assessed on CD90 + Tfh cells and CD90low GC Tfh cells 14 days after infection (n = 12 biologically independent samples). (c) Median fluorescence intensity of CXCR4 on PD1+CXCR5+Foxp3 Tfh cells and CXCR5 MFI on Bcl6+PD-1+Foxp3 Tfh cells isolated from the draining iliac of adult and aged mice 14 days after immunization with NP-KLH/Alum (n = 18). (d) Median fluorescence intensity of CXCR4 on PD1+CXCR5+Foxp3 Tfh cells and CXCR5 MFI on Bcl6+PD-1+Foxp3 Tfh cells isolated from the draining iliac LN (left) and spleen (right) of adult and aged mice 9 days after immunization with the Oxford/AstraZeneca COVID-19 vaccine candidate ChAOx1-nCoV19 (n = 14). (e) Median fluorescence intensity of CXCR4 on PD1+CXCR5+Foxp3 Tfh cells and CXCR5 MFI on Bcl6+PD-1+Foxp3 Tfh cells isolated from the draining mediastinal LN (left) and spleen (right) of adult and aged mice 14 days after infection with influenza (n = 11). (f) Flow cytometric quantification of the percentage (left) of CXCR4+ cells and CXCR4 MFI (right) from CD45RACD4+ T cells from human peripheral blood mononuclear cells (n = 42). (g) Flow cytometric quantification of the %CXCR4+ cells and CXCR4 MFI from CXCR5+CD45RACD4+ circulating Tfh cells, and %CXCR5+ cells and CXCR5 MFI on ICOS+CD38+CD45RACD4+ circulating Tfh cells from human peripheral blood mononuclear cells seven days after seasonal influenza vaccination (n = 34). Bar heights indicate median, each symbol represents a biological replicate and p-values were obtained by performing an unpaired, two-tailed Mann-Whitney U test. In (a-b) each symbol represents an animal, with each mouse connected by a line. P-value is from a paired non-parametric t-test. Source data
Extended Data Fig. 6
Extended Data Fig. 6. Deletion of CXCR4 on T cells does not impair activation and Tfh differentiation.
(a) Experimental outline of in vitro 4-OH tamoxifen treatment of CD4+ T cells isolated from Cxcr4fl/fl; Rosa26ERT2Cre/+ OT-II mice which were treated with 200 nM of 4-OH tamoxifen for 48 hours after which the cells were labelled with cell trace violet (CTV) and transferred into adult B6SJL recipient mice. Recipient mice were immunized subcutaneously with OVA in alum and analysis was performed after 2.5 days. (b) Representative flow cytometry plots indicating CTV dilution by activated CD4+CD45.2+ T cells derived from control Cxcr4fl/fl; Rosa26ERT2+/+ (left) or Cxcr4fl/fl; Rosa26ERT2Cre/+ (right) OT-II mice. Quantification of the percentage (c) and total number (d) of proliferating CD4+CD45.2+ T cells that diluted CTV (n = 10). (e) Representative flow cytometry plots identifying PD1+CXCR5+CD4+CD45.2+ Tfh cells derived from the transferred Cxcr4fl/fl; Rosa26ERT2+/+ (left) or Cxcr4fl/fl; Rosa26ERT2Cre/+ (right) OT-II cells in the iLNs of recipient mice at day 10 after subcutaneous OVA immunization. Quantification of the percentage (f) and total number (g) of PD1+CXCR5+CD4+CD45.2+ Tfh cells derived from the transferred Cxcr4fl/fl; Rosa26ERT2+/+ or Cxcr4fl/fl; Rosa26ERT2Cre/+ OT-II cells. (h) Representative flow cytometry plot indicating the expression of CXCR4 by PD1+CXCR5+CD4+CD45.2+ Tfh cells derived from the transferred Cxcr4fl/fl; Rosa26ERT2+/+ or Cxcr4fl/fl; Rosa26ERT2Cre/+ OT-II cells. (i) Median fluorescence intensity (MFI) of CXCR4 by PD1+CXCR5+CD4+CD45.2+ Tfh cells derived from the transferred Cxcr4fl/fl; Rosa26ERT2+/+ or Cxcr4fl/fl; Rosa26ERT2Cre/+ OT-II cells (n = 15). Bar height on graphs is indicative of the median, each symbol represents a mouse and p-values were obtained by performing an unpaired, two-tailed Mann-Whitney U test. The data are representative of two independent experiments. Source data
Extended Data Fig. 7
Extended Data Fig. 7. T cell-specific heterozygosity of CXCR4.
Flow cytometry plot indicating the expression of CXCR4 (a) and median fluorescence intensity (MFI) of CXCR4 (b) by PD1+CXCR5+Foxp3 Tfh cells in iLNs of Cxcr4fl/+; Cd4+/+ or Cxcr4fl/+; Cd4Cre/+ mice 10 days after NP-OVA/Alum immunisation. Flow cytometry plots (c) and quantification (d, e) of Ki67+Bcl6+ GC B cells 10 days after NP-OVA/Alum immunisation of Cxcr4fl/+; Cd4+/+ and Cxcr4fl/+; Cd4Cre/+ mice. Flow cytometry plots (f) and quantification (g, h) PD1+CXCR5+ Tfh cells 10 days after NP-OVA immunisation of Cxcr4fl/+; Cd4+/+ and Cxcr4fl/+; Cd4Cre/+ mice (n = 11). (i) Representative 20x confocal images of GCs at day 10 after NP-OVA immunisation in the iLNs of Cxcr4fl/+; Cd4+/+ mice (top) and Cxcr4fl/+; Cd4Cre/+ mice (bottom); scale bar is 100 µm. IgD (green), Ki67 (blue), CD35 (white) and CD3e (magenta). Quantification of the total GC area (j), the total number of CD3+ T cells within the GC (k), the percentage of CD3+ T cells localising to the CD35+ light zone area (l) and the Ki67+CD35 dark zone area (m), the CD35+ FDC network light zone area (n) and the Ki67+CD35 dark zone area (o) in iLNs of Cxcr4fl/+; Cd4+/+ and Cxcr4fl/+; Cd4Cre/+ mice (n = 14). (p) Serum titres of NP20 and NP2 specific IgG1 and their ratio in Cxcr4fl/+; Cd4+/+ and Cxcr4fl/+; Cd4Cre/+ mice 35 days post-immunisation with NP-OVA/Alum. (q) Enumeration of NP20 (left) and NP2 (middle) IgG1 antibody-secreting cells (ASCs) and their ratio in the bone marrow of Cxcr4fl/+; Cd4+/+ and Cxcr4fl/+; Cd4Cre/+ mice at 35 days post-immunisation with NP-OVA. Data on (p) and (q) are pooled from two independent experiments and symbol colour represents different experiments (n = 19). Bar height indicates the median, each symbol represents a mouse, and p-values from an unpaired, two-tailed Mann-Whitney U test. Data are representative of two independent experiments. Source data
Extended Data Fig. 8
Extended Data Fig. 8. CD4+ T cell-specific deletion of CXCR5, flow cytometric analysis of immunized Cxcr5fl/fl; Cd4Cre/+ mice.
(a) Representative flow cytometry plot indicating the expression of CXCR5 by PD1+Bcl6+Foxp3 Tfh cells in iLNs of Cxcr5fl/fl; Cd4+/+ or Cxcr5fl/fl; Cd4Cre/+ mice 10 days after NP-OVA immunization. (b) Median fluorescence intensity (MFI) of CXCR5 by PD1+ Bcl6+Foxp3 Tfh cells of Cxcr5fl/fl; Cd4+/+ or Cxcr5fl/fl; Cd4Cre/+ mice (n = 14). Bar height on graphs is indicative of the median, each symbol represents a mouse and p-values were obtained by performing an unpaired, two-tailed Mann-Whitney U test. The data are representative of two independent experiments. (c) Representative flow cytometry plots identifying Ki67+Bcl6+ GC B cells 10 days after NP-OVA immunization of Cxcr5fl/fl; Cd4+/+ (left) and Cxcr5fl/fl; Cd4Cre/+ (right) mice; values adjacent to gates indicate percentages. Quantification of the percentage (d) and total number (e) of Ki67+Bcl6+ GC B cells at days 10, 21 and 35 after NP-OVA immunization of Cxcr5fl/fl; Cd4+/+ and Cxcr5fl/fl; Cd4Cre/+ mice. (f) Representative flow cytometry plots identifying PD1+Bcl6+ Tfh cells 10 days after NP-OVA immunization of Cxcr5fl/fl; Cd4+/+ (left) and Cxcr5fl/fl; Cd4Cre/+ (right) mice; values adjacent to gates indicate percentages. Quantification of the percentage (g) and total number (h) of PD1+Bcl6+ Tfh cells at days 10, 21 and 35 after NP-OVA immunization of Cxcr5fl/fl; Cd4+/+ and Cxcr5fl/fl; Cd4Cre/+ mice. The data is representative of two independent experiments (n = 14) where each symbol represents the mean ± SD and p-values were generated by performing a two-way ANOVA with Sidak’s multiple comparisons test. Source data
Extended Data Fig. 9
Extended Data Fig. 9. Imaging of GCs from Cxcr5fl/fl; Cd4ERT2Cre/+ mice after immunization.
(a) Representative confocal images of GCs at day 14 after NP-KLH/Alum immunization in the iLNs of control Cxcr5+/+; Cd4ERT2Cre/+ mice (left) and Cxcr5fl/fl; Cd4ERT2Cre/+ mice (right). Scale bars are 100 µm. LN sections were stained for IgD (green), GL7 (blue), CD16/32 (yellow) and CD4 (red). The outline of the region of interest of the GC used for analysis is outlined in white. (b) Quantification of the total area of GCs identified by immunofluorescence as GL7+CD16/32+IgD regions in the iLNs of Cxcr5+/+; Cd4ERT2Cre/+ mice and Cxcr5fl/fl; Cd4ERT2Cre/+ mice. (c) Quantification of the total number of CD4+ T cells within the GL7+CD16/32+IgDGC area of Cxcr5+/+; Cd4ERT2Cre/+ mice and Cxcr5fl/fl; Cd4ERT2Cre/+ mice. (d) Percentage of CD4+ T cells localizing to the CD16/32+ light zone area of the GC in Cxcr5+/+; Cd4ERT2Cre/+ mice and Cxcr5fl/fl; Cd4ERT2Cre/+ mice. (e) Percentage of CD4+ T cells localizing to the GL7+CD16/32 dark zone area of the GC in Cxcr5+/+; Cd4ERT2Cre/+ mice and Cxcr5fl/fl; Cd4ERT2Cre/+ mice. (f) Quantification of the CD16/32+ FDC network area representative of the light zone compartment of the GCs of Cxcr5+/+; Cd4ERT2Cre/+ mice and Cxcr5fl/fl; Cd4ERT2Cre/+ mice. (g) Quantification of the GL7+CD16/32 dark zone area within the GCs of Cxcr5+/+; Cd4ERT2Cre/+ mice and Cxcr5fl/fl; Cd4ERT2Cre/+ mice. Quantification was performed using ImageJ. Bar heights on graphs represent the median, each symbol represents a mouse and p-values were obtained by performing an unpaired, two-tailed Mann-Whitney U test (n = 13 biologically independent samples). Source data
Extended Data Fig. 10
Extended Data Fig. 10. T cell-specific heterozygosity of CXCR5.
Flow cytometry plot of CXCR5 (a) and its median fluorescence intensity (MFI) (b) by PD1+Bcl6+Foxp3 Tfh cells in iLNs of Cxcr5fl/+; Cd4+/+ or Cxcr5fl/+; Cd4Cre/+ mice 10 days after NP-OVA/Alum immunisation. Flow cytometry plots (c) and quantification (d, e) of Ki67+Bcl6+ GC B cells, and flow cytometry plots (f) and quantification (g, h) of PD1+Bcl6+ Tfh cells 10 days after NP-OVA immunisation of Cxcr5fl/+; Cd4+/+ and Cxcr5fl/+; Cd4Cre/+ mice (n = 11). (i) Representative 20x confocal images of GCs at day 10 after NP-OVA immunisation in the iLNs of control Cxcr5fl/+; Cd4+/+ mice (top) and Cxcr5fl/+; Cd4Cre/+ mice (bottom); scale bar is 100 µm. IgD (green), Ki67 (blue), CD35 (white) and CD3e (magenta). Quantification of the total GC area (j), the total number of CD3+ T cells within the GC (k), the percentage of CD3+ T cells localising to the CD35+ light zone area (l) and the Ki67+CD35 dark zone area (m), the CD35+ FDC network light zone area (n) and the Ki67+CD35 dark zone area (o) in iLNs of Cxcr5fl/+; Cd4+/+ and Cxcr5fl/+; Cd4Cre/+ mice (n = 14). (p) Serum titres of NP20 and NP2 specific IgG1, and their ratio of Cxcr5fl/+; Cd4+/+ and Cxcr5fl/+; Cd4Cre/+ mice 35 days post-immunisation with NP-OVA. (q) Enumeration of NP20 (left) and NP2 (middle) IgG1 antibody-secreting cells (ASCs) and affinity maturation indicated by the ratio of NP2/NP20 ASCs (right) in the bone marrow of Cxcr5fl/+; Cd4+/+ and Cxcr5fl/+; Cd4Cre/+ mice at 35 days post-immunisation with NP-OVA. Data on (p) and (q) are pooled from two independent experiments and symbol colour represents different experiments (n = 19). For all bar graphs, bar height indicates the median, each symbol represents a mouse, and p-values were obtained by performing an unpaired, two-tailed Mann-Whitney U test. Data are representative of two independent experiments. Source data

References

    1. Lee, J. L. & Linterman, M. A. Mechanisms underpinning poor antibody responses to vaccines in ageing. Immunol. Lett.241, 1–14 (2022). - PMC - PubMed
    1. Prendecki M, et al. Effect of previous SARS-CoV-2 infection on humoral and T-cell responses to single-dose BNT162b2 vaccine. Lancet. 2021;397:1178–1181. doi: 10.1016/S0140-6736(21)00502-X. - DOI - PMC - PubMed
    1. Collier DA, et al. Age-related immune response heterogeneity to SARS-CoV-2 vaccine BNT162b2. Nature. 2021;596:417–422. doi: 10.1038/s41586-021-03739-1. - DOI - PMC - PubMed
    1. Müller L, et al. Age-dependent immune response to the Biontech/Pfizer BNT162b2 coronavirus disease 2019 vaccination. Clin. Infect. Dis. 2021;73:2065–2072. doi: 10.1093/cid/ciab381. - DOI - PMC - PubMed
    1. Zhu FC, et al. Immunogenicity and safety of a recombinant adenovirus type-5-vectored COVID−19 vaccine in healthy adults aged 18 years or older: a randomised, double-blind, placebo-controlled, phase 2 trial. Lancet. 2020;396:479–488. doi: 10.1016/S0140-6736(20)31605-6. - DOI - PMC - PubMed

Publication types