. 2024 Apr;42(4):608-616.
doi: 10.1038/s41587-023-01801-z. Epub 2023 May 22.

Spatial imaging of glycoRNA in single cells with ARPLA

Affiliations

Spatial imaging of glycoRNA in single cells with ARPLA

Yuan Ma et al. Nat Biotechnol. 2024 Apr.

Abstract

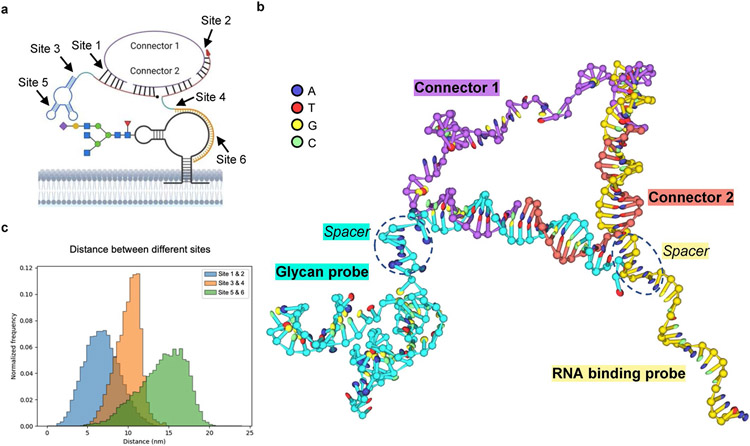
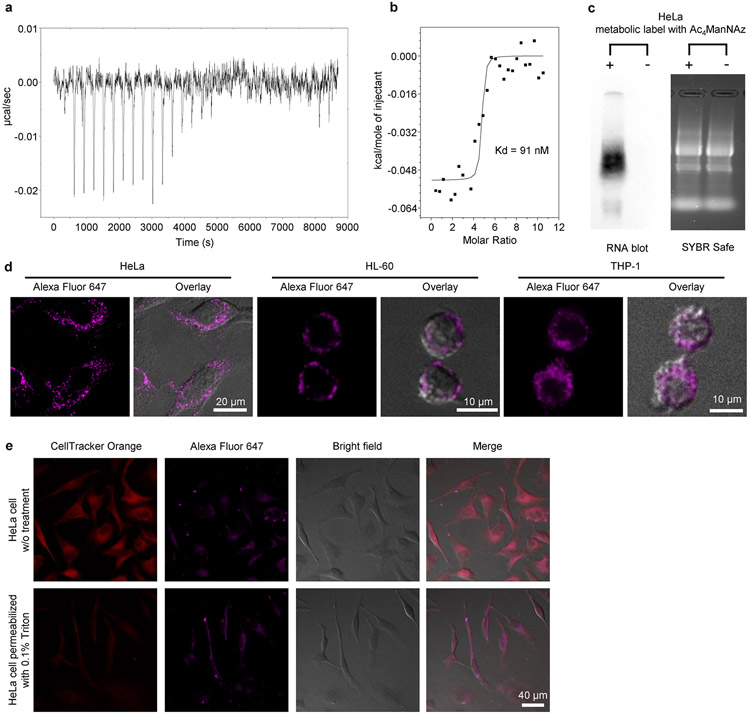
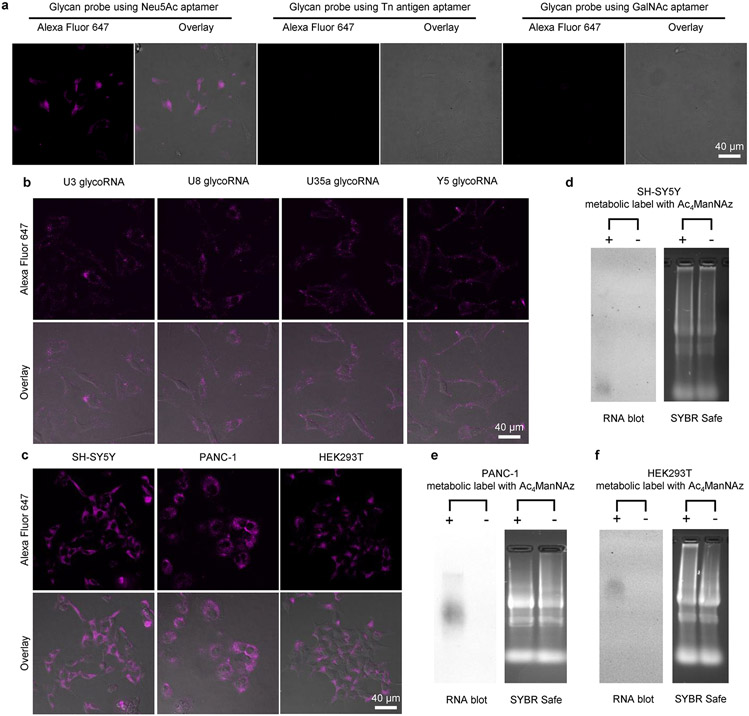
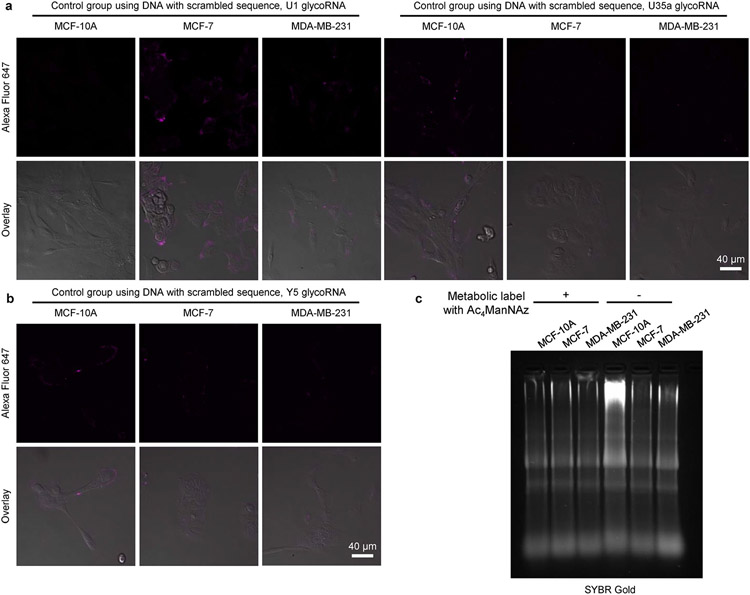
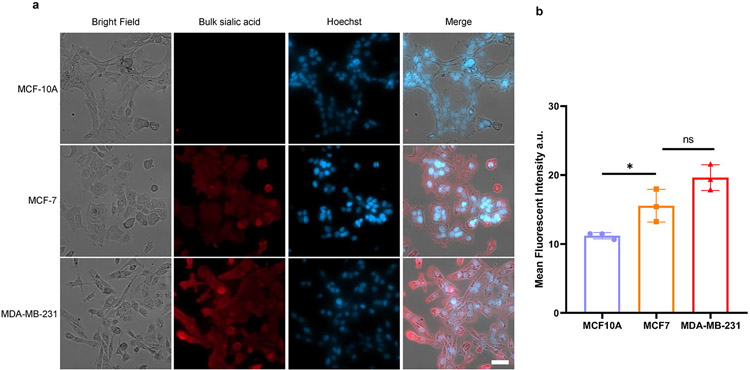
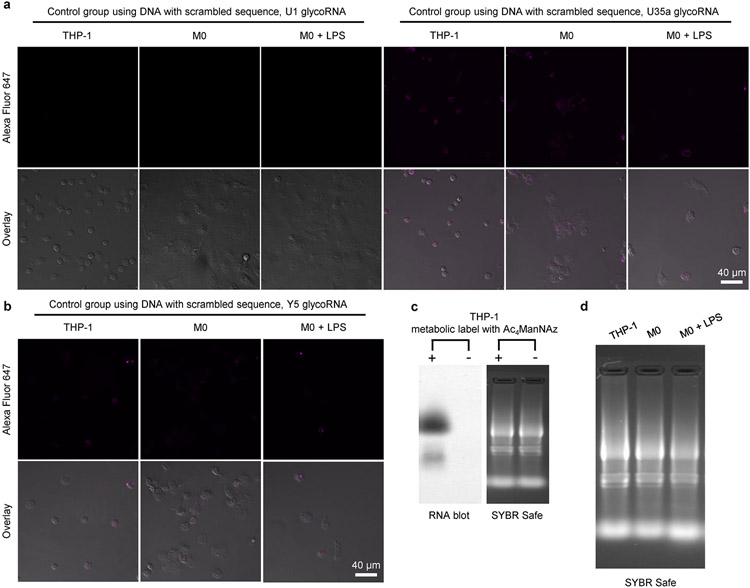
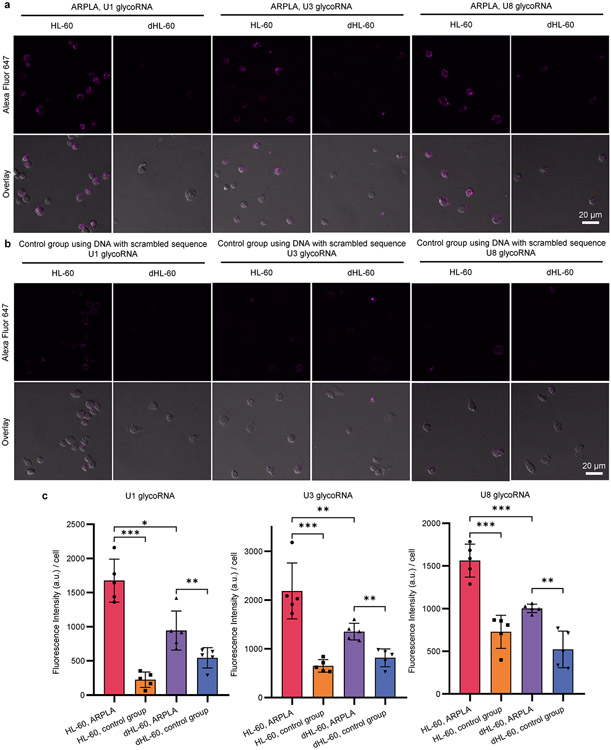
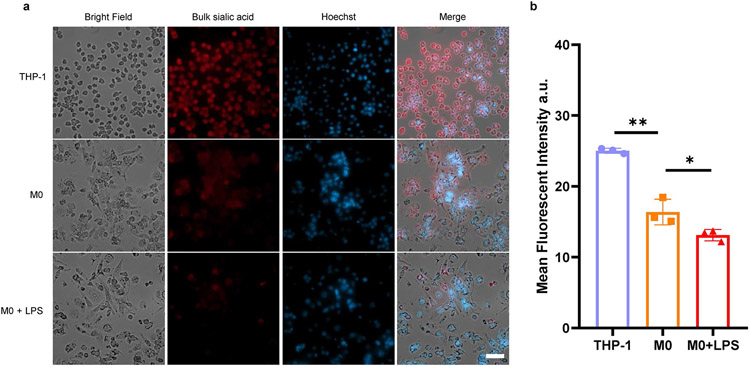
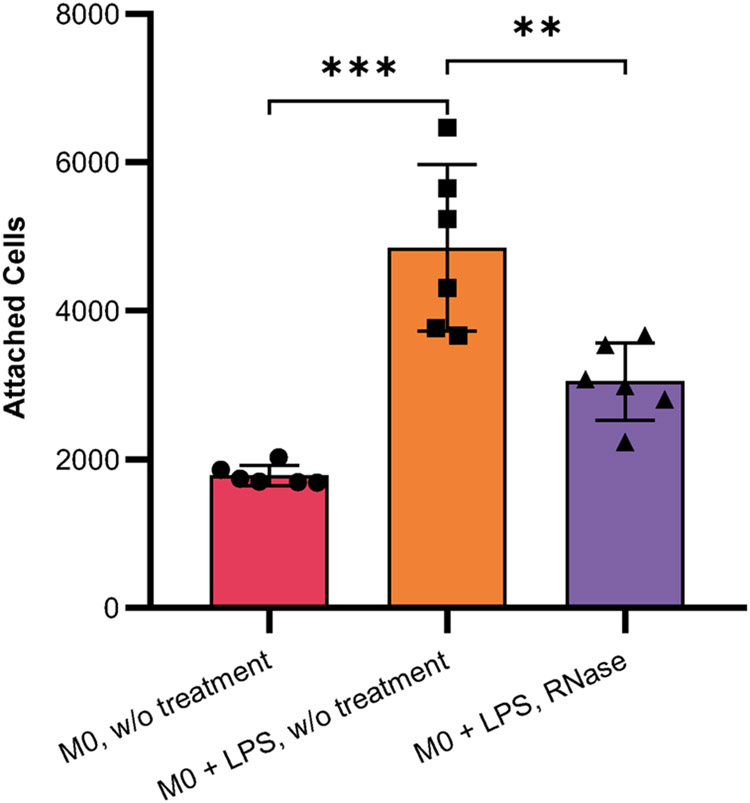
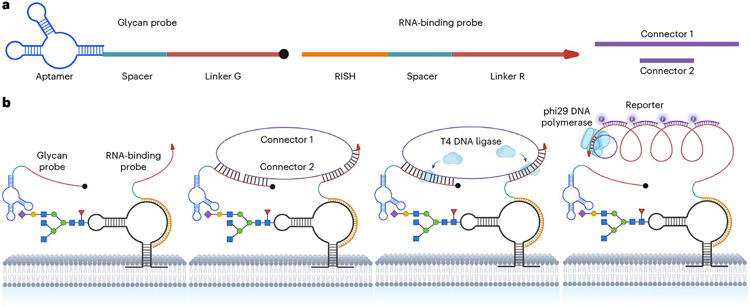
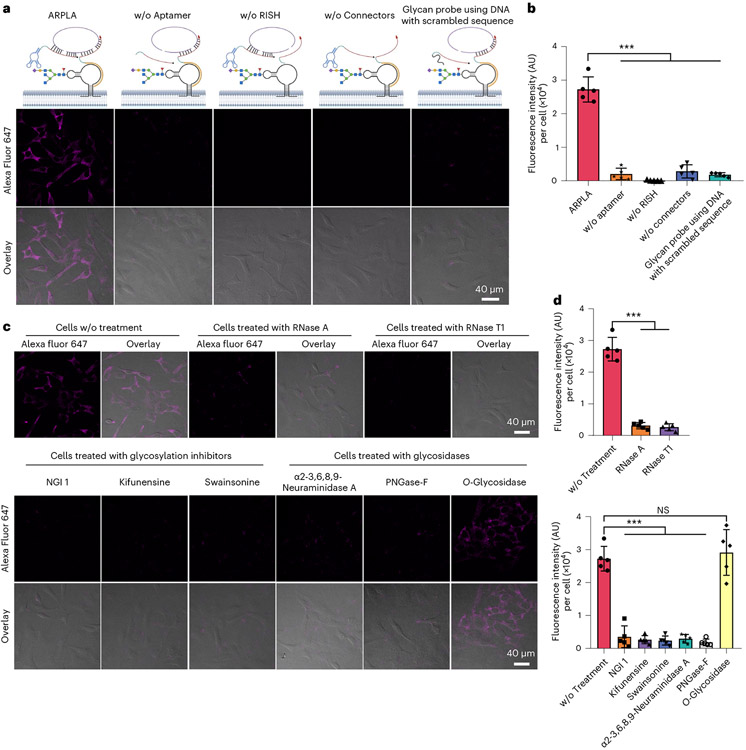
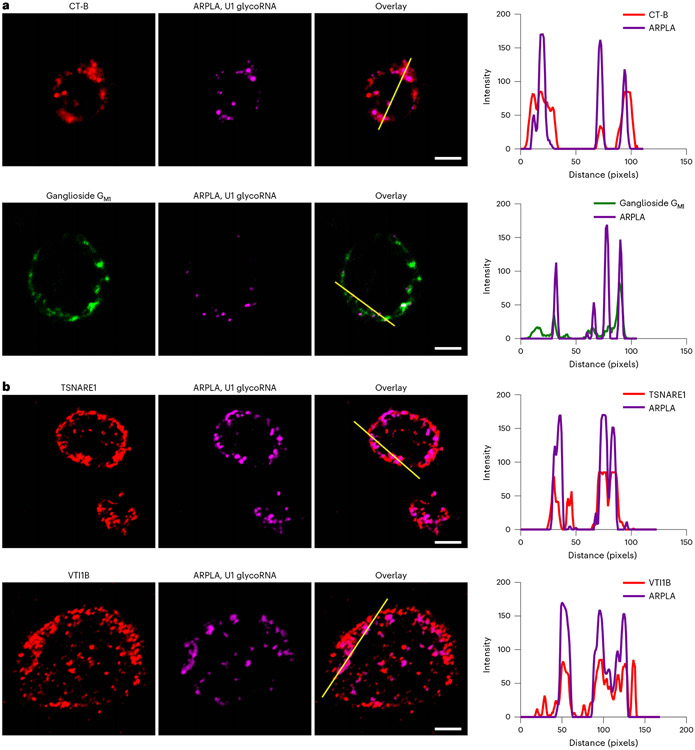
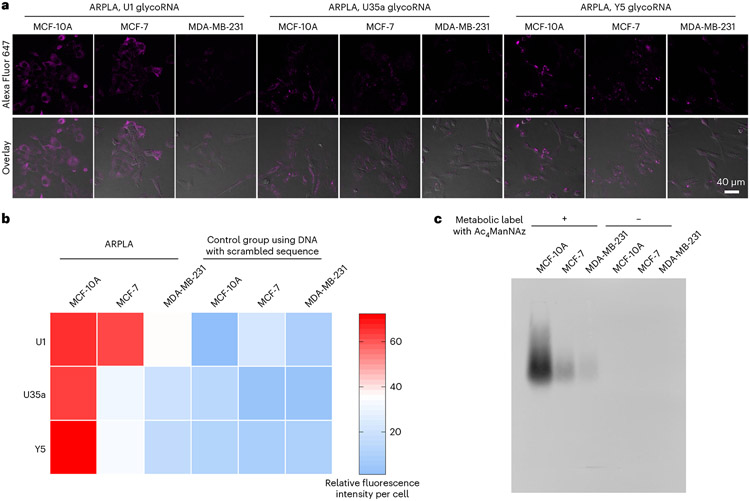
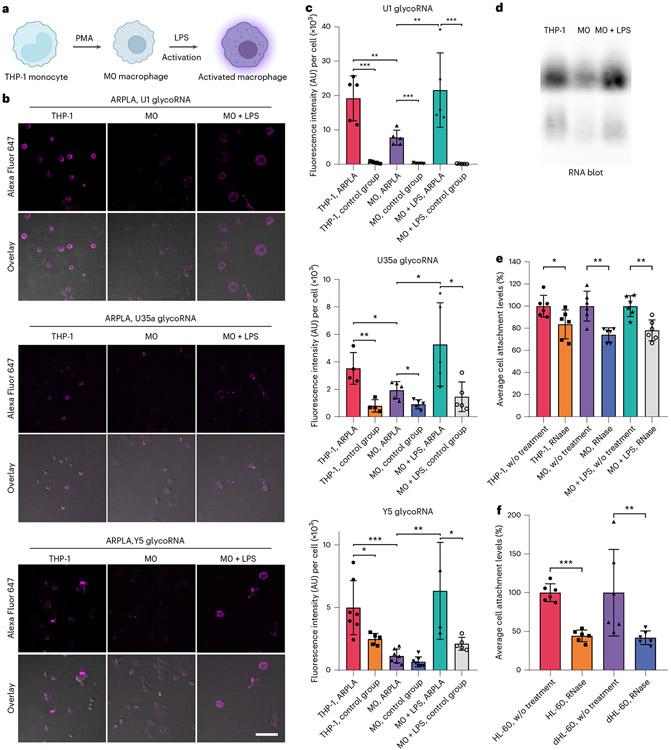
Little is known about the biological roles of glycosylated RNAs (glycoRNAs), a recently discovered class of glycosylated molecules, because of a lack of visualization methods. We report sialic acid aptamer and RNA in situ hybridization-mediated proximity ligation assay (ARPLA) to visualize glycoRNAs in single cells with high sensitivity and selectivity. The signal output of ARPLA occurs only when dual recognition of a glycan and an RNA triggers in situ ligation, followed by rolling circle amplification of a complementary DNA, which generates a fluorescent signal by binding fluorophore-labeled oligonucleotides. Using ARPLA, we detect spatial distributions of glycoRNAs on the cell surface and their colocalization with lipid rafts as well as the intracellular trafficking of glycoRNAs through SNARE protein-mediated secretory exocytosis. Studies in breast cell lines suggest that surface glycoRNA is inversely associated with tumor malignancy and metastasis. Investigation of the relationship between glycoRNAs and monocyte-endothelial cell interactions suggests that glycoRNAs may mediate cell-cell interactions during the immune response.


Figures

Extended Data Fig. 1 ∣
Extended Data Fig. 1 ∣. MD simulation of the structure of the ARPLA system.
(a) A representation of the ARPLA system with different sites (site 1-6) chosen to analyze distances; (b) A representative structure from the simulation with oxDNA, including the glycan probe, the RNA binding probe, the connector 1, and the connector 2. The circle of the connector 1 and the connector 2 tends to form a triangle structure, with two sides formed by DNA helix and one side formed by the ssDNA region in the connector 1; (c) The distributions of the distance between interested sites. 3 sets of distances were calculated with oxDNA tool, including the distances between the edges of the connector 1 ssDNA region (site 1 and site 2), between the ends of spacers of the Glycan probe and the RNA binding probe (site 3 and site 4), and between the predicted glycan binding site and the center of the RISH site (site 5 and site 6). The distance between site 1 and site 2 is in the range of 1-14 nm, with an average around 7 nm. The results agree with the B-form DNA length of the connector 1 ssDNA region (43 nt, around 14.3 nm), with the consideration of ssDNA bending and folding. The distance between site 3 and site 4 is in the range of 5-15 nm, with an average around 10 nm. The distance between site 5 and site 6 is in the range of 5-20 nm, with an average around 15 nm.
Extended Data Fig. 2 ∣
Extended Data Fig. 2 ∣. Verification of ARPLA method using HeLa as a model cell line.
(a) Thermogram for the ITC titration of 20 μM Neu5Ac aptamer titrated by 1 mM Neu5Ac in aptamer binding buffer; (b) Integrated heat of the ITC titration for Neu5Ac aptamer and Neu5Ac, the black line represents the binding curve fitted with the ‘one set of binding sites’ model; (c) Blotting of total RNA from HeLa cells after metabolic labeling with Ac4ManNAz, or HeLa cells without metabolic labeling; (d) ARPLA-mediated glycoRNA imaging on the surface of HeLa, HL-60, and THP-1 cells. Scale bar: 20 μm (HeLa), 10 μm (HL-60, THP-1); (e) Transmission-through dye microscopic image of HeLa cell. The membrane permeable dye (CellTracker Orange CMRA) and the membrane impermeant quencher acid blue 9 (AB9) were applied to the same cells. AB9 cannot enter the cell with intact membrane and thus cannot quench the membrane permeable dye, so the cells with intact membrane show bright fluorescence signals from CellTracker Orange CMRA. Leaky or damaged membrane after permeabilization treatment allows for the quencher to enter the cell, resulting in reduced or diminished fluorescence of the cell. Scale bar: 40 μm. All experiments were repeated independently three times with similar results.
Extended Data Fig. 3 ∣
Extended Data Fig. 3 ∣. Evaluation of the generality of ARPLA.
(a) CLSM images of glycoRNAs, utilizing ARPLA with Glycan probes with Neu5Ac aptamer, Tn antigen aptamer, and GalNAc aptamer; (b) Visualization of glycoRNAs with various RNA sequences, including U3, U8, U35a, and Y5; (c) CLSM images of U1 glycoRNA in different cell lines, such as SH-SY5Y, PANC-1, and HEK293T. Scale bars (b,c): 40 μm; (d) Blotting of total RNA from SH-SY5Y cells after metabolic labeling with Ac4ManNAz, or SH-SY5Y cells without metabolic labeling; (e) Blotting of total RNA from PANC-1 cells after metabolic labeling with Ac4ManNAz, or PANC-1 cells without metabolic labeling; (f) Blotting of total RNA from HEK293T cells after metabolic labeling with Ac4ManNAz, or HEK293T cells without metabolic labeling.
Extended Data Fig. 4 ∣
Extended Data Fig. 4 ∣. 3D visualization of the spatial distributions of U1 glycoRNA and CT-B in HL-60 cells.
Z-stack images were collected with the staining of U1 glycoRNA by ARPLA (green) and lipid raft by CT-B (red). The images were shown in z-slices format (a), orthographic projection (b), and maximum intensity projection (c). Scale bar: 2 μm. The z-stack colocalization was repeated independently three times with similar results.
Extended Data Fig. 5 ∣
Extended Data Fig. 5 ∣. Visualization of glycoRNAs in malignant transformation using ARPLA, related with Fig. 4.
(a,b) CLSM images of MCF-10A, MCF-7, MDA-MB-231 cells in control groups using DNA with scrambled sequences. (c) Agarose gel electrophoresis image of total RNA from MCF-10A, MCF-7, MDA-MB-231 cells. These cells were treated with Ac4ManNAz for 48 h before RNA extraction. All experiments were repeated independently 3 times with similar results.
Extended Data Fig. 6 ∣
Extended Data Fig. 6 ∣. Fluorescence imaging of bulk sialic acid on the cell surface of MCF-10A, MCF-7, and MDA-MB-231 cells.
(a) Representative cell fluorescent images of bulk sialic acid. These cells were metabolically labeled by Ac4ManNAz for 24 h, followed by incubation with DBCO-PEG4-biotin and Cy5-streptavidin for fluorescence imaging. Scale bars for cell image: 50 μm. (b) Bar plot of the mean fluorescent intensities, the data were calculated from 3 biological replicates. The plot is shown in mean ± SD. Unpaired two-tailed Student’s t-test determines the statistical significance as (*) p = 0.0352, (ns) p = 0.0793, n = 3 independent replicates.
Extended Data Fig. 7 ∣
Extended Data Fig. 7 ∣. Visualization of glycoRNA level during THP-1 differentiation and activation by LPS, related with Fig. 5.
(a, b) CLSM images of THP-1 monocyte, resting M0 macrophage, and activated M0 macrophage by LPS, which are treated with DNA probe with scrambled sequence to replace aptamer in ARPLA. (c) Blotting of total RNA from THP-1 cells after metabolic labeling with Ac4ManNAz or THP-1 cells without metabolic labeling. (d) Agarose gel electrophoresis image of total RNA from THP-1 monocyte, resting M0 macrophage, and activated M0 macrophage by LPS. These cells were treated with Ac4ManNAz for 48 h before RNA extraction. All experiments were repeated independently three times with similar results.
Extended Data Fig. 8 ∣
Extended Data Fig. 8 ∣. Investigation of glycoRNA levels during HL-60 differentiation.
(a) CLSM images of U1, U3, and U8 glycoRNA levels evaluated by ARPLA in HL-60 and dHL-60 cells; (b) CLSM images of HL-60, dHL-60 cells in control groups using DNA with scrambled sequences; (c) Quantitative analysis for relative fluorescence intensity of ARPLA in (a) and (b). Data in (c) are representative of three independent experiments, n = 5 frames. Data are mean ±S.D. The statistical significance is determined by unpaired two-tailed Student’s t-test as (ns) not significant, (*) P < 0.05, (**) P < 0.01, and (***) P < 0.001. P (U1 HL60 vs. dHL60) = 0.0159, P (U3 HL60 vs. dHL60) = 0.0079, P (U8 HL60 vs. dHL60) = 0.0002.
Extended Data Fig. 9 ∣
Extended Data Fig. 9 ∣. Fluorescence imaging of bulk sialic acid on the cell surface of THP-1 monocyte, resting M0 macrophage (M0), LPS activated M0 macrophage (M0 + LPS).
(a) Representative images of total sialic acid. These cells were metabolically labeled by Ac4ManNAz for 24 h, followed by incubation with DBCO-PEG4-biotin and Cy5-streptavidin for fluorescence imaging. Scale bars for cell image: 50 μm. (b) Quantification of the mean fluorescent intensity of the images, n = 3 biological replicates. Data are mean ±S.D. Unpaired two-tailed Student’s t-test determines the statistical significance. (**) p = 0.0013, (*) p = 0.0469.
Extended Data Fig. 10 ∣
Extended Data Fig. 10 ∣. Cell attachment assay.
The average cell attachment levels in resting M0 macrophage, activated M0 macrophage by LPS, activated M0 macrophage after RNase treatment. Data are representative of three independent experiments, n = 6 technical repeats. Data are mean ±S.D. The statistical significance is determined by unpaired two-tailed Student’s t-test, (***) P < 0.0001, (**) P = 0.0051. Cell attachment assay was performed three times independently with similar results.
Fig. 1 ∣
Fig. 1 ∣. Schematic illustration of glycoRNA in situ imaging using ARPLA.
a, Structure and functional domains of the glycan probe, the RNA-binding probe and the connectors. b, Details of ARPLA for glycoRNA recognition and signal amplification.
Fig. 2 ∣
Fig. 2 ∣. Evaluation of ARPLA for glycoRNA imaging in HeLa cells.
a, CLSM images of glycoRNAs using ARPLA and various control groups in the absence of components for ARPLA; w/o, without. b, Quantification of average fluorescence intensity (arbitrary units (AU)) per cell in a; ***P < 0.0001. c, Validation of the specificity for ARPLA. Live HeLa cells were pretreated with RNase, glycosylation inhibitors or glycosidases, respectively, and fixed and analyzed by ARPLA. d, Quantification of average fluorescence intensity (AU) per cell in c. Data in b and d are representative of three independent experiments; n = 5 frames. Data are shown as mean ± s.d. Statistical significance was determined by unpaired two-tailed Student’s t-test; NS, not significant (P = 0.6100); ***P < 0.001.
Fig. 3 ∣
Fig. 3 ∣. Spatial distributions of glycoRNAs revealed by ARPLA in HL-60 cells.
a, Representative fluorescence imaging of lipid rafts, indicated by Alexa Fluor 555-labeled CT-B (top) or BODIPY dye-labeled sphingolipids (bottom), and glycoRNAs, imaged by ARPLA with U1 probe. The overlay images and plot profiles display the colocalization between glycoRNAs and lipid rafts; Pearson’s coefficients: r = 0.572 ± 0.130 (CT-B) and r = 0.539 ± 0.163 (BODIPY); scale bar, 5 μm. The intensities of different fluorochromes along the yellow lane in the overlay images are shown in the histograms on the right. b, Representative immunofluorescence images of t-SNARE (top) and v-SNARE (bottom) with glycoRNAs, indicating the intracellular trafficking of glycoRNAs. The overlay images and plot profiles show colocalization between glycoRNAs and t-SNARE (Pearson’s coefficient; r = 0.70) or v-SNARE (Pearson’s coefficient: r = 0.58); scale bar, 5 μm. The intensities of different fluorochromes along the yellow line in the merged images are shown in the histograms on the right. All experiments were repeated three times independently with similar results.
Fig. 4 ∣
Fig. 4 ∣. Visualization of glycoRNAs in malignant transformation using ARPLA.
a, CLSM images of U1, U35a and Y5 glycoRNAs by ARPLA in MCF-10A, MCF-7 and MDA-MB-231 cells. b, Heat map and quantitative analysis of relative fluorescence intensity in a and Extended Data Fig. 7a,b; n = 3 biological replicates. c, Total glycoRNA expression levels in MCF-10A, MCF-7 and MDA-MB-231 cells evaluated by RNA blotting. GlycoRNAs were metabolically labeled by Ac4ManNAz. The cell imaging experiments and RNA blotting assays were repeated three times independently with similar results.
Fig. 5 ∣
Fig. 5 ∣. Visualization of glycoRNA levels during THP-1 differentiation and activation by LPS.
a, Schematic of the differentiation and activation processes in THP-1 cells. b, CLSM images of U1, U35a and Y5 glycoRNA levels investigated by ARPLA in THP-1 monocytes, M0 macrophages and M0 macrophages activated by LPS; scale bar, 40 μm. c, Quantification analysis of fluorescence intensity (AU) per cell in b and Extended Data Fig. 10a,b; n = 5 frames; ***P < 0.001; top (U1 glycoRNA): PTHP-1 ARPLA, M0 ARPLA = 0.0060, PM0 ARPLA, M0 + LPS ARPLA = 0.0079; middle (U35a glycoRNA): PTHP-1 ARPLA, M0 ARPLA = 0.0321, PM0 ARPLA, M0 + LPS ARPLA = 0.0427; bottom (Y glycoRNA): PTHP-1 ARPLA, M0 ARPLA = 0.0006, PM0 ARPLA, M0 + LPS ARPLA = 0.0055. d, RNA blot of the total glycoRNA levels in THP-1 monocytes, M0 macrophages and M0 macrophages activated by LPS. e,f, Cell attachment levels in THP-1 models (e) and HL-60 models (f) after RNase treatment (normalized to the untreated control group). Data are representative of three independent experiments with n = 6 technical replicates. In e, PTHP1 = 0.0336, PM0 = 0.0017 and PM0 + LPS = 0.0024. In f, PHL-60 < 0.0001 and PdHL-60 = 0.0043. Data are shown as mean ± s.d. and were analyzed by unpaired two-tailed Student’s t-test; *P < 0.05; **P < 0.01; ***P < 0.001.

Comment in

References

    1. Reily C, Stewart TJ, Renfrow MB & Novak J Glycosylation in health and disease. Nat. Rev. Nephrol 15, 346–366 (2019). - PMC - PubMed
    1. Flynn RA et al. Small RNAs are modified with N-glycans and displayed on the surface of living cells. Cell 184, 3109–3124 (2021). - PMC - PubMed
    1. Caldwell RM & Flynn RA Discovering glycoRNA: traditional and non-canonical approaches to studying RNA modifications. Isr. J. Chem 63, e202200059 (2022).
    1. Suzuki T. The expanding world of tRNA modifications and their disease relevance. Nat. Rev. Mol. Cell Biol 22, 375–392 (2021). - PubMed
    1. Tyagi W, Pandey V & Pokharel YR Membrane linked RNA glycosylation as new trend to envision epi-transcriptome epoch. Cancer Gene Ther. 10.1038/s41417-022-00430-z (2022). - DOI - PubMed