. 2023 May 22;6(1):94.
doi: 10.1038/s41746-023-00837-4.

Solving the explainable AI conundrum by bridging clinicians' needs and developers' goals

Affiliations

Solving the explainable AI conundrum by bridging clinicians' needs and developers' goals

Nadine Bienefeld et al. NPJ Digit Med. .

Abstract

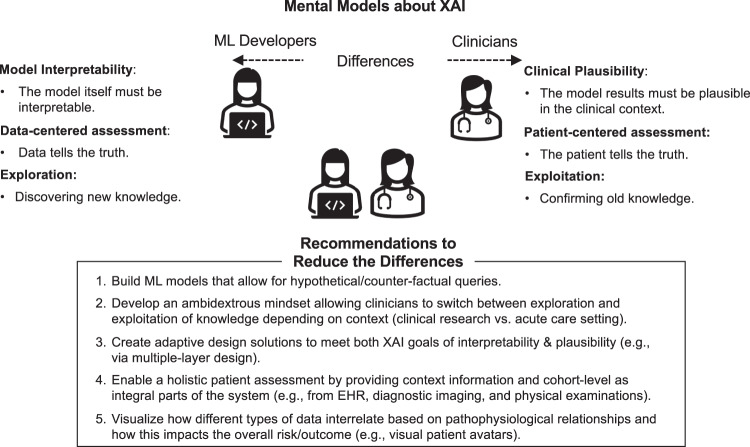
Explainable artificial intelligence (XAI) has emerged as a promising solution for addressing the implementation challenges of AI/ML in healthcare. However, little is known about how developers and clinicians interpret XAI and what conflicting goals and requirements they may have. This paper presents the findings of a longitudinal multi-method study involving 112 developers and clinicians co-designing an XAI solution for a clinical decision support system. Our study identifies three key differences between developer and clinician mental models of XAI, including opposing goals (model interpretability vs. clinical plausibility), different sources of truth (data vs. patient), and the role of exploring new vs. exploiting old knowledge. Based on our findings, we propose design solutions that can help address the XAI conundrum in healthcare, including the use of causal inference models, personalized explanations, and ambidexterity between exploration and exploitation mindsets. Our study highlights the importance of considering the perspectives of both developers and clinicians in the design of XAI systems and provides practical recommendations for improving the effectiveness and usability of XAI in healthcare.


Conflict of interest statement

The authors declare no competing interests.

Figures

Fig. 1
Fig. 1. Clinician assessment of the risk of DCI in a patient with or without the use of the DCIP.
ac Frequencies (in %) of multiple response answers for survey Q 1–3. Responses from physicians are displayed in orange and from nurses in blue.
Fig. 2
Fig. 2. Screenshot of the DCIP system user interface prototype.
The DCIP user interface aims to facilitate clinicians’ understanding of the ML model’s predictions with minimal time and effort. The header menu (A) displays information about the selected patient. In the overview frame (B), the current combined DCI risk score (0.8) is displayed, based on dynamic (0.72) and static (0.91) contributors (pink vs. blue hues indicating higher vs. lower risk). The static contributor view (C) displays Shapley values of static contributors assessed at the time of patient admission, including reference values for cohort-level evidence based on clinical norms such as the Barrow Neurological Institute Grading Scale (BNI), Hunt & Hess Grade, Modified Fisher Grade (MFS), Fisher Grade, and World Federation of Neurological Surgeons Grade (WFNS). The horizontal bar chart displays how the values below/above 0.5 decrease or increase the DCI risk score (in order of importance) The DCI probability frame (D) displays periods of high risk for DCI as colored areas under the curve, allowing clinicians to probe exact numeric values at each point in time. The solid line represents the combined risk fluctuating over time and the dashed line indicates the constant static probability (0.9). The Dynamic Contributors frame (E) displays a heatmap of Shapley values of dynamic contributors over time. Each heatmap lane shows how much a given signal (e.g., mOsm = Serum osmolality) contributes to the DCI risk at a given point in time (hover) and can be added (double-click) as an additional timeline displaying raw values below (F). Additional timelines can be added on demand to provide context for feature-level explanations (e.g., Heart Rate [bpm], intracranial pressure [mmHg], pupil reaction time). All timelines are in synch and can be zoomed/panned as desired. Individual points in time can be probed to reveal exact numeric values across all charts. For context information outside of the DCIP, clinicians can access the target patient’s complete health records (via the separate Electronic Health Record [EHR] system). Numbers 1–5 highlight the specific features referred to by interviewees when searching for model explanations (see Interview results).
Fig. 3
Fig. 3. Framework of XAI mental model differences and recommendations how to reduce the differences (see textbox).
ML Developers’ mental models (left) relate to model interpretability, a data-centered assessment, and an exploration mindset. Clinician’s mental models (right) aim for clinical plausibility, a patient-centered assessment, and an exploitation mindset.

References

    1. Meskó B, Görög M. A short guide for medical professionals in the era of artificial intelligence. Npj Digit. Med. 2020;3:1–8. doi: 10.1038/s41746-020-00333-z. - DOI - PMC - PubMed
    1. Rajpurkar P, Chen E, Banerjee O, Topol EJ. AI in health and medicine. Nat. Med. 2022;28:31–38. doi: 10.1038/s41591-021-01614-0. - DOI - PubMed
    1. Singh RP, Hom GL, Abramoff MD, Campbell JP, Chiang MF. Current challenges and barriers to real-world artificial intelligence adoption for the healthcare system, provider, and the patient. Transl. Vis. Sci. Technol. 2020;9:45. doi: 10.1167/tvst.9.2.45. - DOI - PMC - PubMed
    1. Arbelaez Ossa L, et al. Re-focusing explainability in medicine. Digit. Health. 2022;8:20552076221074490. - PMC - PubMed
    1. Amann J, et al. To explain or not to explain?—Artificial intelligence explainability in clinical decision support systems. PLOS Digit. Health. 2022;1:e0000016. doi: 10.1371/journal.pdig.0000016. - DOI - PMC - PubMed