. 2023 Aug;10(22):e2301802.
doi: 10.1002/advs.202301802. Epub 2023 May 22.

Synthetic Epigenetic Reprogramming of Mesenchymal to Epithelial States Using the CRISPR/dCas9 Platform in Triple Negative Breast Cancer

Affiliations

Synthetic Epigenetic Reprogramming of Mesenchymal to Epithelial States Using the CRISPR/dCas9 Platform in Triple Negative Breast Cancer

Charlene Waryah et al. Adv Sci (Weinh). 2023 Aug.

Abstract

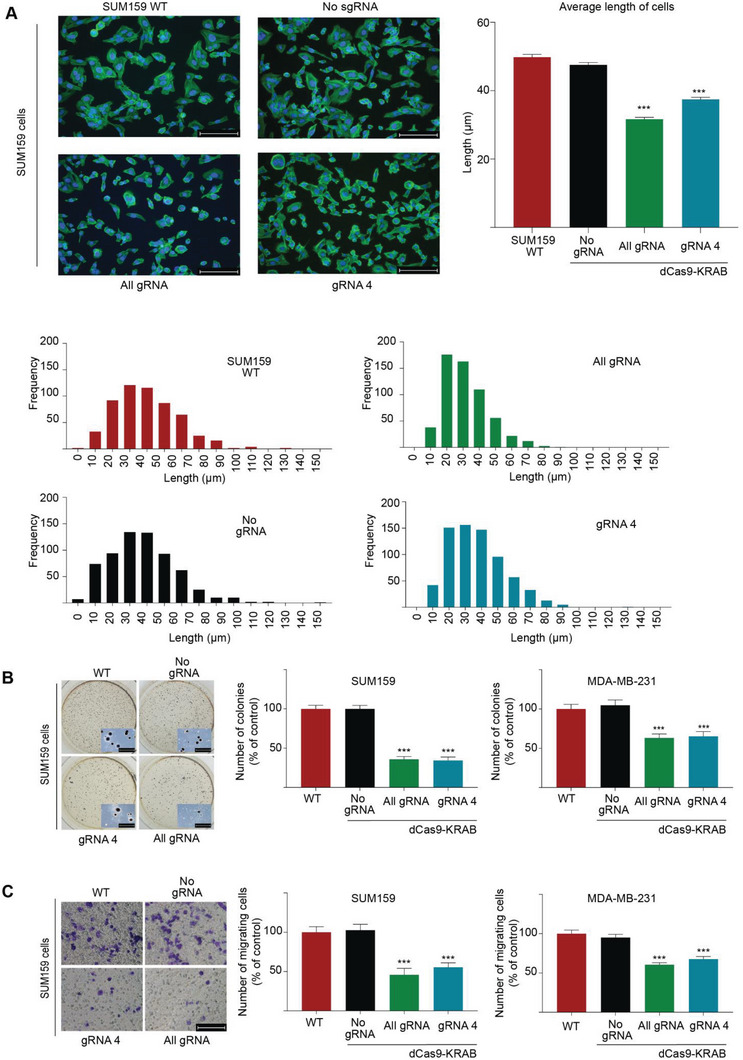
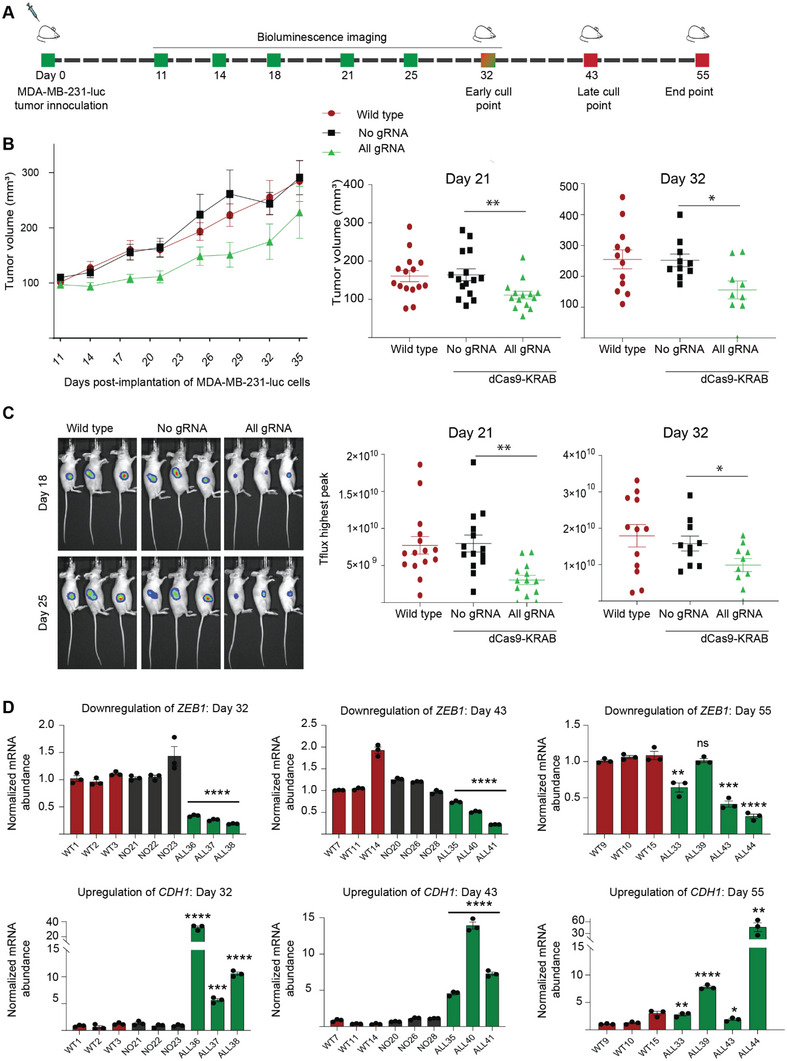
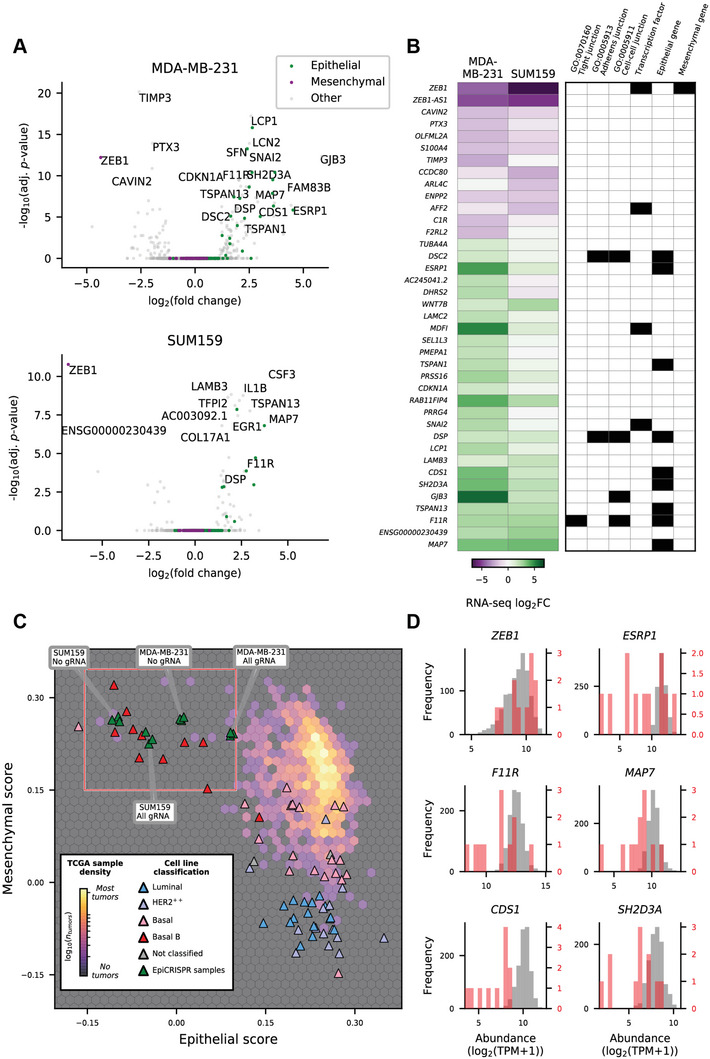
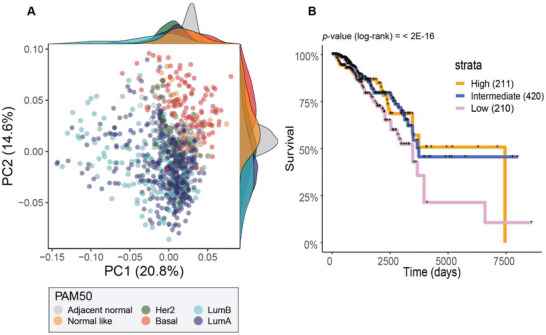
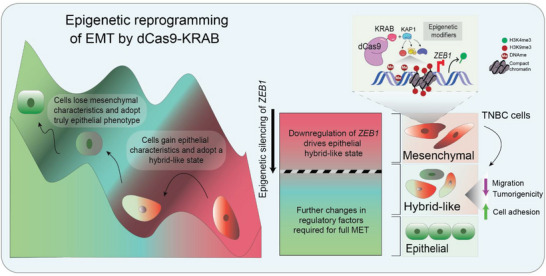
Epithelial-mesenchymal transition (EMT) is a reversible transcriptional program invoked by cancer cells to drive cancer progression. Transcription factor ZEB1 is a master regulator of EMT, driving disease recurrence in poor-outcome triple negative breast cancers (TNBCs). Here, this work silences ZEB1 in TNBC models by CRISPR/dCas9-mediated epigenetic editing, resulting in highly-specific and nearly complete suppression of ZEB1 in vivo, accompanied by long-lasting tumor inhibition. Integrated "omic" changes promoted by dCas9 linked to the KRAB domain (dCas9-KRAB) enabled the discovery of a ZEB1-dependent-signature of 26 genes differentially-expressed and -methylated, including the reactivation and enhanced chromatin accessibility in cell adhesion loci, outlining epigenetic reprogramming toward a more epithelial state. In the ZEB1 locus transcriptional silencing is associated with induction of locally-spread heterochromatin, significant changes in DNA methylation at specific CpGs, gain of H3K9me3, and a near complete erasure of H3K4me3 in the ZEB1 promoter. Epigenetic shifts induced by ZEB1-silencing are enriched in a subset of human breast tumors, illuminating a clinically-relevant hybrid-like state. Thus, the synthetic epi-silencing of ZEB1 induces stable "lock-in" epigenetic reprogramming of mesenchymal tumors associated with a distinct and stable epigenetic landscape. This work outlines epigenome-engineering approaches for reversing EMT and customizable precision molecular oncology approaches for targeting poor outcome breast cancers.

Keywords: CRISPR/dCas9 repression; ZEB1; cancer epigenetics; epithelial-mesenchymal transition; triple negative breast cancer.


Conflict of interest statement

The authors declare no conflict of interest.

Figures

Figure 1
Figure 1
CRISPR‐dCas9‐KRAB systems targeted to the ZEB1 promoter leads to silencing at both mRNA and protein levels. (A) Schematic representation of dCas9 fused to the Krüppel Associated Box (KRAB) domain targeted to ZEB1 proximal promoter by four gRNAs. Locations of the gRNA (in base pairs, bps) are depicted upstream or downstream (+/−) of the transcriptional start site (TSS). KRAB recruits the corepressor KAP1 which mediates downstream recruitment of Heterochromatin Protein alpha (HP1α, mediating chromatin remodeling), SET Domain Bifurcated Histone Lysine Methyltransferase 1 (SETDB1, histone methylation) and nucleosome remodeling and deacetylase complex (NuRD complex, histone deacetylation). (B) Silencing of ZEB1 mRNA expression assessed by qRT‐PCR and ZEB1 protein expression by western blotting. Relative mRNA expression was quantified to No gRNA control in SUM159 and MDA‐MB‐231 cells, ***p ≤ 0001. The breast line MCF12A is included as a normal control cell line for expression of epithelial markers. Error bars represent S.E.M. (C) Upregulation of CDH1 mRNA expression assessed by qRT‐PCR relative to No gRNA control in SUM159 and MDA‐MB‐231 cell lines, ***p ≤ 0.001. Error bars represent S.E.M. (D) Immunofluorescence for the intracellular visualization of ZEB1 expression (red) in gRNA 4 and All gRNA dCas9‐KRAB transduced MDA‐MB‐231 cells; Hoechst stain (blue) is indicated to label the nuclei. TSS, transcription start site; bp: base pair; gRNA, guide RNA; KRAB: Krüppel associated box; KAP1, Krüppel associated protein; CDH1, E‐cadherin.
Figure 2
Figure 2
CRISPR‐dCas9 silencing of ZEB1 reprograms the mesenchymal phenotype, inducing cell morphology changes, reduced migration and impaired colony formation. (A) Phalloidin immunofluorescence for the visualization of F‐actin in SUM159 wild type cells (untransduced), cells transduced with dCas9‐KRAB with no gRNA (No gRNA), or in presence of gRNA 4, or with All gRNAs. Average length of cells for each transduced population (n = 565) was measured on the major length axis, ***p ≤ 0.001. Error bars represent S.E.M. (B) Inhibition of anchorage‐independent cell growth by soft agar colony formation assays (representative images and detail of the colonies is included). Number of colonies per well are plotted as % of control for gRNA 4 and All gRNA in SUM159 and MDA‐MB‐231, respectively. Data is normalized to untransduced wild type and presented as mean values where error bars represent S.E.M, ***p ≤ 0.001. (C) Inhibition of cell invasion by Boyden migration chambers in the same cell lines. Representative images for SUM159 are displayed, along with quantification of the number of migrating cells for SUM159 and MDA‐MB‐231 cells relative to untransduced wild type cells. Error bars represent S.E.M, ***p ≤ 0.001. KRAB: Krüppel associated box. WT: wild type untransduced group.
Figure 3
Figure 3
Tumor‐intrinsic repression of ZEB1 in vivo suppresses the growth of breast cancer xenograft tumor models. (A) Schematic representation of the experimental time‐line. MDA‐MB‐231 cells labeled with a luciferase gene (MDA‐MB‐231‐luc) were transduced with either dCas9‐KRAB in absence of gRNA (No gRNA) or with dCas9‐KRAB with all designed gRNAs (All gRNA). Wild type refers to untranduced cells (MDA‐MB‐231‐luc with no dCas9‐KRAB transduction). 2 × 106 cells were implanted into the flank of BALB/c nude mice (n = 15 mice per group) and tumor growth monitored by caliper measurement and bioluminescence imaging (BLI). Mice (n = 3) were euthanized at day 32 for an “early” and at day 43 for a “late” time‐point for histological assessment; day 55 refers to experimental end‐point (volume of the tumors >1000 mm3). Bioluminescence was quantified at days 11, 14, 18, 21, 25, and 32 post‐implantation of the cells. (B) Tumor growth inhibition in vivo for the MDA‐MB‐231‐luc xenograft model assessed by caliper measurements, starting at day 11 post‐implantation when the tumor growth is ≈100 mm3 (at left). Scatter dot plots outlining the decrease in tumor volume at day 21 and day 32 post‐implantation of cells are indicated (at right) *p ≤ 0.05, ** p ≤ 0.01. Error bars represent S.E.M. (C) Representative bioluminescence images of mice in un‐transduced wild type and No gRNA versus All gRNA group captured at days 18 and 25. Tflux peaks are plotted at day 21 and day 32 post inoculation, * p ≤ 0.05, *** p ≤ 0.001. Error bars represent S.E.M. (D) Expression of ZEB1 and CDH1 assessed by qRT‐PCR from RNA extracted from tumors, each individual tumor is indicated separately, *p ≤ 0.05, **p ≤ 0.01, ***p ≤ 0.001, ***p ≤ 0.0001, ns = non‐significant. Error bars represent S.E.M. WT: untransduced wild type group; NO: No gRNA; ALL: All gRNA; KRAB: Krüppel associated box.
Figure 4
Figure 4
CRISPR‐dCas9‐KRAB induces sustained silencing of ZEB1 in vivo. Representative images of the resected dCas9‐KRAB‐edited tumors versus controls (Figure 3) by immunofluorescence for the detection of (A) dCas9 (green) and (B) ZEB1 (red). MDA‐MB‐231‐luc tumors either untransduced (Wild type) or transduced with dCas9‐KRAB in absence of gRNA (No gRNA), or expressing All gRNA were analyzed at day 32 post‐implantation of the cells. Hematoxylin & Eosin (H&E) staining of serial sections is indicated to illustrate cellularity. (C) Box and whisker plot highlighting the percent staining intensity of dCas9 and ZEB1 in tumors extract at day 32 relative to untransduced (Wild type). (D) Gene expression analyses by qRT‐PCR to assess the regulation of the pro‐epithelial miR‐200 family members in vivo, with tumors resected at day 32 post‐implantation. ns = non‐significant, *p ≤ 0.05, **p ≤ 0.01, ***p ≤ 0.001 and ****p ≤ 0.0001; miR: microRNA.
Figure 5
Figure 5
ZEB1 silencing by dCas9‐KRAB induces partial mesenchymal‐to‐epithelial transition. (A) Volcano plots showing changes in transcript abundance assessed by bulk RNA‐sequencing; statistical significance for differential expression of genes between the All gRNA treatment and No gRNA for MDA‐MB‐231 cells (at top) and SUM159 cells (at bottom). Genes annotated as epithelial or mesenchymal by Tan et al. (2014) are shown. (B) A heatmap showing changes in transcript abundance for genes with significant differential expression (adj. p‐value < n) between the All gRNA treatment and No gRNA for MDA‐MB‐231 cells or SUM159 cells (at left), together with associated Gene Ontology annotations, or Tan et al. (2014) classification as an epithelial or mesenchymal gene (at right). (C) A hexbin density plot showing the distribution of TCGA tumor samples when scored with epithelial or mesenchymal gene sets, overlaid with SUM159 and MDA‐MB‐231 RNA‐seq data from this study and CCLE breast cancer cell lines that have been annotated by their subtype classification. (D) Histograms showing the transcript abundance (logTPM) of selected genes (plot titles) within TCGA tumor samples with a relatively high mesenchymal score (<0.15) and low epithelial score (<0.1); corresponding to rare claudin‐low/metaplastic tumors (in red) and all other TCGA tumor samples (in gray). adj. p‐value: adjusted p‐value, log2FC: log 2 fold‐change, Log2(TPM): log2 of the transcript count per million. Her2+: human epidermal growth factor receptor 2 positive breast cancer, Basal: Basal‐like breast cancer, Luminal: Luminal breast cancers, TCGA: The Cancer Genome Atlas.
Figure 6
Figure 6
dCas9‐KRAB‐mediated silencing of ZEB1 reprograms the transcriptional and epigenetic state of mesenchymal breast cancer cells. (A) Significance (‐log10(FDR)) for the top biological terms obtained from Gene Ontology analysis using 87 638 differentially methylated probes mapping to 17 052 genes in SUM159. Bars are colored by the proportion of differentially methylated probes relative to the total number of probes associated with this gene set (DE/N). Several are enriched in cell–cell interaction and cell adhesion suggesting a role in MET. (B) Changes in transcript abundance (log2(fold change); logFC_RNA) and probe‐level changes in methylation (logFC_Meth) for 26 genes that show differential transcript abundance between the All gRNA treatment and No gRNA in SUM159 cells, which also have at least one differentially‐methylated probe. Genes are annotated with chromatin accessibility (ATAC‐seq) data and whether or not they are known EMT markers (at left), and are ordered based on RNA‐seq logFC. Probes scatter markers are colored by TSS (orange) or gene‐body (green) annotation. (C) Transcript abundance for selected genes within treated MDA‐MB‐231‐luc tumor samples (condition at bottom) as measured by qRT‐PCR, normalized relative to untransduced wild type tumor samples. (D) Native chromatin immunoprecipitation (ChIP) and assay of transposase accessible chromatin (ATAC) sequencing identifying epigenetic changes at the ZEB1 promoter of All gRNA and No gRNA SUM159 cells. (E) ChIP seq Counts per million (CPM) mapped reads significance in H3K4me3 and H3K9me3 at the ZEB1 promoter peak where ****p ≤ 0.0001. LogFC: log fold‐change, FC: fold‐change, WT: wild type untransduced sample, Epi: epithelial, Mes: mesenchymal, TSS: transcriptional start site, rep: replicate, H3K4me3: histone H3 trimethylation at fourth lysine residue, H3K9me3: histone H3 trimethylation at ninth lysine residue.
Figure 7
Figure 7
TCGA patient data show subtype‐dependent differences in DNAme at genes identified in our cell line models and a survival association with the relative expression of these genes. (A) Principal component plot using probes from the TCGA‐BRCA 450k DNAme data that were common with differentially methylated 850k probes identified between All gRNA and No gRNA SUM159 samples. Scatter markers are colored by PAM50‐defined subtype and the marginal distributions of PC1 and PC2 scores are shown for each subtype (kernel density plots at top and at right). (B) TCGA breast cancer tumors were scored according to the relative abundance of these genes and split into tumors with a high (top 25%), medium (25th – 7th percentile) or low (bottom 25%) score for generation of Kaplan–Meier (KM) survival curves. Significant differences in survival were assessed by a KM log‐rank test. TCGA‐BRCA: The Cancer Genome Atlas Breast Invasive Carcinoma, DNAme: DNA methylation, PC: principal component, Her2: human epidermal growth factor receptor 2 positive breast cancers, Basal: Basal‐like breast cancers, LumB: Luminal B breast cancers, LumA: Luminal A breast cancers.
Figure 8
Figure 8
Schematic model illustrating the effects of dCas9‐KRAB silencing ZEB1 in reprogramming epithelial plasticity. Following epigenetic silencing of ZEB1 by dCas9‐KRAB, TNBC cells acquire epithelial characteristics shifting with a resemblance to hybrid‐like states that might be present in human breast cancer. To fully drive the cells to a luminal lineage would require targeting of multiple factors, such as other EMT‐TFs, to overcome epigenetic barriers of mesenchymal cells. EMT: Epithelial to mesenchymal transition, MET: Mesenchymal to epithelial transition, KRAB: Krüppel associated box, DNAme: DNA methylation, H3K4me3: histone H3 trimethylation at fourth lysine residue, H3K9me3: histone H3 trimethylation at nineth lysine residue.

References

    1. Yang J., Antin P., Berx G., Blanpain C., Brabletz T., Bronner M., Campbell K., Cano A., Casanova J., Christofori G., Dedhar S., Derynck R., Ford H. L., Fuxe J., García De Herreros A., Goodall G. J., Hadjantonakis A.‐K., Huang R. Y. J., Kalcheim C., Kalluri R., Kang Y., Khew‐Goodall Y., Levine H., Liu J., Longmore G. D., Mani S. A., Massagué J., Mayor R., Mcclay D., Mostov K. E., et al., Nat. Rev. Mol. Cell Biol. 2020, 21, 341. - PMC - PubMed
    1. Greenburg G., Hay E. D., J. Cell Biol. 1982, 95, 333. - PMC - PubMed
    1. Chaffer C. L., Thompson E. W., Williams E. D., Cells Tissues Organs 2007, 185, 7. - PubMed
    1. Brabletz T., Hlubek F., Spaderna S., Schmalhofer O., Hiendlmeyer E., Jung A., Kirchner T., Cells Tissues Organs 2005, 179, 56. - PubMed
    1. Jolly M. K., Murphy R. J., Bhatia S., Whitfield H. J., Redfern A., Davis M. J., Thompson E. W., Cells Tissues Organs 2022, 211, 110. - PubMed

Publication types

MeSH terms

Substances