. 2023 May 22;20(1):119.
doi: 10.1186/s12974-023-02804-y.

The BET PROTAC inhibitor dBET6 protects against retinal degeneration and inhibits the cGAS-STING in response to light damage

Affiliations

The BET PROTAC inhibitor dBET6 protects against retinal degeneration and inhibits the cGAS-STING in response to light damage

Xingfei Zhu et al. J Neuroinflammation. .

Abstract

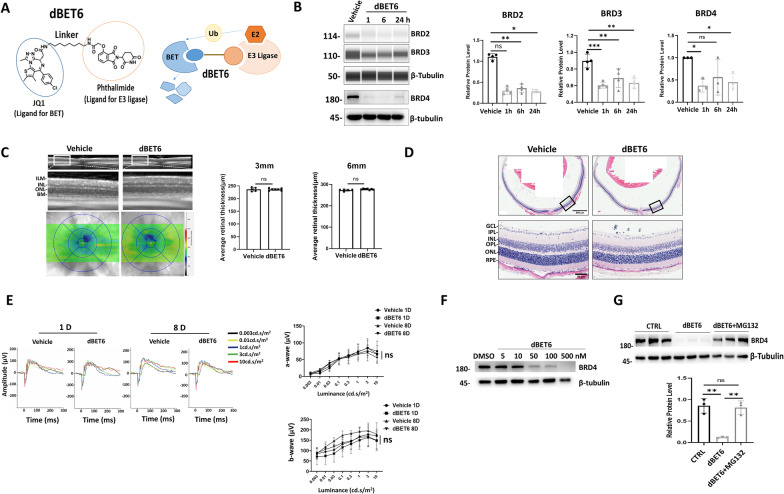
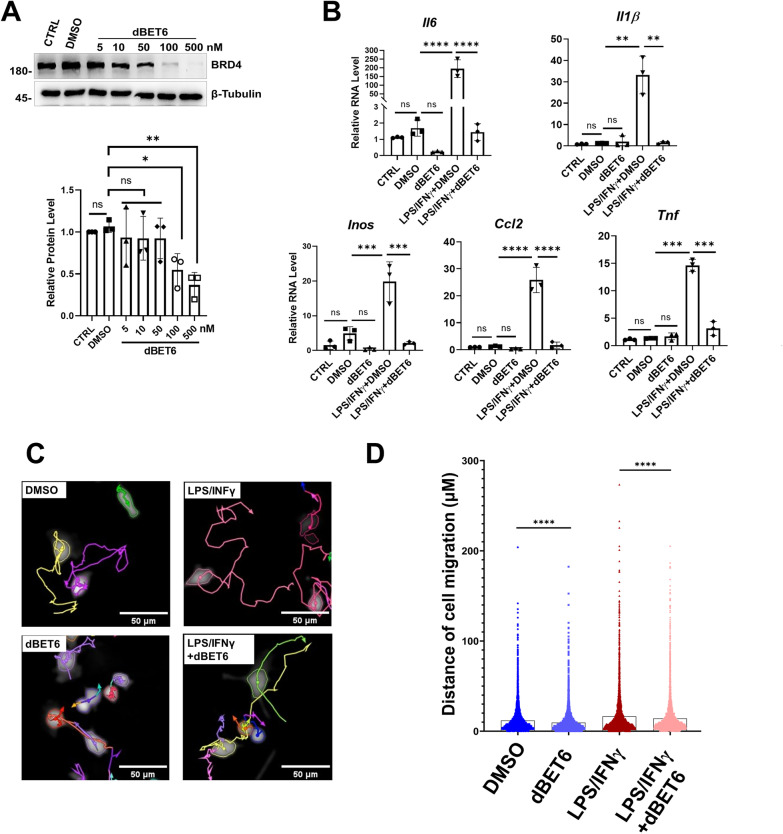
Background: Chronic inflammation significantly contributes to photoreceptor death in blinding retinal diseases such as age-related macular degeneration (AMD) and retinitis pigmentosa (RP). Bromodomain and extraterminal domain (BET) proteins are epigenetic readers that act as key proinflammatory factors. We recently found the first-generation BET inhibitor JQ1 alleviated sodium iodate-induced retinal degeneration by suppressing cGAS-STING innate immunity. Here, we investigated the effects and mechanism of dBET6, a proteolysis‑targeting chimera (PROTAC) small molecule that selectively degrades BET by the ubiquitin‒proteasome system, in light-induced retinal degeneration.

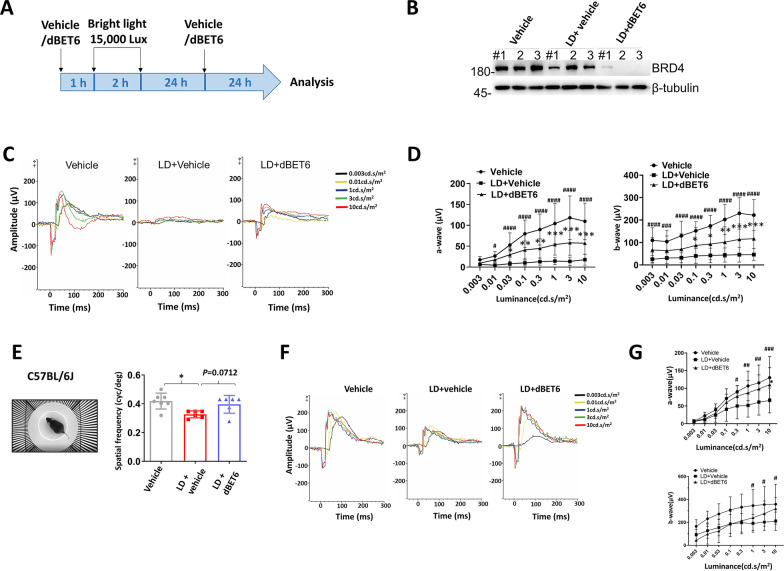
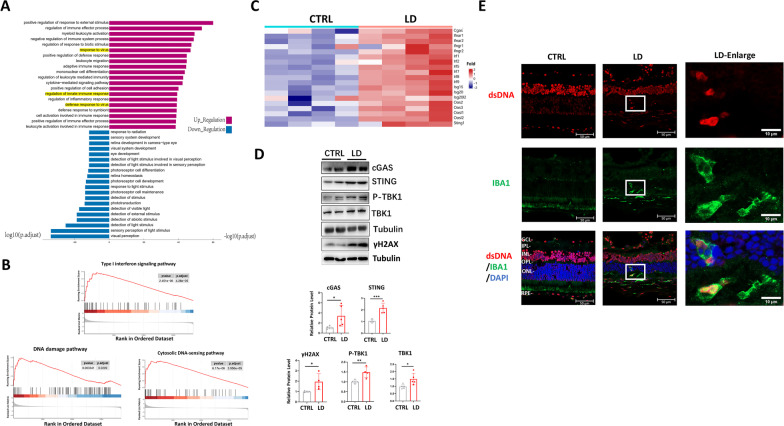
Methods: Mice were exposed to bright light to induce retinal degeneration, and the activation of cGAS-STING was determined by RNA-sequencing and molecular biology. Retinal function, morphology, photoreceptor viability and retinal inflammation were examined in the presence and absence of dBET6 treatment.

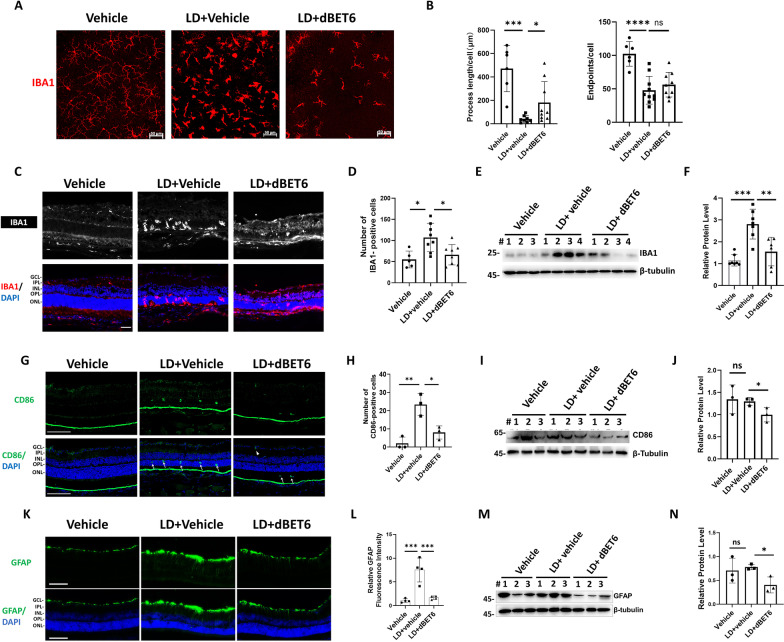
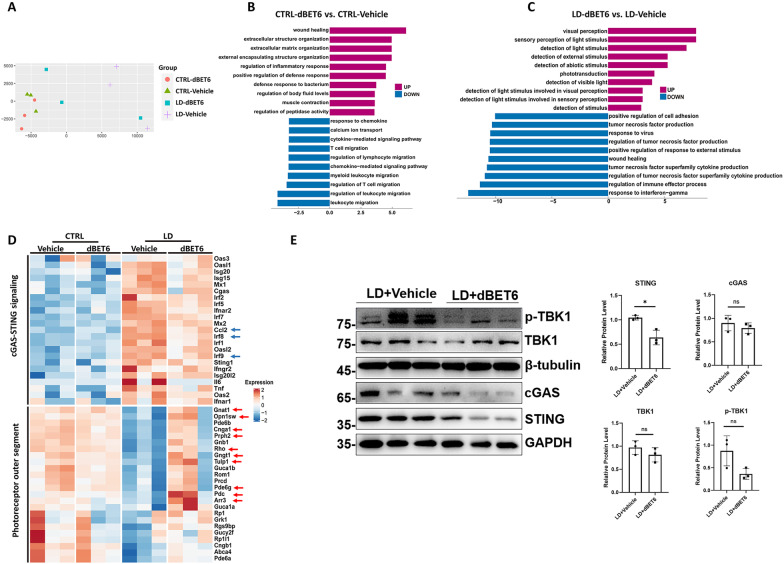
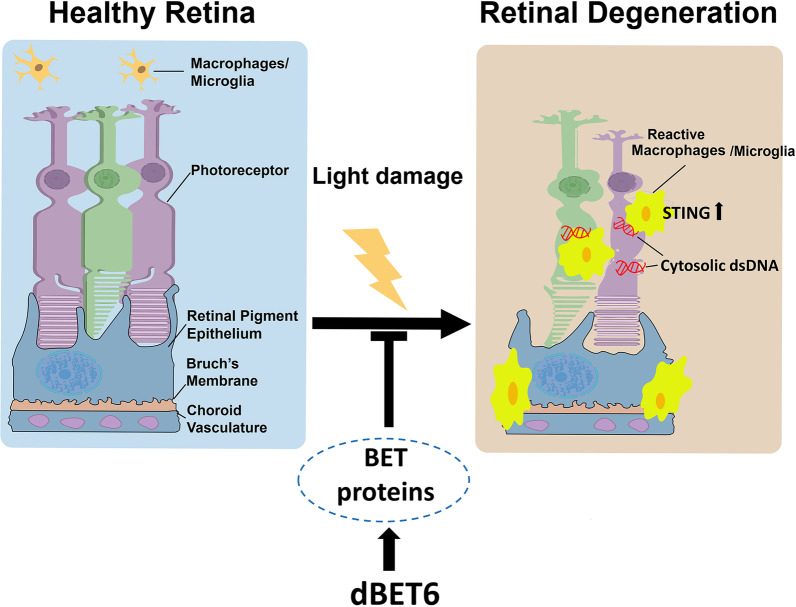
Results: Intraperitoneal injection of dBET6 led to the rapid degradation of BET protein in the retina without detectable toxicity. dBET6 improved retinal responsiveness and visual acuity after light damage (LD). dBET6 also repressed LD-induced retinal macrophages/microglia activation, Müller cell gliosis, photoreceptor death and retinal degeneration. Analysis of single-cell RNA-sequencing results revealed cGAS-STING components were expressed in retinal microglia. LD led to dramatic activation of the cGAS-STING pathway, whereas dBET6 suppressed LD-induced STING expression in reactive macrophages/microglia and the related inflammatory response.

Conclusions: This study indicates targeted degradation of BET by dBET6 exerts neuroprotective effects by inhibiting cGAS-STING in reactive retinal macrophages/microglia, and is expected to become a new strategy for treatment of retinal degeneration.

Keywords: BET; Microglia/macrophage; Neuroinflammation; PROTAC; Retinal degeneration; cGAS-STING.


Conflict of interest statement

The authors declare that they have no competing interests.

Figures

Fig. 1
Fig. 1
dBET6 degrades BET proteins in mouse retina and in 661W cells. A Diagrams show the chemical structure (left) and working model (right) of dBET6 to degrade BET proteins. B WES and WB analysis show degradation of BRD2, 3, and 4 in mouse retina after i.p. injection of dBET6 (10 mg/kg). Total retinal proteins were extracted at the indicated time points post-injection. WES did not give clear band for BRD4, thus traditional WB analysis was conducted for BRD4 detection. Right panels show quantification results. ns not significant; *p < 0.05; **p < 0.01; ***p < 0.0005, n = 3 eyes per group, One-way ANOVA, Tukey’s test. C, D Mice received two i.p. injections of dBET6 (10 mg/kg) with a 24 h interval. Analysis was conducted 8 days after the second injection. C In vivo OCT shows retina structure and heat map shows the retina thickness. The lower panels show average retinal thickness in the 3 mm and 6 mm circles. ns not significant, n = 5 mice for vehicle and n = 7 mice for dBET6 group, respectively. ILM internal limiting membrane, INL inner nuclear layer, ONL outer nuclear layer, BM Bruch’s membrane. D Representative HE staining shows retina morphology. Scale bar: 500 μm for the upper panels and 50 μm for the enlarged lower panels. n = 3 eyes per group. GCL ganglion cell layer, IPL inner plexiform layer, OPL outer plexiform layer, RPE retinal pigment epithelium. E Representative dark-adapted ERG recording. Mice received two injections of vehicle or dBET6 with a 24 h interval. Analysis was conducted 1 day (1D) or 8 days (8D) after the second injection. Right panels show luminance-response results for the a- and b-waves from mice of indicated treatment. n = 5 mice, 8–10 eyes per group, ns: not significant, Two-way ANOVA, Tukey’s test. F WB analysis show degradation of BRD4 by dBET6 treatment (2 h) in the photoreceptor-like cells 661W. G 661W cells were treated with DMSO or dBET6 (100 nM) for 2 h, or pretreated with MG132 (50 μM) for 2 h and then dBET6 (100 nM) was added for additional 2 h before collection for WB analysis. Right panel shows the quantification result of WB. ns not significant, **p < 0.01; n = 3 per group, one-way ANOVA, Tukey’s test
Fig. 2
Fig. 2
dBET6 inhibits LD-induced retinal function impairment. A Schematic illustration shows the experimental design. Mice were i.p. injected with dBET6 (10 mg/kg) at 1 h before and 24 h after 2-h light exposure. WB analysis (B) and visual tests (CG) were performed at 48 h post-LD. For mouse strain: BD, BALB/cJ; EG, C57BL/6J. B WB analysis shows degradation of BRD4 protein in mouse retinas with dBET6 treatment. C Representative dark-adapted ERG results. D Luminance-response results for the a- and b-waves. n = 8–10 mice, 16–20 eyes per group. ns not significant, # or *p < 0.05; ## or **p < 0.01; ### or ***p < 0.0005, ####: p < 0.0001 (#: Vehicle versus LD + Vehicle, *: LD + Vehicle versus LD + dBET6), two-way ANOVA, Tukey’s test. E Left: a captured image to illustrate the optomotor apparatus used in the study. The C57BL/6J mice were used in this study as described in the methods. Right: visual acuity measured as the spatial frequency threshold in mice of indicated treatment. *: p < 0.05, n = 6–7 mice per group, One-way ANOVA, Tukey’s test. F Representative dark-adapted ERG results performed on C57BL/6J mice. G Quantification results of a- and b-waves with indicated treatment on C57BL/6J mice. n = 4 mice, 6–8 eyes per group. # or *: p < 0.05; ##: p < 0.01; ###: p < 0.0005 (#: Vehicle versus LD + Vehicle, *: LD + Vehicle versus LD + dBET6), two-way ANOVA, Tukey’s test
Fig. 3
Fig. 3
Administration of dBET6 alleviates LD-induced retina degeneration. A In vivo OCT shows retinal thickness and lamination with indicated treatment. LD led to altered reflectance in the ONL, which was reversed by dBET6 treatment. Lower panel: heat maps show the average retinal thickness. Scale bar: 100 μm. B Quantification of retinal thickness in the 3 mm and 6 mm circles. *: p < 0.05, ***: p < 0.0005, ****: p < 0.0001, one-way ANOVA, Tukey’s test; n = 6 mice for vehicle, n = 5 mice for LD + vehicle or LD + dBET6. C HE staining shows retinal structure with indicated treatment. Scale bar: 100 μm. n = 3 eyes for each group. D TUNEL staining shows retinal cell death with indicated treatment. Upper panel: TUNEL signals were indicated by white fluorescence. Lower panel: overlapping images of TUNEL and DAPI (nuclei). Scale bar: 20 μm. E Quantification of TUNEL-positive retinal cells in ONL of indicated treatment. For each group, four regions were randomly selected and the percentage of TUNEL-positive cells were calculated over DAPI-positive cells within ONL. ****: p < 0.0001, n = 3 eyes for each group, One-way ANOVA, Tukey’s test
Fig. 4
Fig. 4
dBET6 inhibits LD-induced microglia activation and gliosis. A IF analysis shows morphology of IBA1-labeled microglia in retinal flat mounts. B Quantification results of mean microglia processes and endpoints. For each group, six to ten regions were randomly selected in the whole mounts, total length of the branches and the total number of endpoints in the region were measured by Image J and divided by the IBA1-positive cell number. ns not significant, *: p < 0.05, ***: p < 0.0005, ****: p < 0.0001, n = 3 eyes per group, One-way ANOVA, Tukey’s test. For vehicle treatment, ~ 50 cells were measured, for for LD + vehicle or LD + dBET6, 130–200 cells were measured. C IF analysis shows IBA1-positive cells in mouse retina with indicated treatment. The macrophages/microglia were immune labeled by anti-IBA1 antibody. Scale bar: 50 μm. D Quantification results of IBA1-positive cells. For each treatment, five to eight regions of the whole retinas were randomly selected and the IBA1-positive cells were counted. For vehicle treatment, n = 3 eyes; for LD + vehicle or LD + dBET6, n = 4 eyes per group, respectively. *: p < 0.05, One-way ANOVA, Tukey’s test. E Representative WB analysis shows IBA1 protein levels with indicated treatment. Total retinal proteins were extracted and subject to WB analysis. F Quantification of WB analysis. **p < 0.01; ***p < 0.0005, n = 6–8 eyes per group, One-way ANOVA, Tukey’s test. G. IF analysis shows active macrophages/microglia labeled by anti-CD86. Arrows show CD86-positive cells infiltrating photoreceptor after LD. Arrow heads show CD86-positive cells in the GCL after LD. Scale bar: 100 μm. H Quantification results of CD86-positive cells. Two to three regions were randomly selected in the whole retina and the CD86-positive cells were counted. *: p < 0.05, **: p < 0.01, n = 3 eyes per group, One-way ANOVA, Tukey’s test. I WB analysis shows CD86 protein levels with indicated treatment. Total retinal proteins were extracted and subject to WB analysis. J Quantification of WB analysis. ns not significant, *: p < 0.05, n = 3 eyes per group, One-way ANOVA, Tukey’s test. K IF analysis shows GFAP signal in mouse retina with indicated treatment. Scale bar: 100 μm. L Quantification of GFAP fluorescence intensity. Four regions were randomly selected in the whole retina and the GFAP fluorescence intensity were measured. ***: p < 0.0005, n = 3 eyes for each treatment group, One-way ANOVA, Tukey’s test. M WB analysis shows GFAP protein levels with indicated treatment. Total retinal proteins were extracted and subject to WB analysis. N Quantification of WB analysis. ns not significant, *: p < 0.05, n = 3 eyes for each treatment group, One-way ANOVA, Tukey’s test
Fig. 5
Fig. 5
dBET6 inhibits LPS-induced microglia activation and migration. A WB analysis shows the indicated protein expression. BV2 cells were treated without (CTRL) or with dBET6 at the indicated concentration for 2 h and then total proteins were extracted for WB analysis. The lower panel shows quantification result of WB. ns not significant, *: p < 0.05, One-way ANOVA, Tukey’s test, n = 3 per group. B qRT-PCR analysis shows the indicated gene expression. BV2 Cells were left untreated (CTRL) or treated with the indicated drugs for 24 h before analysis. For LPS/ IFNγ, combined LPS (10 ng/ml) and IFN-γ (20 ng/ml) were used. For dBET6 treatment, 100 nM dBET6 was used. ns not significant, **: p < 0.01, ***: p < 0.0005, ***: p < 0.0001. One-way ANOVA, Tukey’s test, n = 3 per group. C High-content image analysis was used to access BV2 motility with the indicated treatment. Cell mobility was recorded in live BV2 cells for 8 h. Each cell migration route was labeled. Drug concentrations were the same as described in B. D Quantification results of cell migration. For each group, at least 300 cells were recorded. ****: p < 0.0001. One-way ANOVA, Tukey’s test
Fig. 6
Fig. 6
LD led to activation of cGAS-STING innate immunity in mouse retina. AD Mice were expose with or without bright light and retinas were collected 48 h after exposure. Total RNAs or proteins were extracted and subjected to RNA-sequencing or WB analysis or IHC analysis, respectively. n = 4 for each group. A Gene Ontology (GO) analysis shows significant up- or down-regulated biological processes. Numbers indicate log10 and − log10 of the p. adjust. B Gene set enrichment analysis (GSEA) profiles demonstrate significant enrichment of gene sets associated with indicated pathway in light-exposed mouse retinas compared to control retinas. C Heat map shows increased cGAS-STING genes in LD group as compared with CTRL. p < 0.05. D WB analysis shows indicated protein level in mouse retinas. Right panels show the quantification results of the presented WB and a repeated WB not shown. *: p < 0.05, **: p < 0.01, ***: p < 0.001, n = 4 per group, unpaired t-test. E The DNA was labeled by anti-dsDNA antibody. Note that the cytosolic DNA seems to be engulfed by IBA1-positive microglia/macrophages in the ONL. Scale bar: 50 and 10 μm
Fig. 7
Fig. 7
dBET6 suppresses LD-induced retinal photoreceptor gene loss and inflammatory response. A Multi-dimensional scaling (MDS) plot shows variation among 12 retinal RNA-Seq samples, distance between sample labels indicates dissimilarity. B, C GO analysis shows significant up- or down-regulated biological processes in control (B) or LD (C) mice. Numbers indicate log10 and − log10 of the p. adjust. Fold change ≥ 1.5. D Heat map shows genes involved in cGAS-STING and photoreceptor outer segment in the indicated treatment groups. Arrows show genes with ≥ 1.5 fold change, p < 0.05. E WB analysis shows indicated protein level in mouse retinas. Right panels show quantification results of WB. ns not significant, *: p < 0.05, n = 3 eyes per group, unpaired t-test
Fig. 8
Fig. 8
dBET6 treatment inhibits STING expression in microglia/macrophages in response to LD. A, C Average expression of known microglia marker genes are used to identify the mouse (A) and human (C) retinal microglia cell cluster. Violin plots of genes previously reported to be enriched in microglia cell populations are plotted (cellmarker2.0, http://yikedaxue.slwshop.cn/). Mouse sc-RNA data are extracted from https://github.com/jiewwwang/Single-cell-retinal-regeneration, and human sc-RNA data can be accessed by GEO#: GSE137537. B, D Dot plot of cGAS-STING signaling genes and BRD4 in retinal microglia. E IHC shows indicated protein expression in mouse retina. Note STING-positive cells were localized to the GCL, IPL and INL in control mice. LD led to infiltration of IBA1-positive macrophages/microglia to the photoreceptors, and most of these infiltrating/reactive mononuclear phagocyte show STING staining (enlarged figure b). Administration of dBET6 reduced IBA1-positive cell in the photoreceptors and STING signal (enlarged figure c). Scale bar: 50 μm. D. IF analysis of retinal flat mounts. Note the evident overlapping of STING and IBA1 in both ramified (resting) and amoeboid-shaped (reactive) microglia/macrophages. Scale bar: 50 μm. E Quantification of STING IF intensity from the retinal flat mounts. For each group, six to ten regions were randomly selected in the whole mounts, the intensity of STING signal was measured by Image J. About 30 cells measured for Vehicle or LD + Vehicle, and ~ 60 cells measured for LD + dBET6. ****: p < 0.0001, One-way ANOVA, Tukey’s test, n = 3 retinas per group
Fig. 9
Fig. 9
Schematic model for dBET6 protection against LD-induced retinal degeneration. During LD, retinal macrophages/microglia were transited from resting state to activated from, migrating into photoreceptor layer. Cytosolic DNA was accumulated in photoreceptors and cGAS-STING signaling was activated in retina. Reactive macrophages/microglia were recruited to photoreceptors with DNA leakage, and macrophages/microglia there exhibited increased STING expression. Degradation of BET proteins inhibited LD-induced macrophages/microglia activation and STING expression

References

    1. Pfau M, von der Emde L, de Sisternes L, Hallak JA, Leng T, Schmitz-Valckenberg S, Holz FG, Fleckenstein M, Rubin DL. Progression of photoreceptor degeneration in geographic atrophy secondary to age-related macular degeneration. JAMA Ophthalmol. 2020;138:1026–1034. doi: 10.1001/jamaophthalmol.2020.2914. - DOI - PMC - PubMed
    1. Wright AF, Chakarova CF, Abd El-Aziz MM, Bhattacharya SS. Photoreceptor degeneration: genetic and mechanistic dissection of a complex trait. Nat Rev Genet. 2010;11:273–284. doi: 10.1038/nrg2717. - DOI - PubMed
    1. Zhao L, Zabel MK, Wang X, Ma W, Shah P, Fariss RN, Qian H, Parkhurst CN, Gan WB, Wong WT. Microglial phagocytosis of living photoreceptors contributes to inherited retinal degeneration. EMBO Mol Med. 2015;7:1179–1197. doi: 10.15252/emmm.201505298. - DOI - PMC - PubMed
    1. Hume DA, Perry VH, Gordon S. Immunohistochemical localization of a macrophage-specific antigen in developing mouse retina: phagocytosis of dying neurons and differentiation of microglial cells to form a regular array in the plexiform layers. J Cell Biol. 1983;97:253–257. doi: 10.1083/jcb.97.1.253. - DOI - PMC - PubMed
    1. Scholz R, Sobotka M, Caramoy A, Stempfl T, Moehle C, Langmann T. Minocycline counter-regulates pro-inflammatory microglia responses in the retina and protects from degeneration. J Neuroinflamm. 2015;12:209. doi: 10.1186/s12974-015-0431-4. - DOI - PMC - PubMed