Ranking mAb-excipient interactions in biologics formulations by NMR spectroscopy and computational approaches
- PMID: 37218059
- PMCID: PMC10208151
- DOI: 10.1080/19420862.2023.2212416
Ranking mAb-excipient interactions in biologics formulations by NMR spectroscopy and computational approaches
Abstract
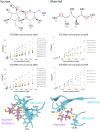
Excipients are added to biopharmaceutical formulations to enhance protein stability and enable the development of robust formulations with acceptable physicochemical properties, but the mechanism by which they confer stability is not fully understood. Here, we aimed to elucidate the mechanism through direct experimental evidence of the binding affinity of an excipient to a monoclonal antibody (mAb), using saturation transfer difference (STD) nuclear magnetic resonance (NMR) spectroscopic method. We ranked a series of excipients with respect to their dissociation constant (KD) and nonspecific binding constants (Ns). In parallel, molecular dynamic and site identification by ligand competitive saturation (SILCS)-Monte Carlo simulations were done to rank the excipient proximity to the proteins, thereby corroborating the ranking by STD NMR. Finally, the excipient ranking by NMR was correlated with mAb conformational and colloidal stability. Our approach can aid excipient selection in biologic formulations by providing insights into mAb-excipient affinities before conventional and time-consuming excipient screening studies are conducted.
Keywords: Excipient ranking; Monte carlo; STD NMR; mab stability; mab–excipient interaction; molecular dynamics.
Conflict of interest statement
No potential conflict of interest was reported by the authors.
Figures


Similar articles
-
Computational Characterization of Antibody-Excipient Interactions for Rational Excipient Selection Using the Site Identification by Ligand Competitive Saturation-Biologics Approach.Mol Pharm. 2020 Nov 2;17(11):4323-4333. doi: 10.1021/acs.molpharmaceut.0c00775. Epub 2020 Oct 6. Mol Pharm. 2020. PMID: 32965126 Free PMC article.
-
NMR spectroscopy as a characterization tool enabling biologics formulation development.J Pharm Biomed Anal. 2023 Jan 20;223:115110. doi: 10.1016/j.jpba.2022.115110. Epub 2022 Oct 14. J Pharm Biomed Anal. 2023. PMID: 36308923 Review.
-
Investigating the Interaction between Excipients and Monoclonal Antibodies PGT121 and N49P9.6-FR-LS: A Comprehensive Analysis.Mol Pharm. 2025 Apr 7;22(4):1831-1846. doi: 10.1021/acs.molpharmaceut.4c00973. Epub 2025 Mar 3. Mol Pharm. 2025. PMID: 40029670
-
Toward Biotherapeutics Formulation Composition Engineering using Site-Identification by Ligand Competitive Saturation (SILCS).J Pharm Sci. 2021 Mar;110(3):1103-1110. doi: 10.1016/j.xphs.2020.10.051. Epub 2020 Nov 1. J Pharm Sci. 2021. PMID: 33137372 Free PMC article.
-
An Evaluation of the Potential of NMR Spectroscopy and Computational Modelling Methods to Inform Biopharmaceutical Formulations.Pharmaceutics. 2018 Sep 21;10(4):165. doi: 10.3390/pharmaceutics10040165. Pharmaceutics. 2018. PMID: 30248922 Free PMC article. Review.
Cited by
-
Enhancing SILCS-MC via GPU Acceleration and Ligand Conformational Optimization with Genetic and Parallel Tempering Algorithms.J Phys Chem B. 2024 Aug 1;128(30):7362-7375. doi: 10.1021/acs.jpcb.4c03045. Epub 2024 Jul 20. J Phys Chem B. 2024. PMID: 39031121 Free PMC article.
References
MeSH terms
Substances
LinkOut - more resources
Full Text Sources
Research Materials
Miscellaneous
