. 2023 Sep 19;122(18):3678-3689.
doi: 10.1016/j.bpj.2023.05.014. Epub 2023 May 22.

Nonmuscle myosin 2 filaments are processive in cells

Affiliations

Nonmuscle myosin 2 filaments are processive in cells

Eric A Vitriol et al. Biophys J. .

Abstract

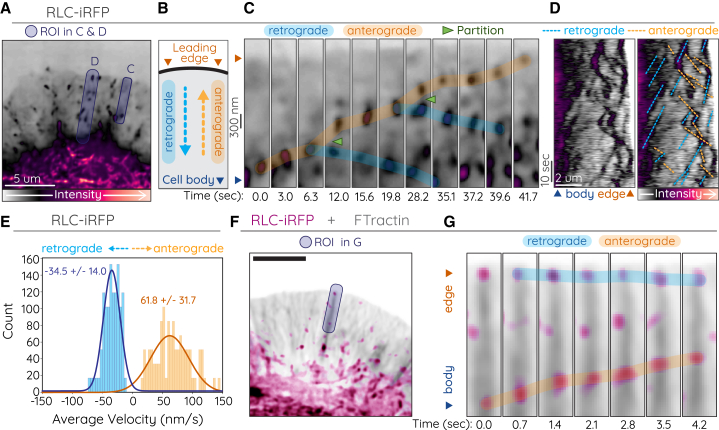
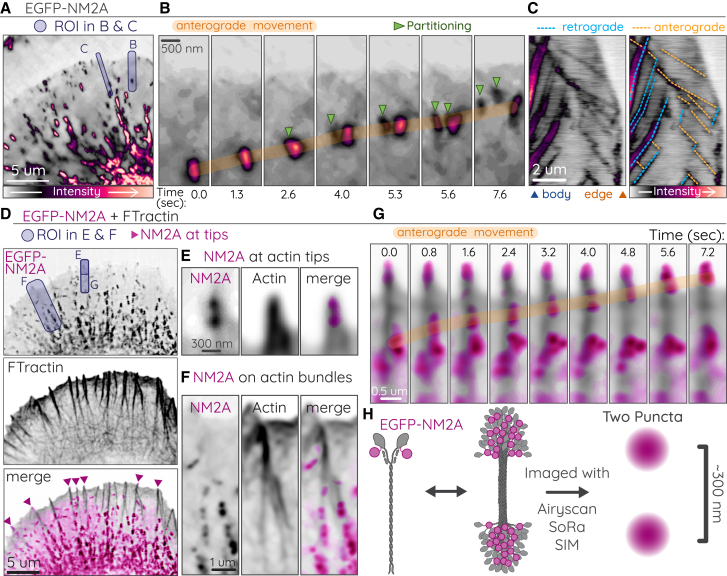
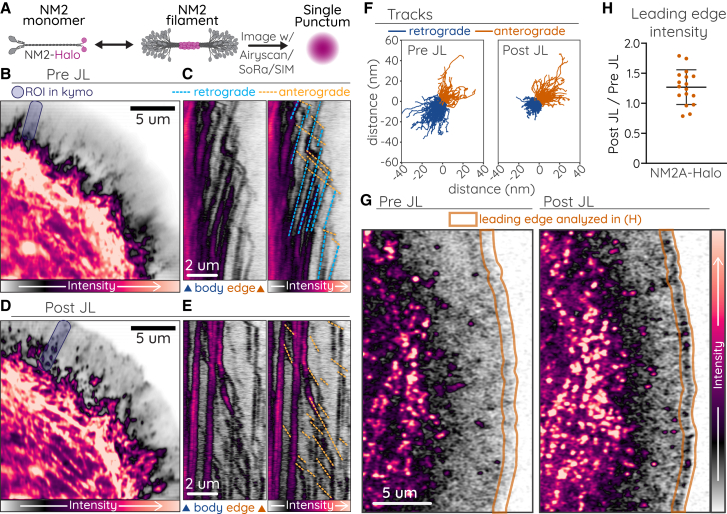
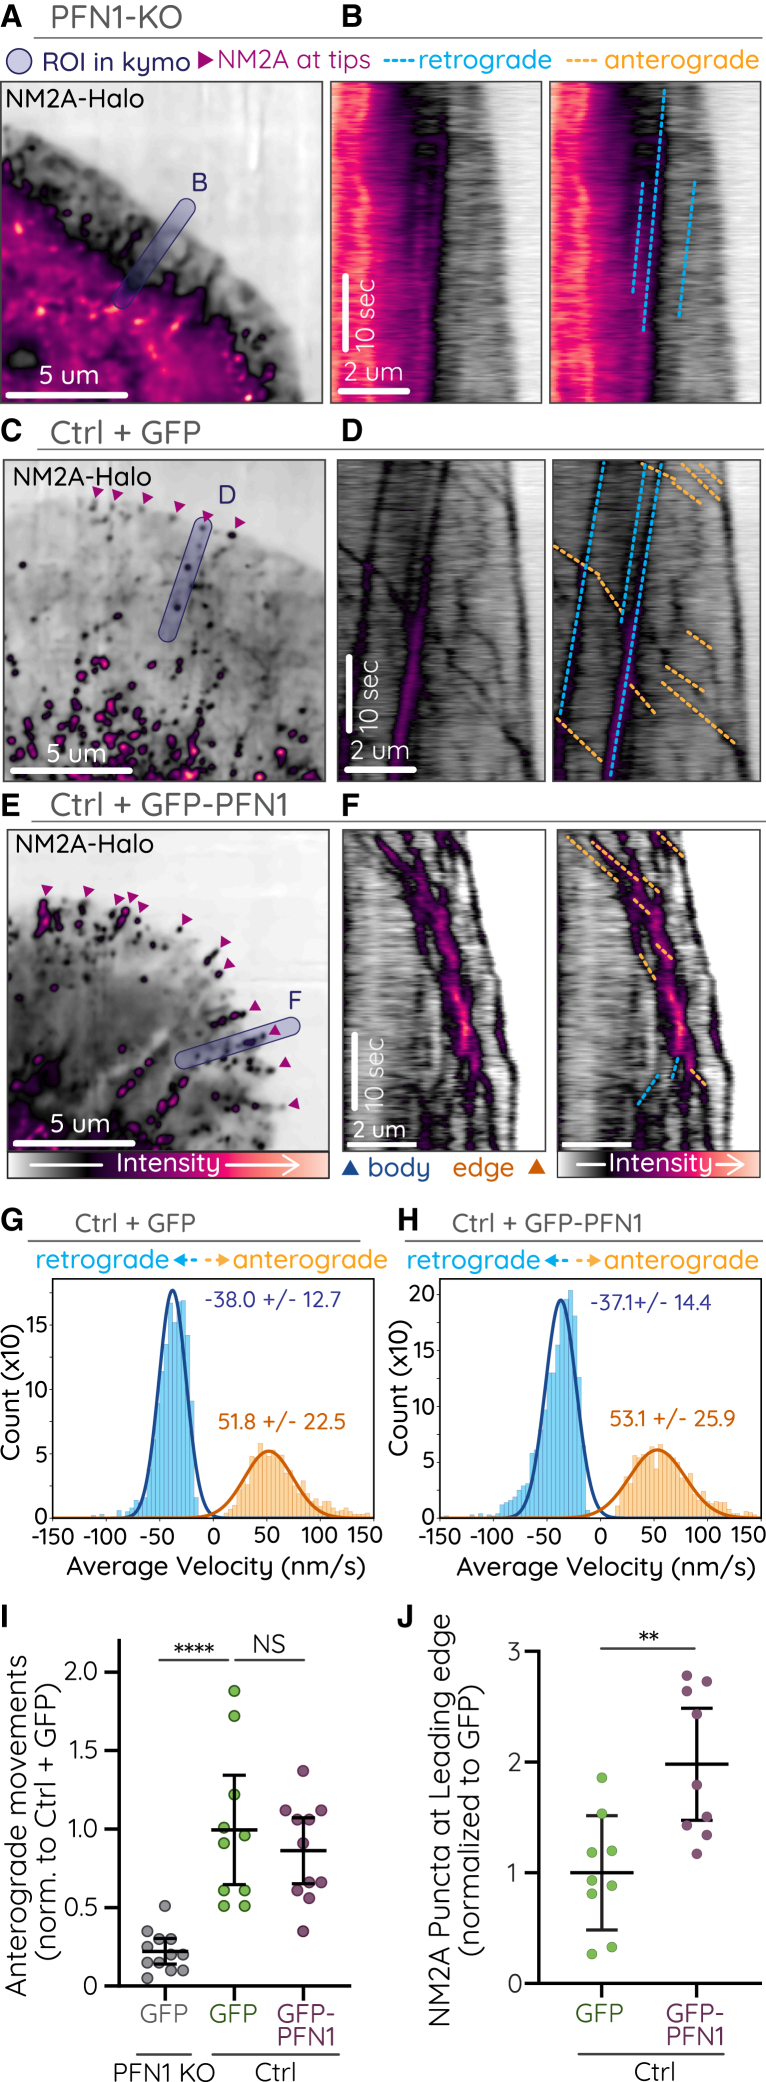
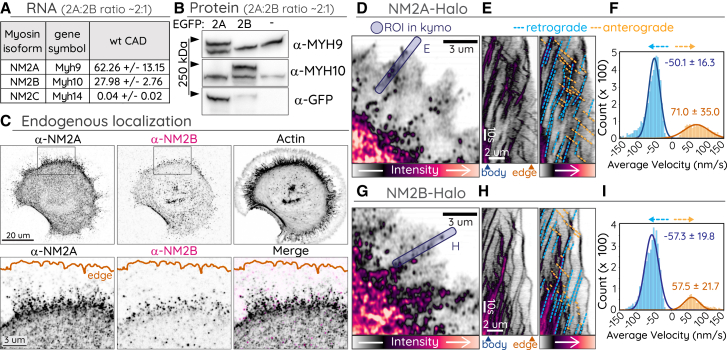
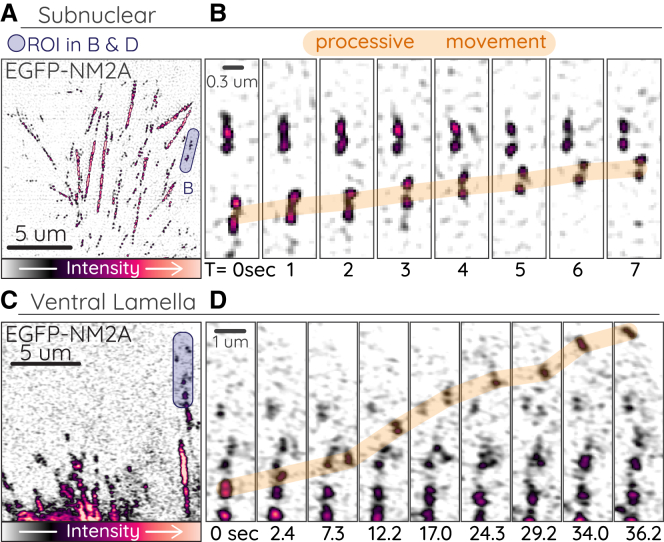
Directed transport of cellular components is often dependent on the processive movements of cytoskeletal motors. Myosin 2 motors predominantly engage actin filaments of opposing orientation to drive contractile events and are therefore not traditionally viewed as processive. However, recent in vitro experiments with purified nonmuscle myosin 2 (NM2) demonstrated myosin 2 filaments could move processively. Here, we establish processivity as a cellular property of NM2. Processive runs in central nervous system-derived CAD cells are most apparent on bundled actin in protrusions that terminate at the leading edge. We find that processive velocities in vivo are consistent with in vitro measurements. NM2 makes these processive runs in its filamentous form against lamellipodia retrograde flow, though anterograde movement can still occur in the absence of actin dynamics. Comparing the processivity of NM2 isoforms, we find that NM2A moves slightly faster than NM2B. Finally, we demonstrate that this is not a cell-specific property, as we observe processive-like movements of NM2 in the lamella and subnuclear stress fibers of fibroblasts. Collectively, these observations further broaden NM2 functionality and the biological processes in which the already ubiquitous motor can contribute.


Conflict of interest statement

Declaration of interests The authors declare no competing interests.

Figures

Figure 1
Figure 1
Processive-like anterograde movements by RLC (AE) CAD cell expressing RLC-iRFP. Purple translucent regions in (A) indicate ROI for (C) and (D). (A) corresponds to t = 0 s, and (C) corresponds to 0.0–41.7 s in Video S1. (B) Cartoon depicting location of cell body and leading edge and direction of retrograde (dotted blue arrow) and anterograde (dotted orange arrow) movements. (C) Time-lapse of anterograde (orange highlight) and retrograde (blue highlight) motion of RLC puncta. Partitioning filaments are indicated by green arrows. (D) Duplicate kymographs without (left) or with (right) retrograde and anterograde movements indicated. (E) Histograms of velocity measurements from automated tracking of RLC-iRFP retrograde and anterograde movements in protrusions (see Table 1). (F and G) CAD cell expressing RLC-iRFP (magenta) and FTractin-Neon (gray). (F) corresponds to t = 13.0 s, and (G) corresponds to 13.0–17.9 s of Video S3. Blue translucent ROI in (F) indicates region used for time-lapse in (G). (G) Selected time points demonstrating retrograde (blue highlight) and anterograde (orange highlight) motion along an actin bundle. Imaging was performed on Nikon CSU-W1 SoRa spinning disk.
Figure 2
Figure 2
Processive-like anterograde movements by filamentous NM2A (AC) A representative CAD cell expressing EGFP-NM2A. Purple shaded boxes indicate ROIs for (B) and (C). (A) corresponds to t = 0 s, and (B) corresponds to 1.6–9.2 s of Video S5. (B) Time-lapse of anterograde-moving NM2 filament (orange highlight) that partitions twice (green arrows). (C) Kymograph of EGFP-NM2A (left) with retrograde (blue dotted lines) and anterograde (orange dotted lines) movements indicated (right). Blue arrow and orange arrow below left kymograph indicate cell body and leading edge, respectively. (D) CAD cell expressing EGFP-NM2A (magenta) and FTractin-mScarlet (gray). Purple shaded boxes indicate ROIs for (E), (F), and (G). (D)–(F) correspond to t = 0 s, and (G) corresponds to 27.6–34.8 s in Video S6. (E) NM2A filament clearly localizing at a protrusive actin tip. (F) NM2A filaments accumulating along actin bundles. (G) Time-lapse anterograde movements of NM2A (orange highlight). (H) Cartoon of N-terminal EGFP tag on NM2A monomer, filament, and filament imaged with high-resolution microscopy. Imaging was performed on Nikon CSU-W1 SoRa spinning disk.
Figure 3
Figure 3
NM2 anterograde movements independent of actin dynamics (A) Cartoon of C-terminal HaloTag on an NM2 monomer, filament, and imaged with high-resolution microscopy. (B and D) CAD cell expressing NM2A-Halo imaged before (B) or after (D) treatment with jasplakinolide/latrunculin (JL) cocktail. Purple shaded boxes indicate ROIs for (C) and (E). (C and E) Kymographs shown without (left) and with (right) retrograde (blue dotted lines) and anterograde (orange dotted lines) movements indicated. (F) Rose plot of individual retrograde (blue) and anterograde (orange) tracks detected in a single cell before and after JL treatment. (G) Example lamellar regions of NM2A-Halo used for quantification of leading edge intensity (orange outline) in (H) before and 45 s after JL treatment. (H) Ratio of NM2A-Halo intensity within 1 μm of the leading edge before and 45 s after JL treatment. Imaging was performed on Zeiss 880 Aiscan.
Figure 4
Figure 4
Processive NM2 is dependent on lamellipodia architecture NM2A-Halo was imaged in PFN1-KO CAD cells, CAD cells expressing GFP, or CAD cells overexpressing GFP-PFN1. (A–F) Representative images (A, C, E) and duplicate kymographs (B, D, F) with (right) and without (left) annotation of anterograde (orange dotted lines) and retrograde (blue dotted lines) NM2A movements in PFN1 KO (A and B), ctrl + GFP (C and D) and ctrl + GFP-PFN1 (E and F) cells. (G and H) Histograms of velocity measurements from automated tracking of NM2A-Halo puncta in control and PFN1 overexpressing cells (see Table 1). (I) Plot of the number of NM2A-Halo anterograde movements in the lamellipodia protrusions of PFN1 KO, control, and PFN1 overexpressing cells. Only anterograde events that initiated within 8 μm of the leading edge were counted. Each dot indicates one cell. Error bars depict mean ± SD. p-values were calculated from a one-way ANOVA followed by Tukey's multiple comparisons post-hoc test. ∗∗∗∗, p <0.0001; NS, not significant. (J) Number of NM2A-Halo puncta within 1 μm of the leading edge of PFN1 KO, control, and PFN1 overexpressing cells. Each dot indicates one cell. Error bars depict mean ± SD. p-values were calculated from a student's t-test. ∗∗, p < 0.01. Imaging was performed on Nikon CSU-W1 SoRa spinning disk.
Figure 5
Figure 5
Differential expression, localization, and velocity of NM2 isoforms (A) Relative RNA expression of NM2A MHC genes. (B) Whole-cell lysates of untransfected CAD cells or cells overexpressing EGFP-NM2A or -NM2B were subject to Western blotting with the indicated antibody. The NM2A/NM2B ratio was calculated using anti-GFP blot as intermediate (see materials and methods). (C) CAD cells fixed and immunostained with indicated NM2 isoform-specific antibody and phalloidin (F-actin). Box in top row indicates ROI for insets in bottom row, which includes merge (rightmost panel). (DI) CAD cells expressing NM2A-Halo (D–F) or NM2B-Halo (G–I). Blue boxes indicate ROI for kymographs in (E) and (H). (E and H) Kymographs shown with (right) and without (left) retrograde (blue dotted lines) and anterograde (orange dotted lines) movements indicated. (F and I) Histograms of velocity measurements from automated tracking of NM2A-Halo and NM2B-Halo retrograde and anterograde movements in protrusions (see Table S1). Imaging was performed on Zeiss 880 Airyscan.
Figure 6
Figure 6
Processive EGFP-NM2A in fibroblasts (AD) Primary EGFP-NM2A MEF cells imaged with DeltaVision OMX SR TIRF-SIM (total internal reflection fluorescence structured-illumination microscopy) (subnuclear stress fibers; A and B) or Zeiss 880 Airyscan (ventral stress fibers; C and D). Purple boxes in (A) and (C) indicate ROI for time-lapses in (B) and (D), where processive movements are indicated with orange highlight. (A) corresponds to t = 19 s, and (B) corresponds to 19–26 s in Video S10. (C) corresponds to t = 298 s, and (D) corresponds to 298–334 s in Video S11.

Update of

References

    1. Svoboda K., Schmidt C.F., et al. Block S.M. Direct observation of kinesin stepping by optical trapping interferometry. Nature. 1993;365:721–727. - PubMed
    1. Svoboda K., Block S.M. Force and velocity measured for single kinesin molecules. Cell. 1994;77:773–784. - PubMed
    1. Vallee R.B., Wall J.S., et al. Shpetner H.S. Microtubule-associated protein 1C from brain is a two-headed cytosolic dynein. Nature. 1988;332:561–563. - PubMed
    1. Wang Z., Khan S., Sheetz M.P. Single cytoplasmic dynein molecule movements: characterization and comparison with kinesin. Biophys. J. 1995;69:2011–2023. - PMC - PubMed
    1. Mehta A.D., Rock R.S., et al. Cheney R.E. Myosin-V is a processive actin-based motor. Nature. 1999;400:590–593. - PubMed

Publication types

LinkOut - more resources