. 2023 Aug;10(22):e2300897.
doi: 10.1002/advs.202300897. Epub 2023 May 23.

Blockage of Osteopontin-Integrin β3 Signaling in Infrapatellar Fat Pad Attenuates Osteoarthritis in Mice

Affiliations

Blockage of Osteopontin-Integrin β3 Signaling in Infrapatellar Fat Pad Attenuates Osteoarthritis in Mice

Bingyang Dai et al. Adv Sci (Weinh). 2023 Aug.

Abstract

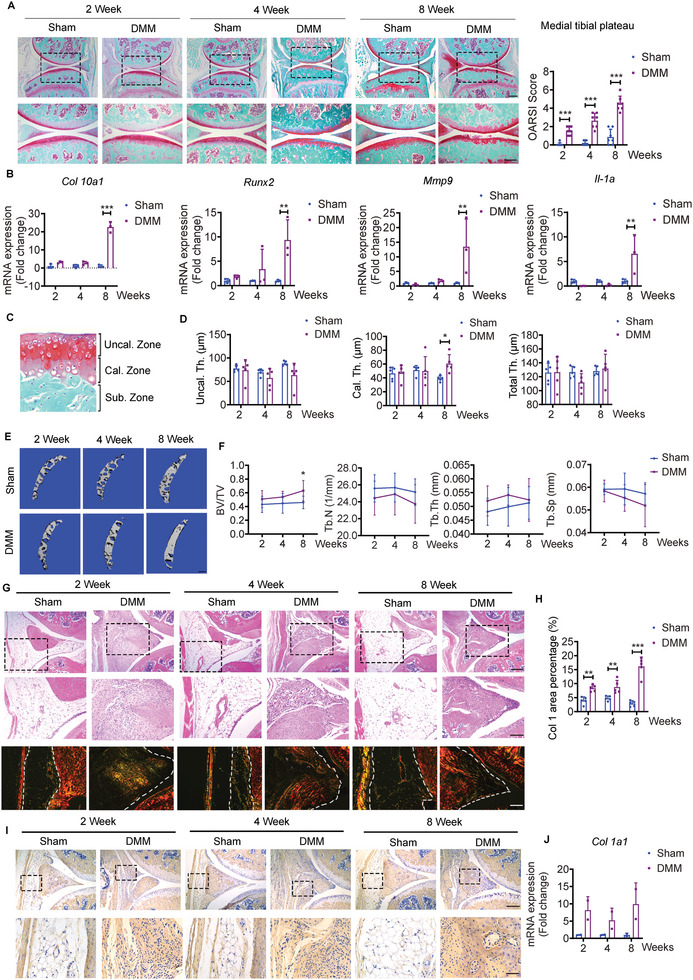
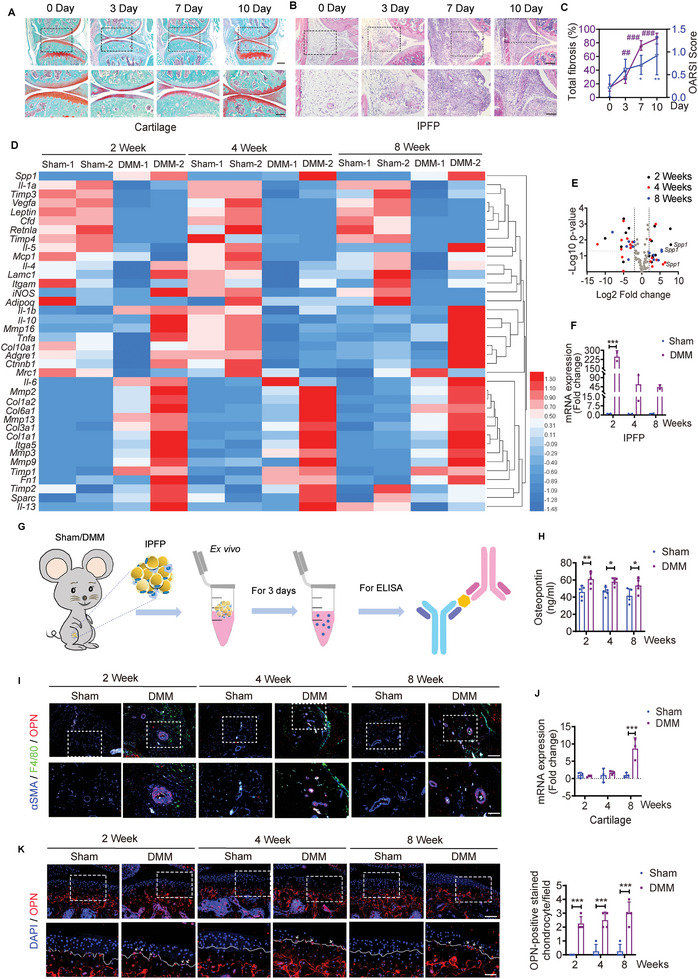
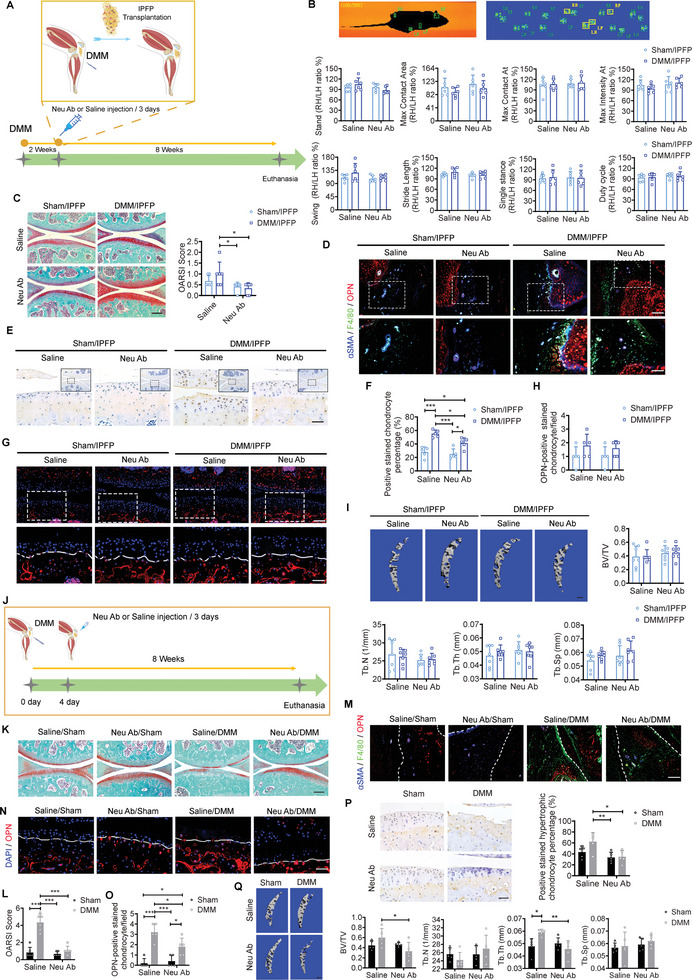
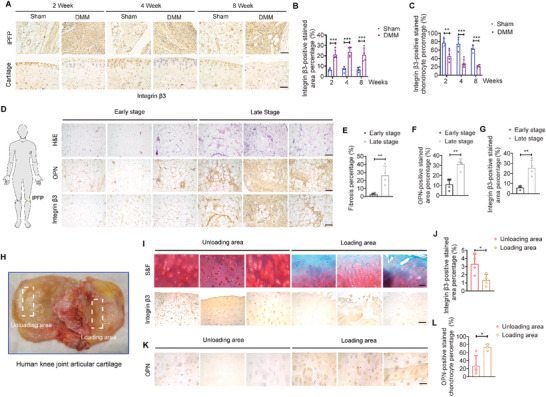
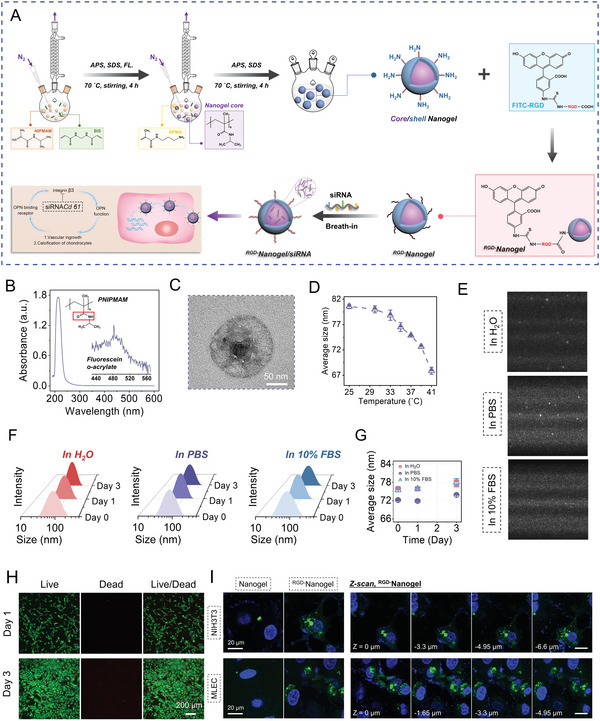
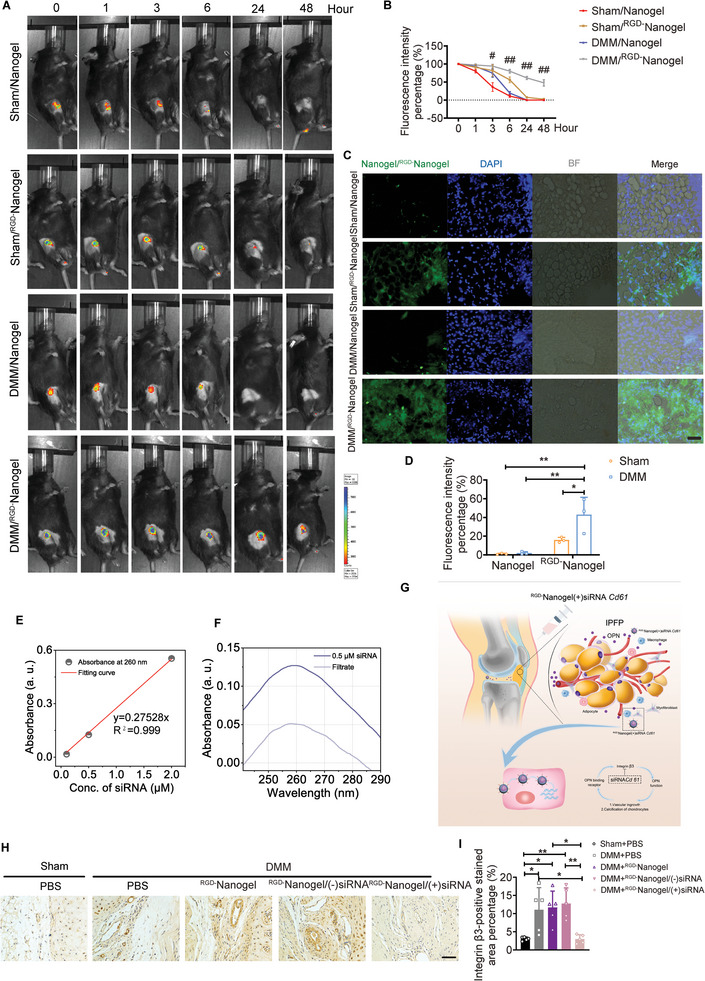
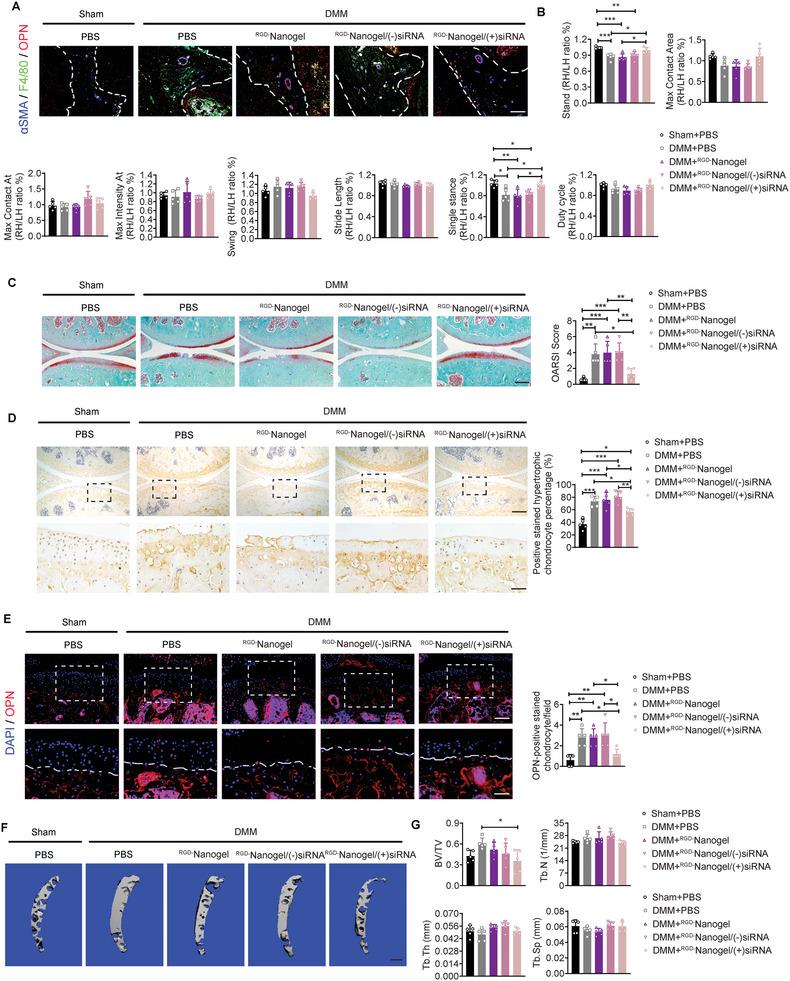
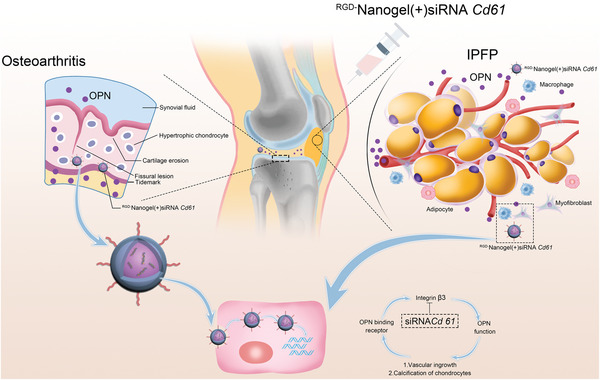
The knowledge of osteoarthritis (OA) has nowadays been extended from a focalized cartilage disorder to a multifactorial disease. Although recent investigations have reported that infrapatellar fat pad (IPFP) can trigger inflammation in the knee joint, the mechanisms behind the role of IPFP on knee OA progression remain to be defined. Here, dysregulated osteopontin (OPN) and integrin β3 signaling are found in the OA specimens of both human and mice. It is further demonstrated that IPFP-derived OPN participates in OA progression, including activated matrix metallopeptidase 9 in chondrocyte hypertrophy and integrin β3 in IPFP fibrosis. Motivated by these findings, an injectable nanogel is fabricated to provide sustained release of siRNA Cd61 (RGD- Nanogel/siRNA Cd61) that targets integrins. The RGD- Nanogel possesses excellent biocompatibility and desired targeting abilities both in vitro and in vivo. Local injection of RGD- Nanogel/siRNA Cd61 robustly alleviates the cartilage degeneration, suppresses the advancement of tidemark, and reduces the subchondral trabecular bone mass in OA mice. Taken together, this study provides an avenue for developing RGD- Nanogel/siRNA Cd61 therapy to mitigate OA progression via blocking OPN-integrin β3 signaling in IPFP.

Keywords: infrapatellar fat pad; integrin β3; nanogel; osteoarthritis; osteopontin; siRNA.


Conflict of interest statement

The authors declare no conflict of interest.

Figures

Figure 1
Figure 1
The pathological alterations of knee joint in osteoarthritis (OA) mice. A) Representative safranin O/fast green staining and quantifications of OA severity by OARSI scores of knee joint sections from sham and destabilization of the medial meniscus (DMM) mice at weeks 2, 4, and 8. Scale bar: 300 µm. The bottom row was magnified from the dotted frame in top row. n = 7 mice per group. Scale bar: 200 µm. B) Relative expression of Col10a1, Runx2, Mmp9, and Il‐1a in cartilage from sham and DMM mice at weeks 2, 4, and 8. n = 3 biologically independent samples per group, and each sample is assembled from four mice. C) Regions of interest (ROI) for uncalcified cartilage thickness (Uncal. Th.), calcified cartilage thickness (Cal. Th.), and total cartilage thickness (Total Th. = Uncal. Th. + Cal. Th.) in articular cartilage. D) Quantifications of average thicknesses of Uncal. Th., Cal. Th., and Total Th. from sham and DMM mice at weeks 2, 4, and 8. n = 5 mice per group. E) Representative µCT images and F) quantifications of subchondral trabecular bone from sham and DMM mice at weeks 2, 4, and 8. n = 7 mice per group. Scale bar: 200 µm. G,H) Representative H&E staining of IPFP (G) from sham and DMM mice at weeks 2, 4, and 8. Scale bar: 200 µm. The middle row (G) was magnified from the top row. Scale bar: 100 µm. Representative Picro‐Sirius red staining (G) and quantifications (H) of Col I area percentage of IPFP from sham and DMM mice at weeks 2, 4, and 8. n = 5 mice per group. Scale bar: 100 µm. I) Representative images of immunohistochemical staining of Col 1A1 in IPFP from sham and DMM mice at weeks 2, 4, and 8. Scale bar: 200 µm. The bottom row was magnified from the dotted frame in top row. Scale bar: 50 µm. J) Relative expression of Col 1a1 in infrapatellar fat pad (IPFP) for sham and DMM mice. n = 2 biologically independent samples per group and each sample is assembled from six mice. Images are representative of 3 independent experiments. BV/TV: Bone volume fraction; Tb.Th: trabecular bone thickness; Tb.Sp: trabecular bone separation; and Tb.N: trabecular bone number. All data are presented as mean ± SD. Two‐way ANOVA with Sidak's post hoc test (A, B, D, F, H, and J) were used. *p < 0.05, **p < 0.01, and ***p < 0.001.
Figure 2
Figure 2
The expression levels of osteopontin (OPN) in cartilage and IPFP. A) Representative safranin O/fast green staining of knee joint sections from sham and DMM mice at days 0, 3, 7, and 10. Scale bar: 300 µm. The bottom row was magnified from the dotted frame in top row. Scale bar: 200 µm. B) Representative H&E staining of inflamed IPFP of knee joint sections from sham and DMM mice at days 0, 3, 7, and 10. Scale bar: 200 µm. The bottom row was magnified from the dotted frame in top row. Scale bar: 100 µm. C) Quantifications of OA severity by OARSI scores for articular cartilage and fibrosis scores for IPFP from sham and DMM mice at days 0, 3, 7, and 10. n = 5 mice per group. D) Heatmap summarizing the normalized fold changes in mRNA expression of different biomarkers in IPFP from sham and DMM mice at weeks 2, 4, and 8. n = 2 biologically independent samples per group, and each sample is assembled from six mice. E) Volcano plots of transcripts differentially expressed from IPFP (D) between sham and DMM mice. F) Relative expression of Spp1 in IPFP from sham and DMM mice at weeks 2, 4, and 8. n = 2 biologically independent samples per group, and each sample is assembled from six mice. G) Schematic diagram illustrating the ELISA measuring concentrations of OPN in conditioned medium with isolated IPFP from sham or DMM mice. H) Free osteopontin (OPN) levels in the conditioned medium of isolated IPFP from sham or DMM mice at weeks 2, 4, and 8 post‐DMM or ‐sham surgery. n = 5 mice per group. I) Representative images of immunofluorescence staining of OPN, F4/80, and alpha‐smooth muscle actin (αSMA) in IPFP from sham and DMM mice at weeks 2, 4, and 8. Scale bar: 100 µm. The bottom row was magnified from the dotted frame in top row. Scale bar: 50 µm. J) Relative expression of Spp1 in articular cartilage from sham and DMM mice at weeks 2, 4, and 8. n = 3 biologically independent samples per group, and each sample is assembled from four mice. K) Representative images and quantifications of immunofluorescence staining of OPN in articular cartilage from sham and DMM mice at weeks 2, 4, and 8. Scale bar: 100 µm. The bottom row was magnified from the dotted frame in the top row. n = 4 mice per group. Scale bar: 50 µm. Images are representative of 3 independent experiments. All data are presented as mean ± SD. One‐way ANOVA with Dunnett's post hoc test (C) and two‐way ANOVA with Sidak's post hoc test (F, H, J, and K) were used. *p < 0.05, **p < 0.01, and ***p < 0.001.
Figure 3
Figure 3
The role of IPFP‐derived OPN in OA progression. A) Schematic diagram illustrating the IPFP transplantation and treatment for the acceptor mice after IPFP transplantation. B) Images display pawprints of the left forelimb (LF), left hind limb (LH), right forelimb (RF), and right hind limb (RH) of a running mouse by automated gait analysis (Catwalk). Representative catwalk gait analysis among groups at week 8 post‐transplantation. n = 6 mice per group. C) Representative safranin O/fast green staining and quantification of OA severity by OARSI scores of medial tibial plateau among groups at week 8 post‐transplantation. n = 6 mice per group. Scale bar: 200 µm. D) Representative images of immunofluorescence staining of OPN, F4/80, and αSMA in IPFP among groups at week 8 post‐transplantation. Scale bar: 100 µm. The bottom row was magnified from the dotted frame in top row. Scale bar: 50 µm. E,F) Representative images (E) and quantification (F) of immunohistochemical staining of MMP9 in articular cartilage among groups at week 8 post‐transplantation. Scale bar: 50 µm. The image was magnified from the dotted frame part. n = 5 mice per group. Scale bar: 50 µm. G,H) Representative images (G) and quantification (H) of immunofluorescence staining of OPN in articular cartilage among groups at week 8 post‐transplantation. Scale bar: 100 µm. The bottom row was magnified from the dotted frame in top row. n = 5 mice per group. Scale bar: 50 µm. I) Representative µCT images and quantifications of subchondral trabecular bone among groups at week 8 post‐transplantation. n = 7 mice per group. Scale bar: 200 µm. J) Schematic diagram illustrating the saline or Neu Ab treatment for the sham or DMM mice without IPFP transplantation. K,L) Representative safranin O/fast green staining (K) and quantification (L) of OA severity by OARSI scores among groups at week 8 post‐surgery and injection. n = 6 mice per group. Scale bar: 200 µm. M) Representative images of immunofluorescence staining of OPN, F4/80, and αSMA in IPFP among groups at week 8 post‐surgery and injection. Scale bar: 100 µm. N,O) Representative images and quantification of immunofluorescence staining of OPN in articular cartilage among groups at week 8 post‐surgery and injection. n = 5 mice per group. Scale bar: 50 µm. P) Representative images and quantification of immunohistochemical staining of MMP9 in articular cartilage among groups at week 8 post‐surgery and injection. n = 5 mice per group. Scale bar: 50 µm. Q) Representative µCT images and quantifications of subchondral trabecular bone among groups at week 8 post‐surgery and injection. n = 5 mice per group. Scale bar: 200 µm. Images are representative of 3 independent experiments. All data are presented as mean ± SD. Neu Ab: OPN‐neutralizing antibody. Two‐way ANOVA with Tukey's post hoc test (B, C, F, H, I, L, O, P, and Q) were used. *p < 0.05, **p < 0.01, and ***p < 0.001. Parts of Figure 3A and 3J are created with BioRender.com.
Figure 4
Figure 4
Dysregulated OPN and integrin β3 signaling in patients and mice. A–C) Representative images (A) and quantifications (B and C) of immunohistochemical staining of integrin β3 in IPFP (top row) and articular cartilage (bottom row) from sham and DMM mice at weeks 2, 4, and 8. n = 4 mice per group. Scale bar: 50 µm. D) Representative images of H&E staining and immunohistochemical staining of OPN (middle row) and integrin β3 (bottom row) in IPFP from ACLR patients at early‐stage (1‐2 months of injury period) and late‐stage (5‐6 months of injury period). Scale bar: 100 µm. E–G) Quantifications of H&E staining (E) and immunohistochemical staining of OPN (F) and integrin β3 (G) from (D). n = 4 patients per group. H) Human knee joint articular cartilages were obtained from total knee replacement of OA patients. White dashed boxes indicate respective loading and unloading areas. I) Representative safranin O/fast green (S&F) staining and immunohistochemical staining of integrin β3 in cartilage from TKA patients. Scale bar: 100 µm. J) Quantification of integrin β3‐positive stained area from (I). n = 4 patients per group. K,L) Representative images (K) and quantification (L) of immunohistochemical staining of OPN in deep cartilage from TKA patients. n = 4 patients per group. Scale bar: 100 µm. Images are representative of 3 independent experiments. All data are presented as mean ± SD. Two‐way ANOVA with Sidak's post hoc test (B and C) and two‐tailed Welch's t‐test (E, F, G, J, and L) were used. *p < 0.05, **p < 0.01, and ***p < 0.001.
Figure 5
Figure 5
Synthesis and properties of RGD−Nanogel/siRNA Cd61. A) Illustration of RGD−Nanogel/siRNA Cd61 synthesis and function. APS: ammonium persulfate; SDS: sodium dodecyl sulfate; FL.: fluorescein O‐acrylate. B) UV–vis spectrum of the synthesized PNIPMAM nanogel. C) The representative images of the core/shell nanogel particle by transmission electron microscopy (TEM). D) The analysis of average size of nanogel in deionized water (D. I. H2O) under different temperatures by dynamic light scattering (DLS). n = 3 per group. E) The video frames of nanogel particles in D. I. H2O, PBS, and 10% fetal bovine serum (FBS) at 37 ˚C, obtained from nanoparticle tracking analysis (NTA) measurement. F) Representative curves of the size distribution of the nanogel particles in D. I. H2O, PBS, and 10% FBS at 37 ˚C from day 0 to day 3. G) Evolution of the average size of the nanogel particles in different aqueous environments from day 0 to day 3, obtained from DLS measurements. n = 3 per group. H) Representative live/dead cell staining images. I) Fluorescent confocal images of 3T3 fibroblasts (NIH3T3) and murine lung endothelial cells (MLEC) incubated with nanogel or RGD−nanogel particles for 6 hours, where the nanogel or RGD−nanogel particles utilized did not contain siRNA Cd61. The cell nuclei were stained with DAPI. Confocal microscopy Z‐scan was further performed on the cells incubated with RGD−nanogel particles from the top to bottom of cells with a step size of 0.33 µm. Images are representative of 3 independent experiments.
Figure 6
Figure 6
The IPFP‐targeting efficiency of RGD−Nanogel and transfection efficiency of RGD−Nanogel/siRNA Cd61 in vivo. A) The IPFP‐targeting efficiency of Nanogel or RGD−Nanogel was visualized by IVIS system at 0‐, 1‐, 3‐, 6‐, 24‐, and 48‐hours post‐injection. B) The value was calculated by the quantified fluorescence intensity relative to the initial fluorescence intensity. #, p < 0.05 between DMM/Nanogel group and DMM/RGD−Nanogel group. ##, p < 0.0001 between DMM/Nanogel group and DMM/RGD−Nanogel group. n = 3 mice per group. C) The IPFP‐targeting efficiency of Nanogel or RGD−Nanogel was evaluated by IPFP cryosection on day 2 post‐injection. Scale bar: 50 µm. D) Quantifications of fluorescence intensity of Nanogel or RGD−Nanogel in IPFP cryosection from (C). n = 3 mice per group. E) Standard curve of the absorbance (at 260 nm) versus siRNA concentration. F) UV–vis spectra of the siRNA loading solution and the filtrate of siRNA‐loaded nanogel suspension. G) RGD−Nanogel/siRNA Cd61 was weekly intra‐IPFP injected for investigation of its pharmacodynamics in OA mice. H,I) Representative images (H) and quantification (I) of immunohistochemical staining of integrin β3 in IPFP among groups at week 8 post‐surgery. n = 5 mice per group. Scale bar: 50 µm. Images are representative of 3 independent experiments. All data are presented as mean ± SD. Two‐way ANOVA with Sidak's post hoc test (B), two‐way ANOVA with Tukey's post hoc test (D), and one‐way ANOVA with Tukey's post hoc test (I) were used. *p < 0.05 and **p < 0.01.
Figure 7
Figure 7
Intra‐IPFP injection of RGD−Nanogel/siRNA Cd61 to mitigate the OA progression. A) Representative images of immunofluorescence staining of OPN, F4/80, and αSMA in IPFP among groups at week 8 post‐surgery and injection. Scale bar: 100 µm. B) Representative catwalk gait analysis among groups at week 8 post‐surgery and injection. n = 5 mice per group. C) Representative safranin O/fast green staining and quantification of OA severity by OARSI scores of knee joint sections among groups at week 8 post‐surgery and injection. n = 5 mice per group. Scale bar: 200 µm. D) Representative images and quantification of immunohistochemical staining of MMP9 in articular cartilage among groups at week 8 post‐surgery and injection. Scale bar: 200 µm. The bottom row was magnified from the dotted frame in top row. n = 5 mice per group. Scale bar: 50 µm. E) Representative images and quantification of immunofluorescence staining of OPN in articular cartilage among groups at week 8 post‐surgery and injection. Scale bar: 100 µm. The bottom row was magnified from the dotted frame in top row. n = 5 mice per group. Scale bar: 50 µm. F,G) Representative µCT images (F) and quantifications (G) of subchondral trabecular bone among groups at week 8 post‐surgery and injection. n = 5 mice per group. Scale bar: 200 µm. Images are representative of 3 independent experiments. All data are presented as mean ± SD. One‐way ANOVA with Tukey's post hoc test (B, C, D, E, and G) were used. *p < 0.05, **p < 0.01, and ***p < 0.001.
Figure 8
Figure 8
Schematic diagram of siRNA‐releasing nanogel for OA treatment by disrupting the signaling of infrapatellar fat pad‐derived OPN.

Similar articles

Cited by

References

    1. Martel‐Pelletier J., Barr A. J., Cicuttini F. M., Conaghan P. G., Cooper C., Goldring M. B., Goldring S. R., Jones G., Teichtahl A. J., Pelletier J.‐P., Nat. Rev. Dis. Primers 2016, 2, 16072. - PubMed
    1. van denBerg W. B., Osteoarthritis Cartilage 1999, 7, 333. - PubMed
    1. Atukorala I., Kwoh C. K., Guermazi A., Roemer F. W., Boudreau R. M., Hannon M. J., Hunter D. J., Ann. Rheum. Dis. 2016, 75, 390. - PMC - PubMed
    1. Cui Z., Crane J., Xie H., Jin X., Zhen G., Li C., Xie L., Wang L., Bian Q., Qiu T., Wan M., Xie M., Ding S., Yu B., Cao Xu, Ann. Rheum. Dis. 2016, 75, 1714. - PMC - PubMed
    1. Ruhdorfer A., Wirth W., Eckstein F., Arthritis Rheumatol 2016, 68, 826. - PubMed

Publication types

LinkOut - more resources