

Mutant Isocitrate Dehydrogenase 1 Expression Enhances Response of Gliomas to the Histone Deacetylase Inhibitor Belinostat
- PMID: 37218937
- PMCID: PMC10204413
- DOI: 10.3390/tomography9030077
Mutant Isocitrate Dehydrogenase 1 Expression Enhances Response of Gliomas to the Histone Deacetylase Inhibitor Belinostat
Abstract
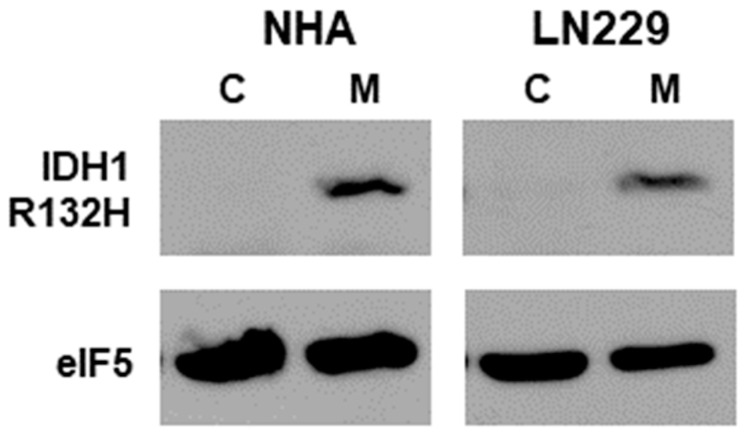
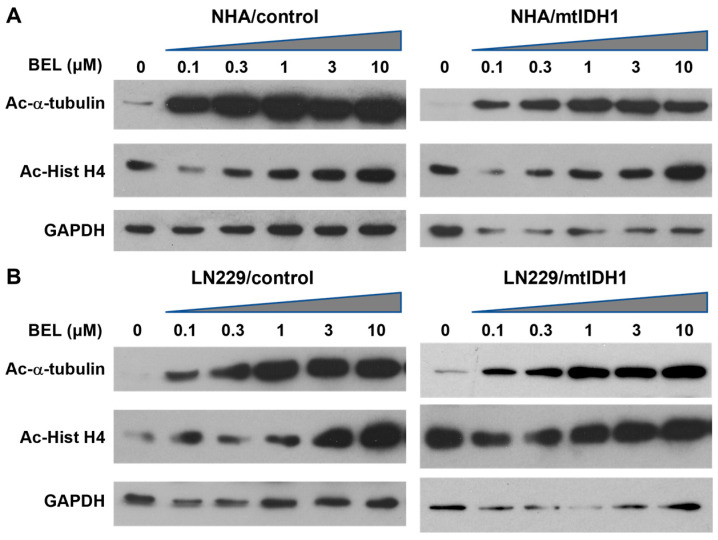
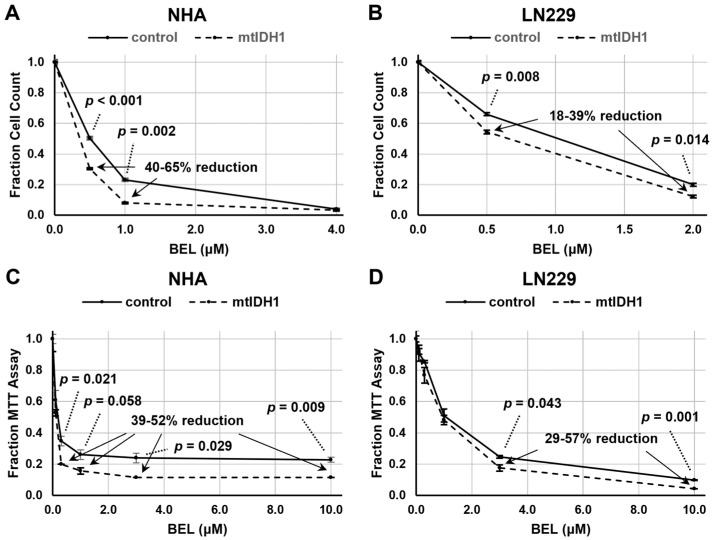
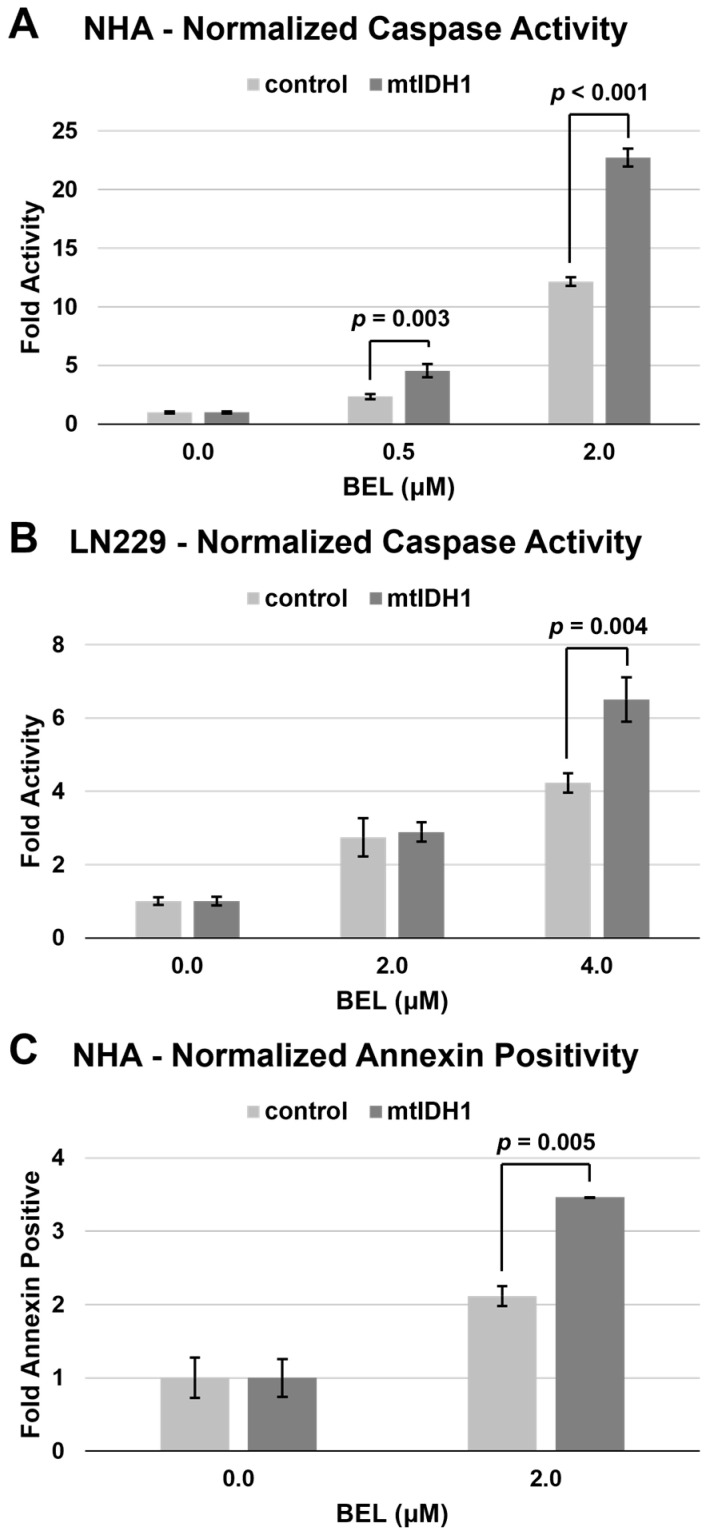
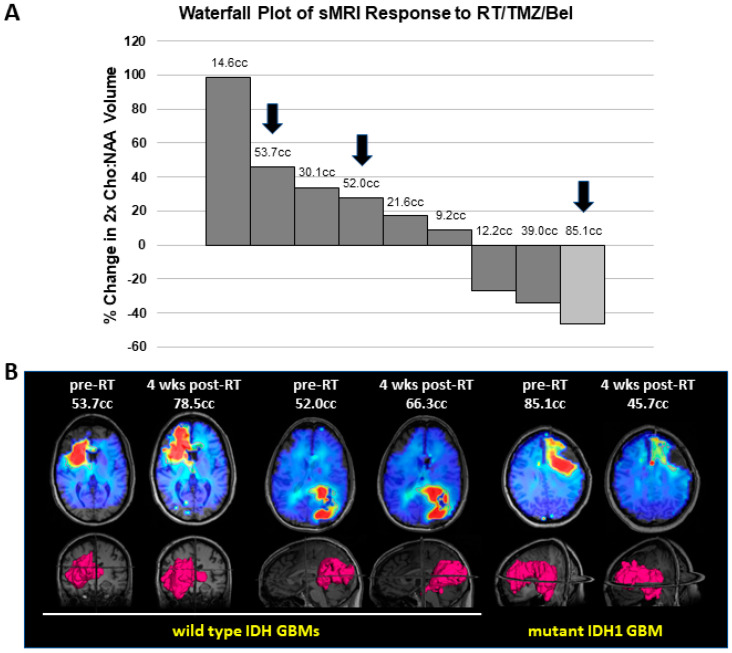
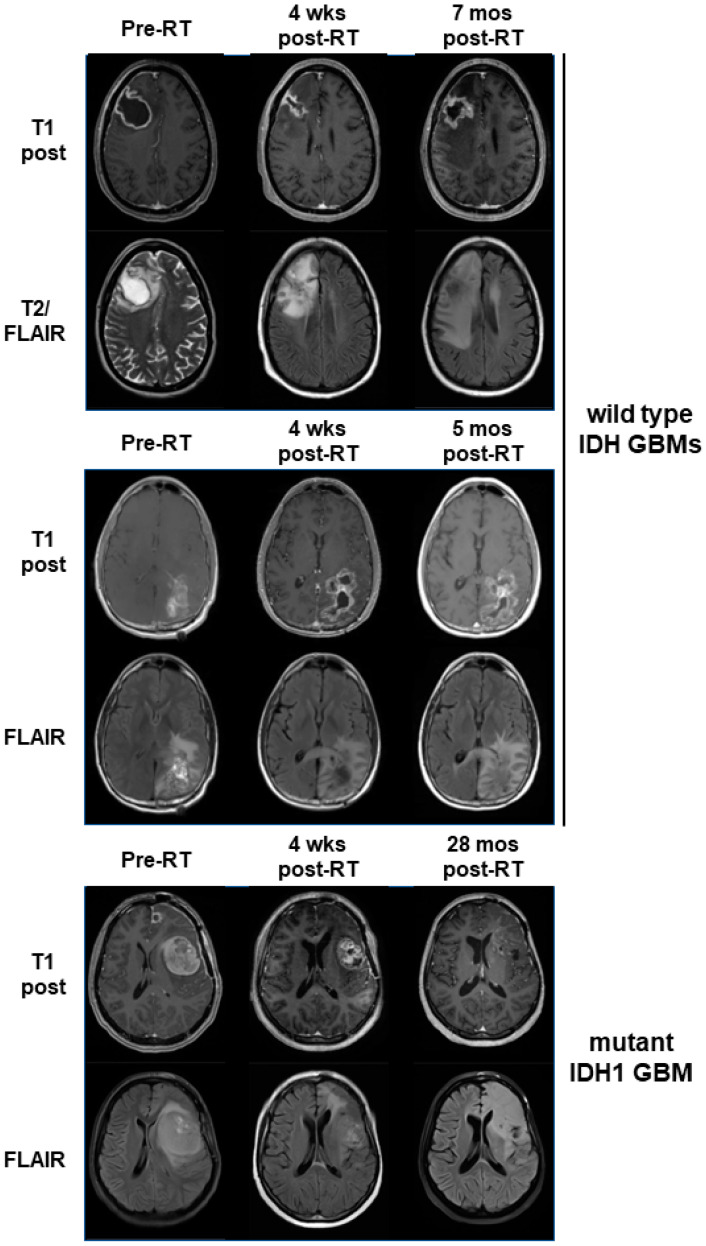
Histone deacetylase inhibitors (HDACis) are drugs that target the epigenetic state of cells by modifying the compaction of chromatin through effects on histone acetylation. Gliomas often harbor a mutation of isocitrate dehydrogenase (IDH) 1 or 2 that leads to changes in their epigenetic state presenting a hypermethylator phenotype. We postulated that glioma cells with IDH mutation, due to the presence of epigenetic changes, will show increased sensitivity to HDACis. This hypothesis was tested by expressing mutant IDH1 with a point alteration-converting arginine 132 to histidine-within glioma cell lines that contain wild-type IDH1. Glioma cells engineered to express mutant IDH1 produced D-2-hydroxyglutarate as expected. When assessed for response to the pan-HDACi drug belinostat, mutant IDH1-expressing glioma cells were subjected to more potent inhibition of growth than the corresponding control cells. Increased sensitivity to belinostat correlated with the increased induction of apoptosis. Finally, a phase I trial assessing the addition of belinostat to standard-of-care therapy for newly diagnosed glioblastoma patients included one patient with a mutant IDH1 tumor. This mutant IDH1 tumor appeared to display greater sensitivity to the addition of belinostat than the other cases with wild-type IDH tumors based on both standard magnetic resonance imaging (MRI) and advanced spectroscopic MRI criteria. These data together suggest that IDH mutation status within gliomas may serve as a biomarker of response to HDACis.
Keywords: HDAC; IDH; glioblastoma; sMRI.
Conflict of interest statement
The authors declare no conflict of interest.
Figures
Similar articles
-
HDAC1 and HDAC6 are essential for driving growth in IDH1 mutant glioma.Sci Rep. 2023 Aug 1;13(1):12433. doi: 10.1038/s41598-023-33889-3. Sci Rep. 2023. PMID: 37528157 Free PMC article.
-
IDH1 mutant glioma is preferentially sensitive to the HDAC inhibitor panobinostat.J Neurooncol. 2021 Sep;154(2):159-170. doi: 10.1007/s11060-021-03829-0. Epub 2021 Aug 23. J Neurooncol. 2021. PMID: 34424450 Free PMC article.
-
Efficient induction of differentiation and growth inhibition in IDH1 mutant glioma cells by the DNMT Inhibitor Decitabine.Oncotarget. 2013 Oct;4(10):1729-36. doi: 10.18632/oncotarget.1412. Oncotarget. 2013. PMID: 24077826 Free PMC article.
-
IDH1/2 mutations target a key hallmark of cancer by deregulating cellular metabolism in glioma.Neuro Oncol. 2013 Sep;15(9):1114-26. doi: 10.1093/neuonc/not087. Epub 2013 Jul 21. Neuro Oncol. 2013. PMID: 23877318 Free PMC article. Review.
-
IDH mutations in cancer and progress toward development of targeted therapeutics.Ann Oncol. 2016 Apr;27(4):599-608. doi: 10.1093/annonc/mdw013. Ann Oncol. 2016. PMID: 27005468 Review.
Cited by
-
Valproic acid targets IDH1 mutants through alteration of lipid metabolism.NPJ Metab Health Dis. 2024;2(1):20. doi: 10.1038/s44324-024-00021-6. Epub 2024 Aug 13. NPJ Metab Health Dis. 2024. PMID: 39149696 Free PMC article.
-
Epigenetic Alterations in Glioblastoma Multiforme as Novel Therapeutic Targets: A Scoping Review.Int J Mol Sci. 2025 Jun 12;26(12):5634. doi: 10.3390/ijms26125634. Int J Mol Sci. 2025. PMID: 40565099 Free PMC article.
References
-
- Reitman Z.J., Jin G., Karoly E.D., Spasojevic I., Yang J., Kinzler K.W., He Y., Bigner D.D., Vogelstein B., Yan H. Profiling the effects of isocitrate dehydrogenase 1 and 2 mutations on the cellular metabolome. Proc. Natl. Acad. Sci. USA. 2011;108:3270–3275. doi: 10.1073/pnas.1019393108. - DOI - PMC - PubMed
-
- Andronesi O.C., Kim G.S., Gerstner E., Batchelor T., Tzika A.A., Fantin V.R., Vander Heiden M.G., Sorensen A.G. Detection of 2-hydroxyglutarate in IDH-mutated glioma patients by in vivo spectral-editing and 2D correlation magnetic resonance spectroscopy. Sci. Transl. Med. 2012;4:116ra14. doi: 10.1126/scitranslmed.3002693. - DOI - PMC - PubMed
Publication types
MeSH terms
Substances
Grants and funding
LinkOut - more resources
Full Text Sources
Medical
Miscellaneous
