Multicenter Study
. 2023 Jul 1;208(1):79-97.
doi: 10.1164/rccm.202210-1971OC.

Cardiorespiratory Monitoring Data to Predict Respiratory Outcomes in Extremely Preterm Infants

Collaborators, Affiliations
Multicenter Study

Cardiorespiratory Monitoring Data to Predict Respiratory Outcomes in Extremely Preterm Infants

Namasivayam Ambalavanan et al. Am J Respir Crit Care Med. .

Abstract

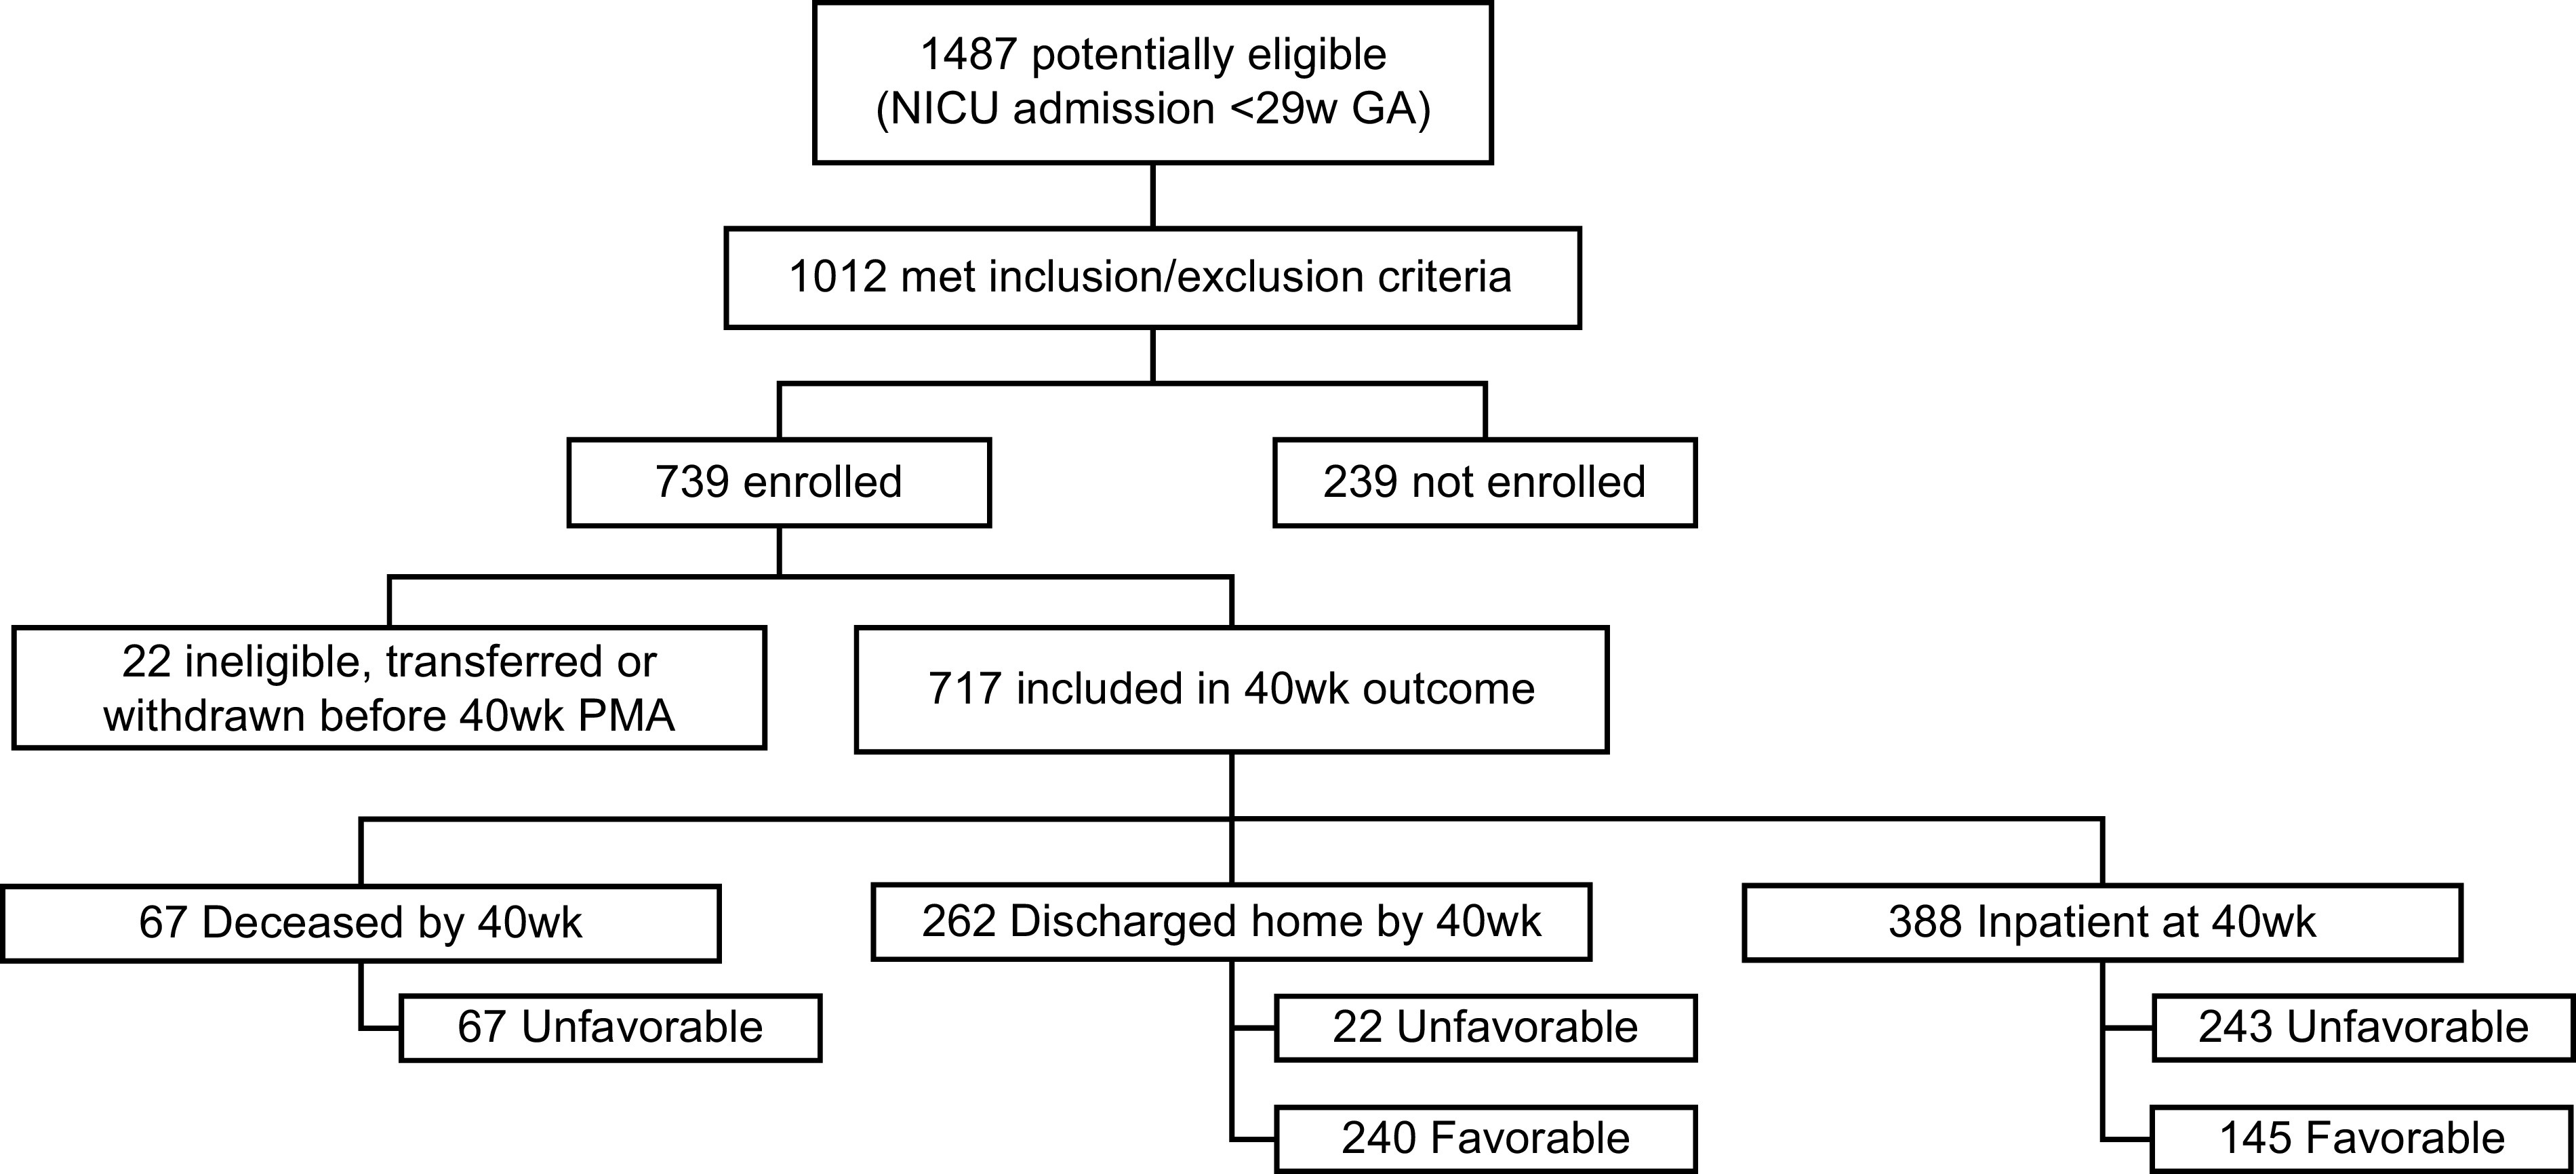
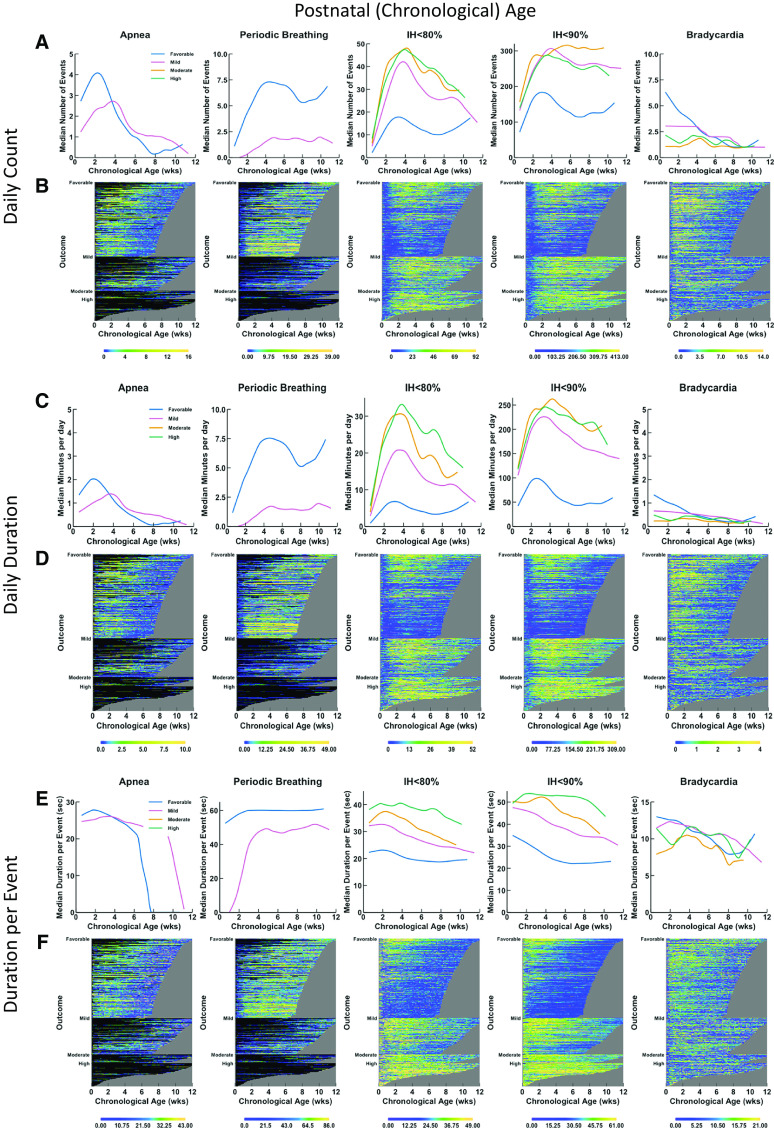
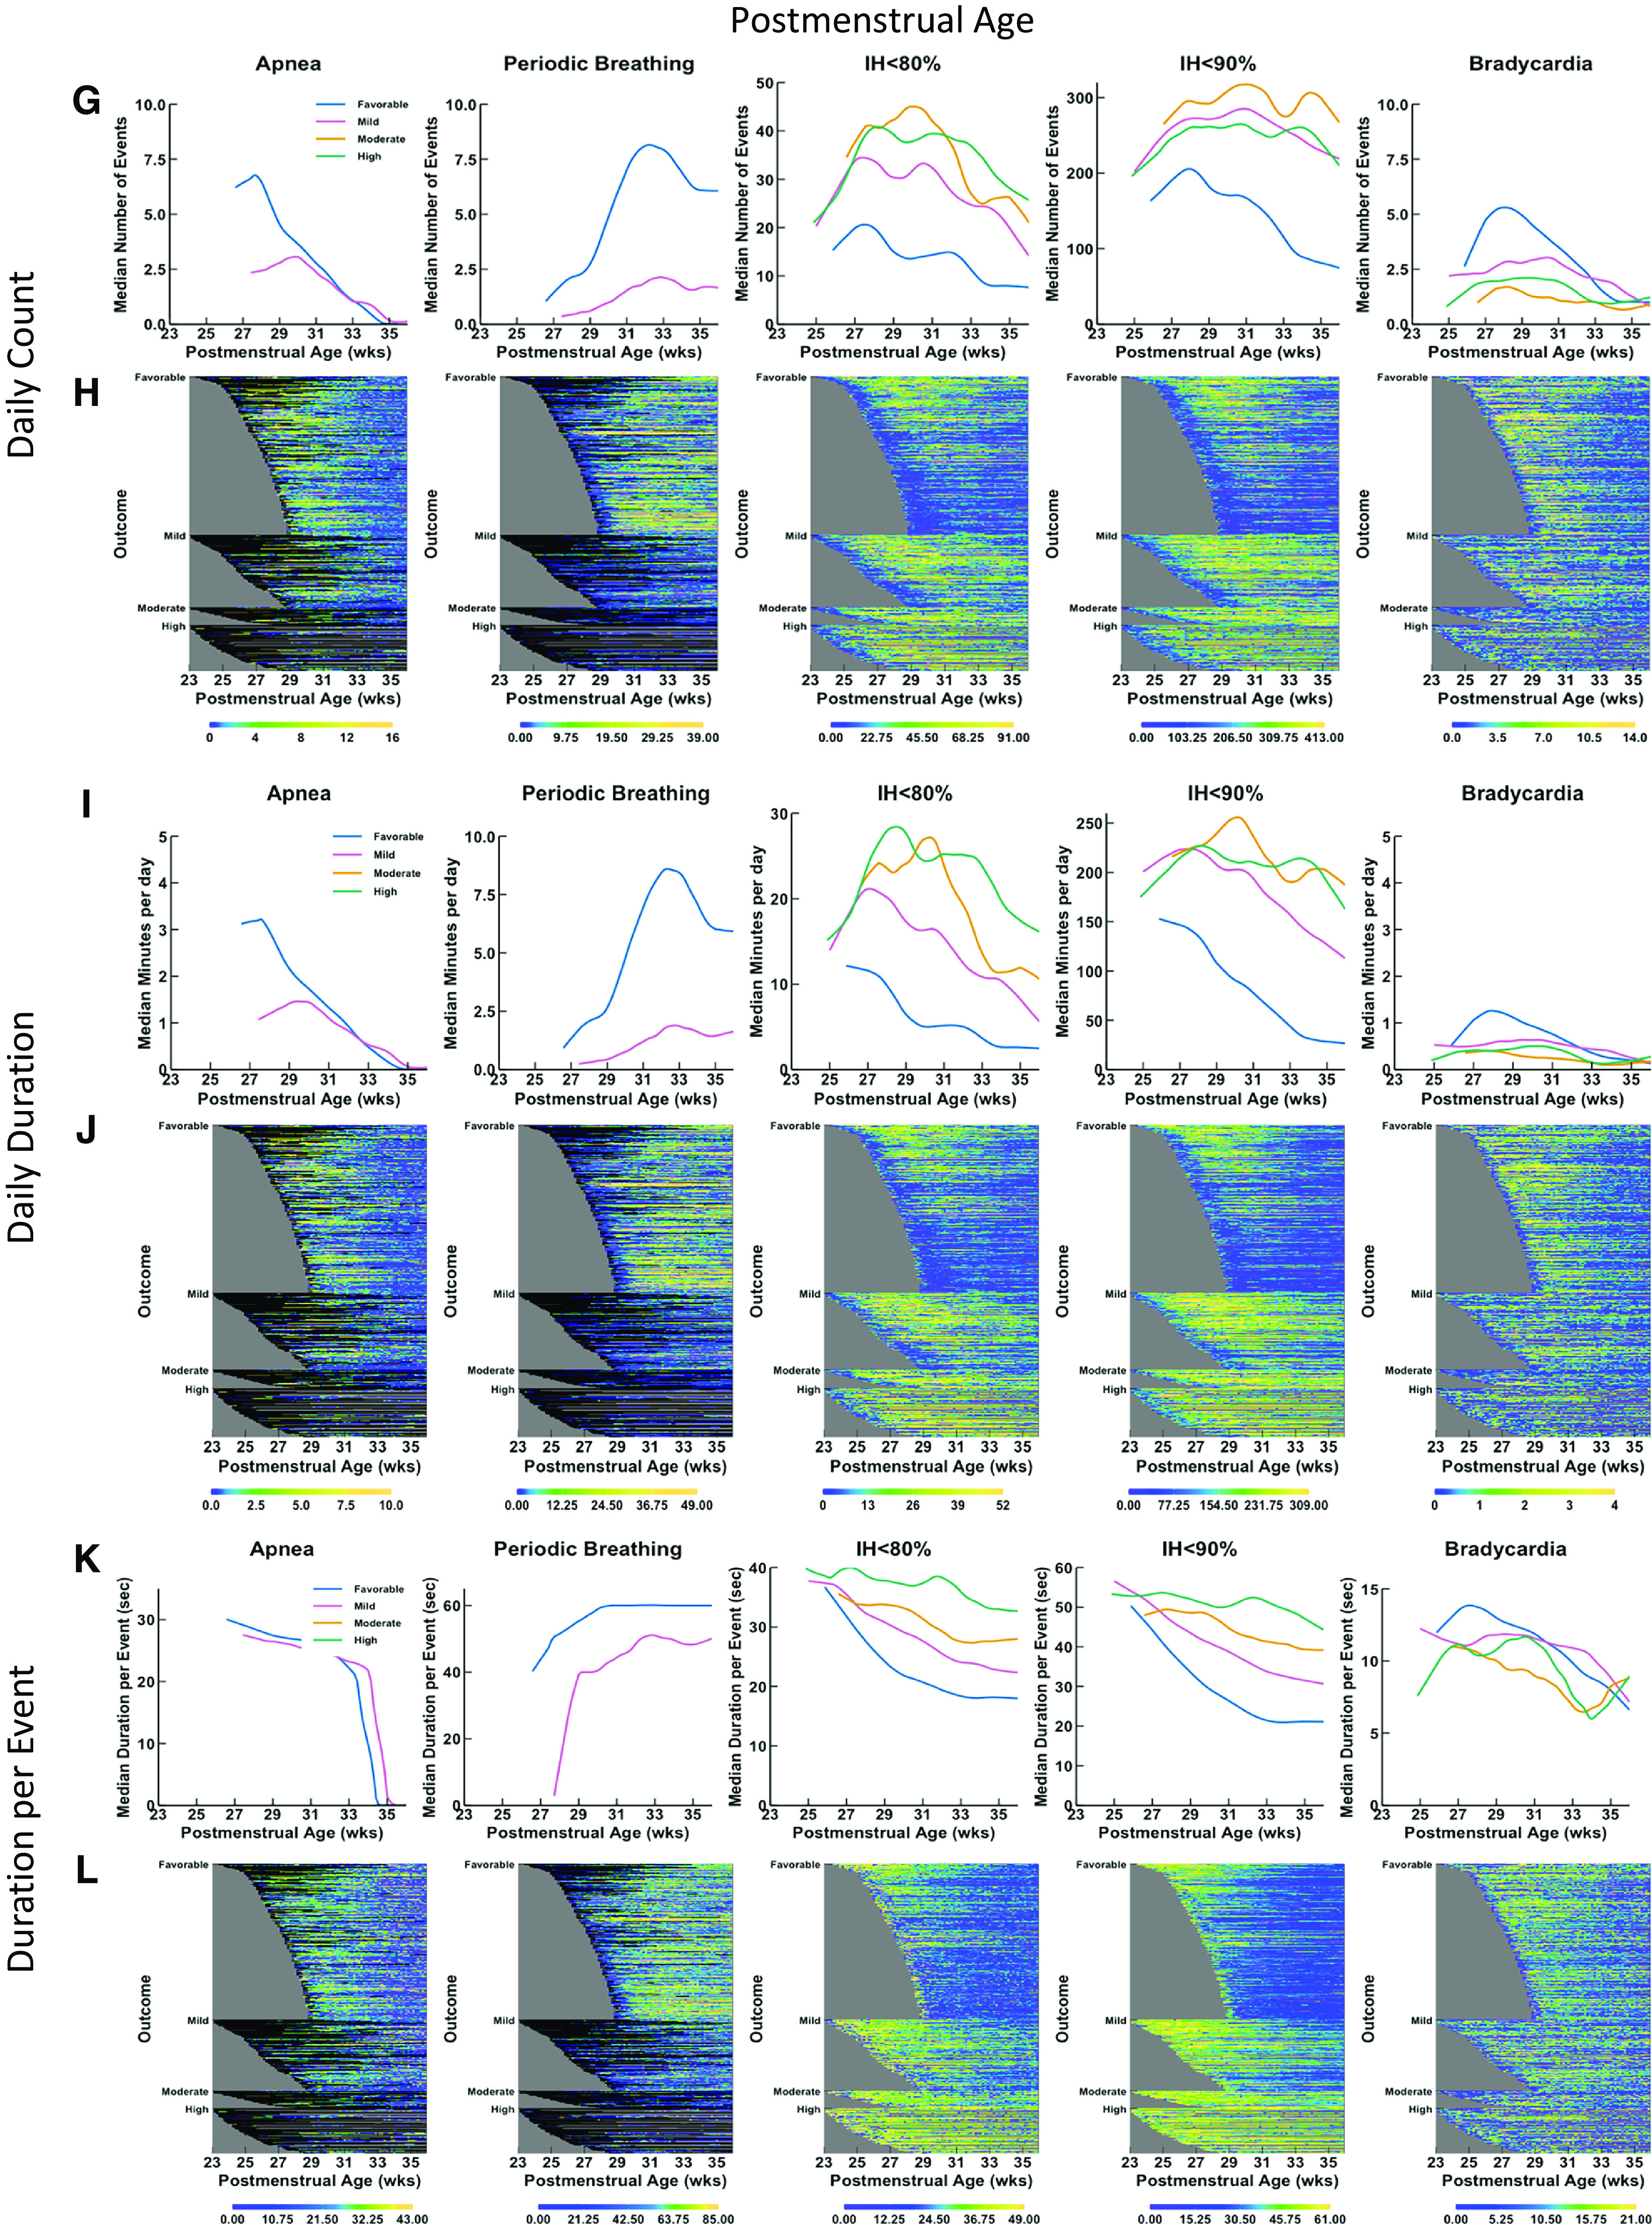
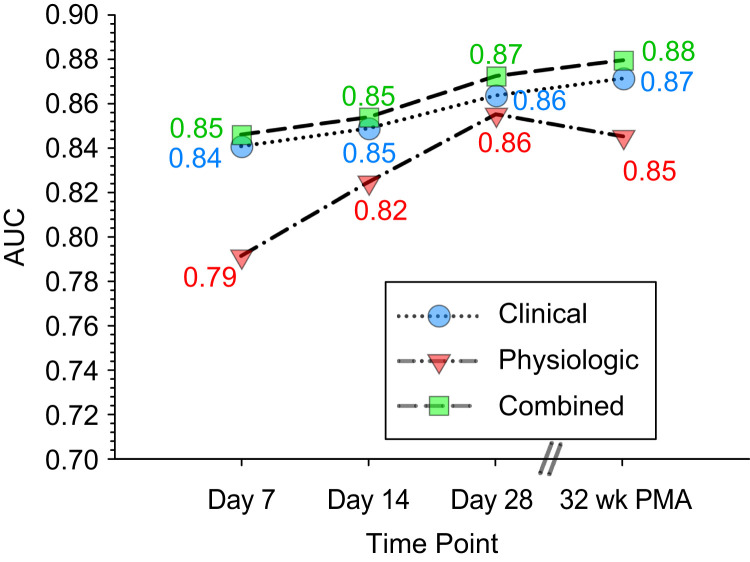
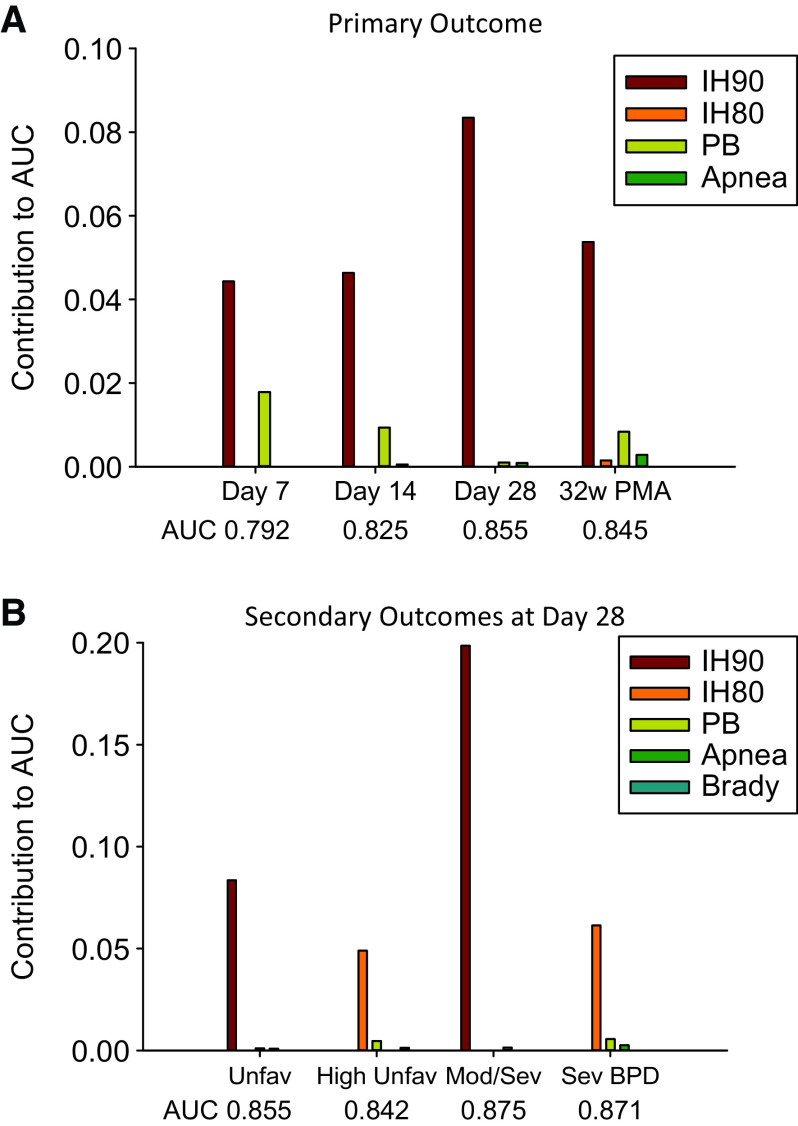
Rationale: Immature control of breathing is associated with apnea, periodic breathing, intermittent hypoxemia, and bradycardia in extremely preterm infants. However, it is not clear if such events independently predict worse respiratory outcome. Objectives: To determine if analysis of cardiorespiratory monitoring data can predict unfavorable respiratory outcomes at 40 weeks postmenstrual age (PMA) and other outcomes, such as bronchopulmonary dysplasia at 36 weeks PMA. Methods: The Prematurity-related Ventilatory Control (Pre-Vent) study was an observational multicenter prospective cohort study including infants born at <29 weeks of gestation with continuous cardiorespiratory monitoring. The primary outcome was either "favorable" (alive and previously discharged or inpatient and off respiratory medications/O2/support at 40 wk PMA) or "unfavorable" (either deceased or inpatient/previously discharged on respiratory medications/O2/support at 40 wk PMA). Measurements and Main Results: A total of 717 infants were evaluated (median birth weight, 850 g; gestation, 26.4 wk), 53.7% of whom had a favorable outcome and 46.3% of whom had an unfavorable outcome. Physiologic data predicted unfavorable outcome, with accuracy improving with advancing age (area under the curve, 0.79 at Day 7, 0.85 at Day 28 and 32 wk PMA). The physiologic variable that contributed most to prediction was intermittent hypoxemia with oxygen saturation as measured by pulse oximetry <90%. Models with clinical data alone or combining physiologic and clinical data also had good accuracy, with areas under the curve of 0.84-0.85 at Days 7 and 14 and 0.86-0.88 at Day 28 and 32 weeks PMA. Intermittent hypoxemia with oxygen saturation as measured by pulse oximetry <80% was the major physiologic predictor of severe bronchopulmonary dysplasia and death or mechanical ventilation at 40 weeks PMA. Conclusions: Physiologic data are independently associated with unfavorable respiratory outcome in extremely preterm infants.

Keywords: apnea; bronchopulmonary dysplasia; extremely premature infant; heart rate; intermittent hypoxemia; predictive value of tests.


Figures

Figure 1.
Figure 1.
Flow diagram of infants studied in Pre-Vent. GA = gestational age; NICU = neonatal ICU; PMA = postmenstrual age.
Figure 2.
Figure 2.
Trajectories and heat maps for daily counts, daily duration, and median duration per event of apnea, periodic breathing, intermittent hypoxemia (IH) ⩽80%, IH ⩽90%, and bradycardia for infants enrolled in Pre-Vent. Chronologic (postnatal) age is shown on the x-axis in the left panels (A–F) and postmenstrual age is shown on the x-axis in the right panels (G–L). Data are shown from 3 days of age, and a minimum number of 30 infants was required to calculate a trajectory curve. Only infant days that have at least 12 hours of signal available are included. Top row of graphs (A, G) and heatmaps (B, H) show data for daily counts, whereas the middle row of graphs (C, I) and heatmaps (D, J) show data for daily duration of events, and bottom row of graphs (E, K) and heatmaps (F, L) show data for median duration per event. The top row of graphs (A, G) shows trajectories of daily count of event by outcome (color-coded lines), with the number of events on the y-axis and age on the x-axis. The second row of panels shows heatmaps (B, H) for daily counts of events. The heat map shows data for all infants, with each infant per horizontal line, grouped by outcome as favorable (at top), mildly unfavorable (in middle), and moderately or highly unfavorable (at bottom). Within each category of outcome, infants are grouped by gestational age with oldest infants at the bottom and youngest infants at the top, with the data plotted horizontally by chronological age on the x-axis. Color coding for number of events per day is shown with yellow indicating more events and deepening shades of blue indicating fewer events. Black indicates no data, such as for apnea or periodic breathing when the infant is on a ventilator. The gray area represents data truncation when the infant has reached 36 weeks, 6 days postmenstrual age, the predetermined endpoint for the Pre-Vent physiologic outcomes analysis. The middle row of graphs (C, I) shows trajectories of daily duration of event by outcome (color-coded lines), with the number of events on the y-axis and the age on the x-axis. The second row of panels shows heatmaps (D, J) for daily duration of the events. The lower row of graphs (E, F) shows trajectories of median duration per event by outcome (color-coded lines), with the number of events on the y-axis and the chronologic age on the x-axis. The bottom row of panels shows heatmaps (F, L) for median duration per event.
Figure 2.
Figure 2.
Trajectories and heat maps for daily counts, daily duration, and median duration per event of apnea, periodic breathing, intermittent hypoxemia (IH) ⩽80%, IH ⩽90%, and bradycardia for infants enrolled in Pre-Vent. Chronologic (postnatal) age is shown on the x-axis in the left panels (A–F) and postmenstrual age is shown on the x-axis in the right panels (G–L). Data are shown from 3 days of age, and a minimum number of 30 infants was required to calculate a trajectory curve. Only infant days that have at least 12 hours of signal available are included. Top row of graphs (A, G) and heatmaps (B, H) show data for daily counts, whereas the middle row of graphs (C, I) and heatmaps (D, J) show data for daily duration of events, and bottom row of graphs (E, K) and heatmaps (F, L) show data for median duration per event. The top row of graphs (A, G) shows trajectories of daily count of event by outcome (color-coded lines), with the number of events on the y-axis and age on the x-axis. The second row of panels shows heatmaps (B, H) for daily counts of events. The heat map shows data for all infants, with each infant per horizontal line, grouped by outcome as favorable (at top), mildly unfavorable (in middle), and moderately or highly unfavorable (at bottom). Within each category of outcome, infants are grouped by gestational age with oldest infants at the bottom and youngest infants at the top, with the data plotted horizontally by chronological age on the x-axis. Color coding for number of events per day is shown with yellow indicating more events and deepening shades of blue indicating fewer events. Black indicates no data, such as for apnea or periodic breathing when the infant is on a ventilator. The gray area represents data truncation when the infant has reached 36 weeks, 6 days postmenstrual age, the predetermined endpoint for the Pre-Vent physiologic outcomes analysis. The middle row of graphs (C, I) shows trajectories of daily duration of event by outcome (color-coded lines), with the number of events on the y-axis and the age on the x-axis. The second row of panels shows heatmaps (D, J) for daily duration of the events. The lower row of graphs (E, F) shows trajectories of median duration per event by outcome (color-coded lines), with the number of events on the y-axis and the chronologic age on the x-axis. The bottom row of panels shows heatmaps (F, L) for median duration per event.
Figure 3.
Figure 3.
Graph of predictive accuracy of models using clinical, physiologic, and combined (clinical and physiological) variables at different postnatal time points (Postnatal Days 7, 14, and 28 and 32 wk PMA). PMA = postmenstrual age.
Figure 4.
Figure 4.
Graph showing contributions of different physiologic variables (each variable incorporating different features: duration per event, daily duration, and count) to outcome. (A) Unfavorable versus favorable outcome at different time points. (B) Primary and secondary outcomes at Postnatal Day 28. AUC = area under the curve; BPD = bronchopulmonary dysplasia; IH80 = intermittent hypoxemia events with oxygen saturation as measured by pulse oximetry <80%; IH90 = intermittent hypoxemia events with oxygen saturation as measured by pulse oximetry <90%; PB = periodic breathing; PMA = postmenstrual age.

Comment in

References

    1. Liu L, Oza S, Hogan D, Perin J, Rudan I, Lawn JE, et al. Global, regional, and national causes of child mortality in 2000-13, with projections to inform post-2015 priorities: an updated systematic analysis. Lancet . 2015;385:430–440. - PubMed
    1. Blencowe H, Cousens S, Oestergaard MZ, Chou D, Moller AB, Narwal R, et al. National, regional, and worldwide estimates of preterm birth rates in the year 2010 with time trends since 1990 for selected countries: a systematic analysis and implications. Lancet . 2012;379:2162–2172. - PubMed
    1. Mwaniki MK, Atieno M, Lawn JE, Newton CR. Long-term neurodevelopmental outcomes after intrauterine and neonatal insults: a systematic review. Lancet . 2012;379:445–452. - PMC - PubMed
    1. Henderson-Smart DJ. The effect of gestational age on the incidence and duration of recurrent apnoea in newborn babies. Aust Paediatr J . 1981;17:273–276. - PubMed
    1. Di Fiore JM, Martin RJ, Gauda EB. Apnea of prematurity—perfect storm. Respir Physiol Neurobiol . 2013;189:213–222. - PubMed

Publication types