. 2023 May 22;15(10):4391-4410.
doi: 10.18632/aging.204742. Epub 2023 May 22.

Hairy gene homolog increases nasopharyngeal carcinoma cell stemness by upregulating Bmi-1

Affiliations

Hairy gene homolog increases nasopharyngeal carcinoma cell stemness by upregulating Bmi-1

Ye Lei et al. Aging (Albany NY). .

Abstract

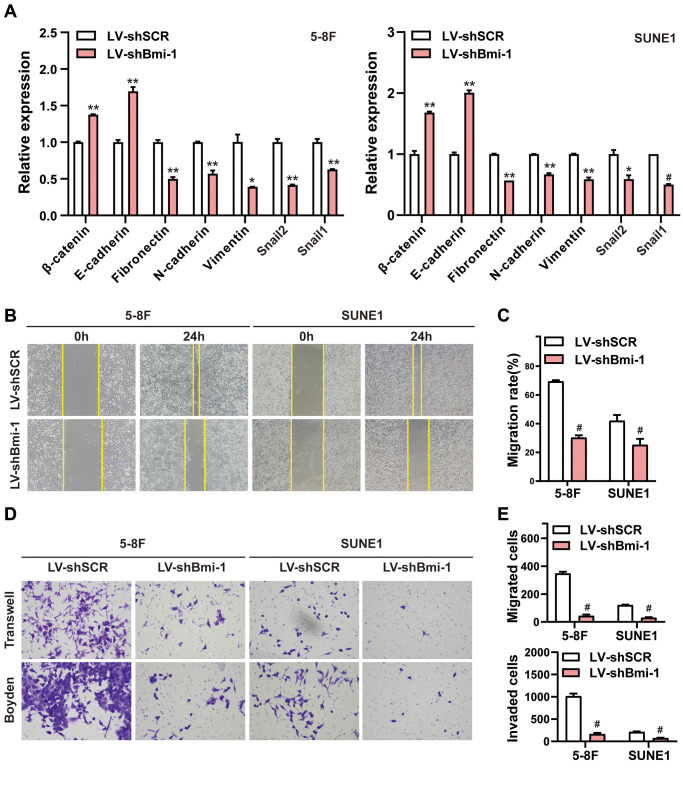
B-cell-specific Moloney murine leukemia virus integration site 1 (Bmi-1) is overexpressed in various cancer types. We found that Bmi-1 mRNA levels were elevated in nasopharyngeal carcinoma (NPC) cell lines. In immunohistochemical analyses, high Bmi-1 levels were observed in not only 5 of 38 non-cancerous nasopharyngeal squamous epithelial biopsies, but also in 66 of 98 NPC specimens (67.3%). High Bmi-1 levels were detected more frequently in T3-T4, N2-N3 and stage III-IV NPC biopsies than in T1-T2, N0-N1 and stage I-II NPC samples, indicating that Bmi-1 is upregulated in advanced NPC. In 5-8F and SUNE1 NPC cells, stable depletion of Bmi-1 using lentiviral RNA interference greatly suppressed cell proliferation, induced G1-phase cell cycle arrest, reduced cell stemness and suppressed cell migration and invasion. Likewise, knocking down Bmi-1 inhibited NPC cell growth in nude mice. Both chromatin immunoprecipitation and Western blotting assays demonstrated that Hairy gene homolog (HRY) upregulated Bmi-1 by binding to its promoter, thereby increasing the stemness of NPC cells. Immunohistochemistry and quantitative real-time PCR analyses revealed that HRY expression correlated positively with Bmi-1 expression in a cohort of NPC biopsies. These findings suggested that HRY promotes NPC cell stemness by upregulating Bmi-1, and that silencing Bmi-1 can suppress NPC progression.

Keywords: Bmi-1; HRY; cell proliferation; migration; nasopharyngeal carcinoma (NPC).


Conflict of interest statement

CONFLICTS OF INTEREST: The authors declare no conflicts of interest related to this study.

Figures

Figure 1
Figure 1
Bmi-1 was markedly upregulated in NPC clinical tissue specimens. (A) Bmi-1 levels were detected using qRT-PCR in the NPC cell lines shown. (B) Representative photographs from immunohistochemical analyses of Bmi-1 protein levels in NPC tissues and non-cancerous nasopharyngeal epithelial tissues. (C) Bmi-1 levels were significantly greater in NPC tissues than in non-cancerous nasopharyngeal epithelial tissues (P < 0.001, χ2 test).
Figure 2
Figure 2
Bmi-1 upregulation was associated with malignant tumor progression in NPC patients. (A) Representative images of Bmi-1 levels in clinical tissue biopsies from NPC patients with differing tumor-node-metastasis (TNM) stages, clinical stages and histological types. Low Bmi-1 expression was detected in T1 (a), N0 (c), M0 (e), stage I (g) and differentiated nonkeratinizing carcinoma (DNKC) (i) NPC biopsies, while high Bmi-1 expression was observed in T3 (b), N3 (d), M1 (f), stage IV (h) and undifferentiated carcinoma (UDC) (j) tumors. (B) The number and percentage of samples with high and low Bmi-1 levels according to various clinicopathological traits (χ2 test). (C) Cumulative overall survival curves of 98 NPC patients with high or low Bmi-1 levels. A log-rank test was used to calculate the P value.
Figure 3
Figure 3
RNAi-induced knockdown of Bmi-1 inhibited the in vitro proliferation and in vivo tumorigenesis of NPC cells. (A) The relative mRNA levels of Bmi-1 in shBmi-1-expressing 5-8F and SUNE1 cells were determined via qRT-PCR. SCR: scrambled control shRNA. (B) The protein levels of Bmi-1 in shBmi-1-expressing 5-8F and SUNE1 cells were determined via Western blotting. (C, D) A CCK8 assay was employed to assess the growth of shBmi-1-expressing 5-8F and SUNE1 cells. (E, F) A colony formation assay was used to examine the proliferation abilities of shBmi-1-expressing 5-8F and SUNE1 cells. (G, H) Propidium iodide staining and flow cytometry were used to detect the cell cycle distributions of shBmi-1-expressing 5-8F and SUNE1 cells (G), and the statistical results were calculated (H). (IK) Bmi-1 knockdown inhibited tumor growth from 5-8F cells in nude mice. A representative tumor picture is shown (I), along with a tumor volume growth curve (J) and the tumor weights (K).
Figure 4
Figure 4
RNAi-induced suppression of Bmi-1 reduced NPC cell stemness. (A) qRT-PCR analysis of various genes in shBmi-1-expressing 5-8F and SUNE1 cells. (B, C) Depletion of endogenous Bmi-1 in 5-8F cells inhibited tumor sphere formation. (D) Western blotting results of cell extracts from shBmi-1-expressing 5-8F and SUNE1 cells. The loading control was GAPDH.
Figure 5
Figure 5
RNAi-induced knockdown of Bmi-1 suppressed the EMT, migration and invasion of NPC cells in vitro. (A) The mRNA levels of various genes in shBmi-1-expressing NPC cells were determined using qRT-PCR. (B, C) Wound healing assays were performed in shBmi-1-expressing 5-8F and SUNE1 cells. Migration activity was measured based on the distance from the scratch boundary lines to the cell-free space for 24 hours. (D, E) The motility and invasiveness of shBmi-1-expressing NPC cells were determined using Transwell migration and Boyden invasion assays, respectively.
Figure 6
Figure 6
HRY increased the stemness of NPC cells by promoting Bmi-1 expression. (A) Western blotting was used to determine the protein levels of HRY and Bmi-1 in NPC cells transfected with different plasmids. (B) Schematic diagram of the Bmi-1 promoter, displaying possible HRY binding sites. ATG: start codon for translation. (C) ChIP assays were conducted with anti-HRY or IgG antibodies to determine HRY binding sites on the Bmi-1 promoter in CNE2 cells. (D) The proportions of SP cells among CNE2 cells transduced with different plasmids were analyzed using flow cytometry. (E) Tumor sphere formation in CNE2 cells transduced with different plasmids.
Figure 7
Figure 7
HRY levels correlated positively with Bmi-1 levels in NPC tissues. (A) HRY and Bmi-1 mRNA levels correlated significantly and positively with one another in NPC samples (Spearman’s correlation analysis, r = 0.8273, P = 0.0005). (B) Relationship between HRY and Bmi-1 levels in immunohistochemical analysis of NPC tissues. (C) HRY levels correlated positively with Bmi-1 levels in NPC tissues (χ2 test).

References

    1. Campion NJ, Ally M, Jank BJ, Ahmed J, Alusi G. The molecular march of primary and recurrent nasopharyngeal carcinoma. Oncogene. 2021; 40:1757–74. 10.1038/s41388-020-01631-2 - DOI - PubMed
    1. Hui EP, Ma BBY, Chan ATC. The emerging data on choice of optimal therapy for locally advanced nasopharyngeal carcinoma. Curr Opin Oncol. 2020; 32:187–95. 10.1097/CCO.0000000000000622 - DOI - PubMed
    1. Wong KCW, Hui EP, Lo KW, Lam WKJ, Johnson D, Li L, Tao Q, Chan KCA, To KF, King AD, Ma BBY, Chan ATC. Nasopharyngeal carcinoma: an evolving paradigm. Nat Rev Clin Oncol. 2021; 18:679–95. 10.1038/s41571-021-00524-x - DOI - PubMed
    1. Jiang L, Li J, Song L. Bmi-1, stem cells and cancer. Acta Biochim Biophys Sin (Shanghai). 2009; 41:527–34. 10.1093/abbs/gmp040 - DOI - PubMed
    1. Ren X, Liu L, Zhou Y, Zhu Y, Zhang H, Zhang Z, Li H. Nanoparticle siRNA against BMI-1 with a Polyethylenimine-Laminarin Conjugate for Gene Therapy in Human Breast Cancer. Bioconjug Chem. 2016; 27:66–73. 10.1021/acs.bioconjchem.5b00650 - DOI - PubMed

Publication types