. 2023 Aug 1;83(15):2527-2542.
doi: 10.1158/0008-5472.CAN-22-3382.

PP2Ac Deficiency Enhances Tumor Immunogenicity by Activating STING-Type I Interferon Signaling in Glioblastoma

Affiliations

PP2Ac Deficiency Enhances Tumor Immunogenicity by Activating STING-Type I Interferon Signaling in Glioblastoma

Isha Mondal et al. Cancer Res. .

Abstract

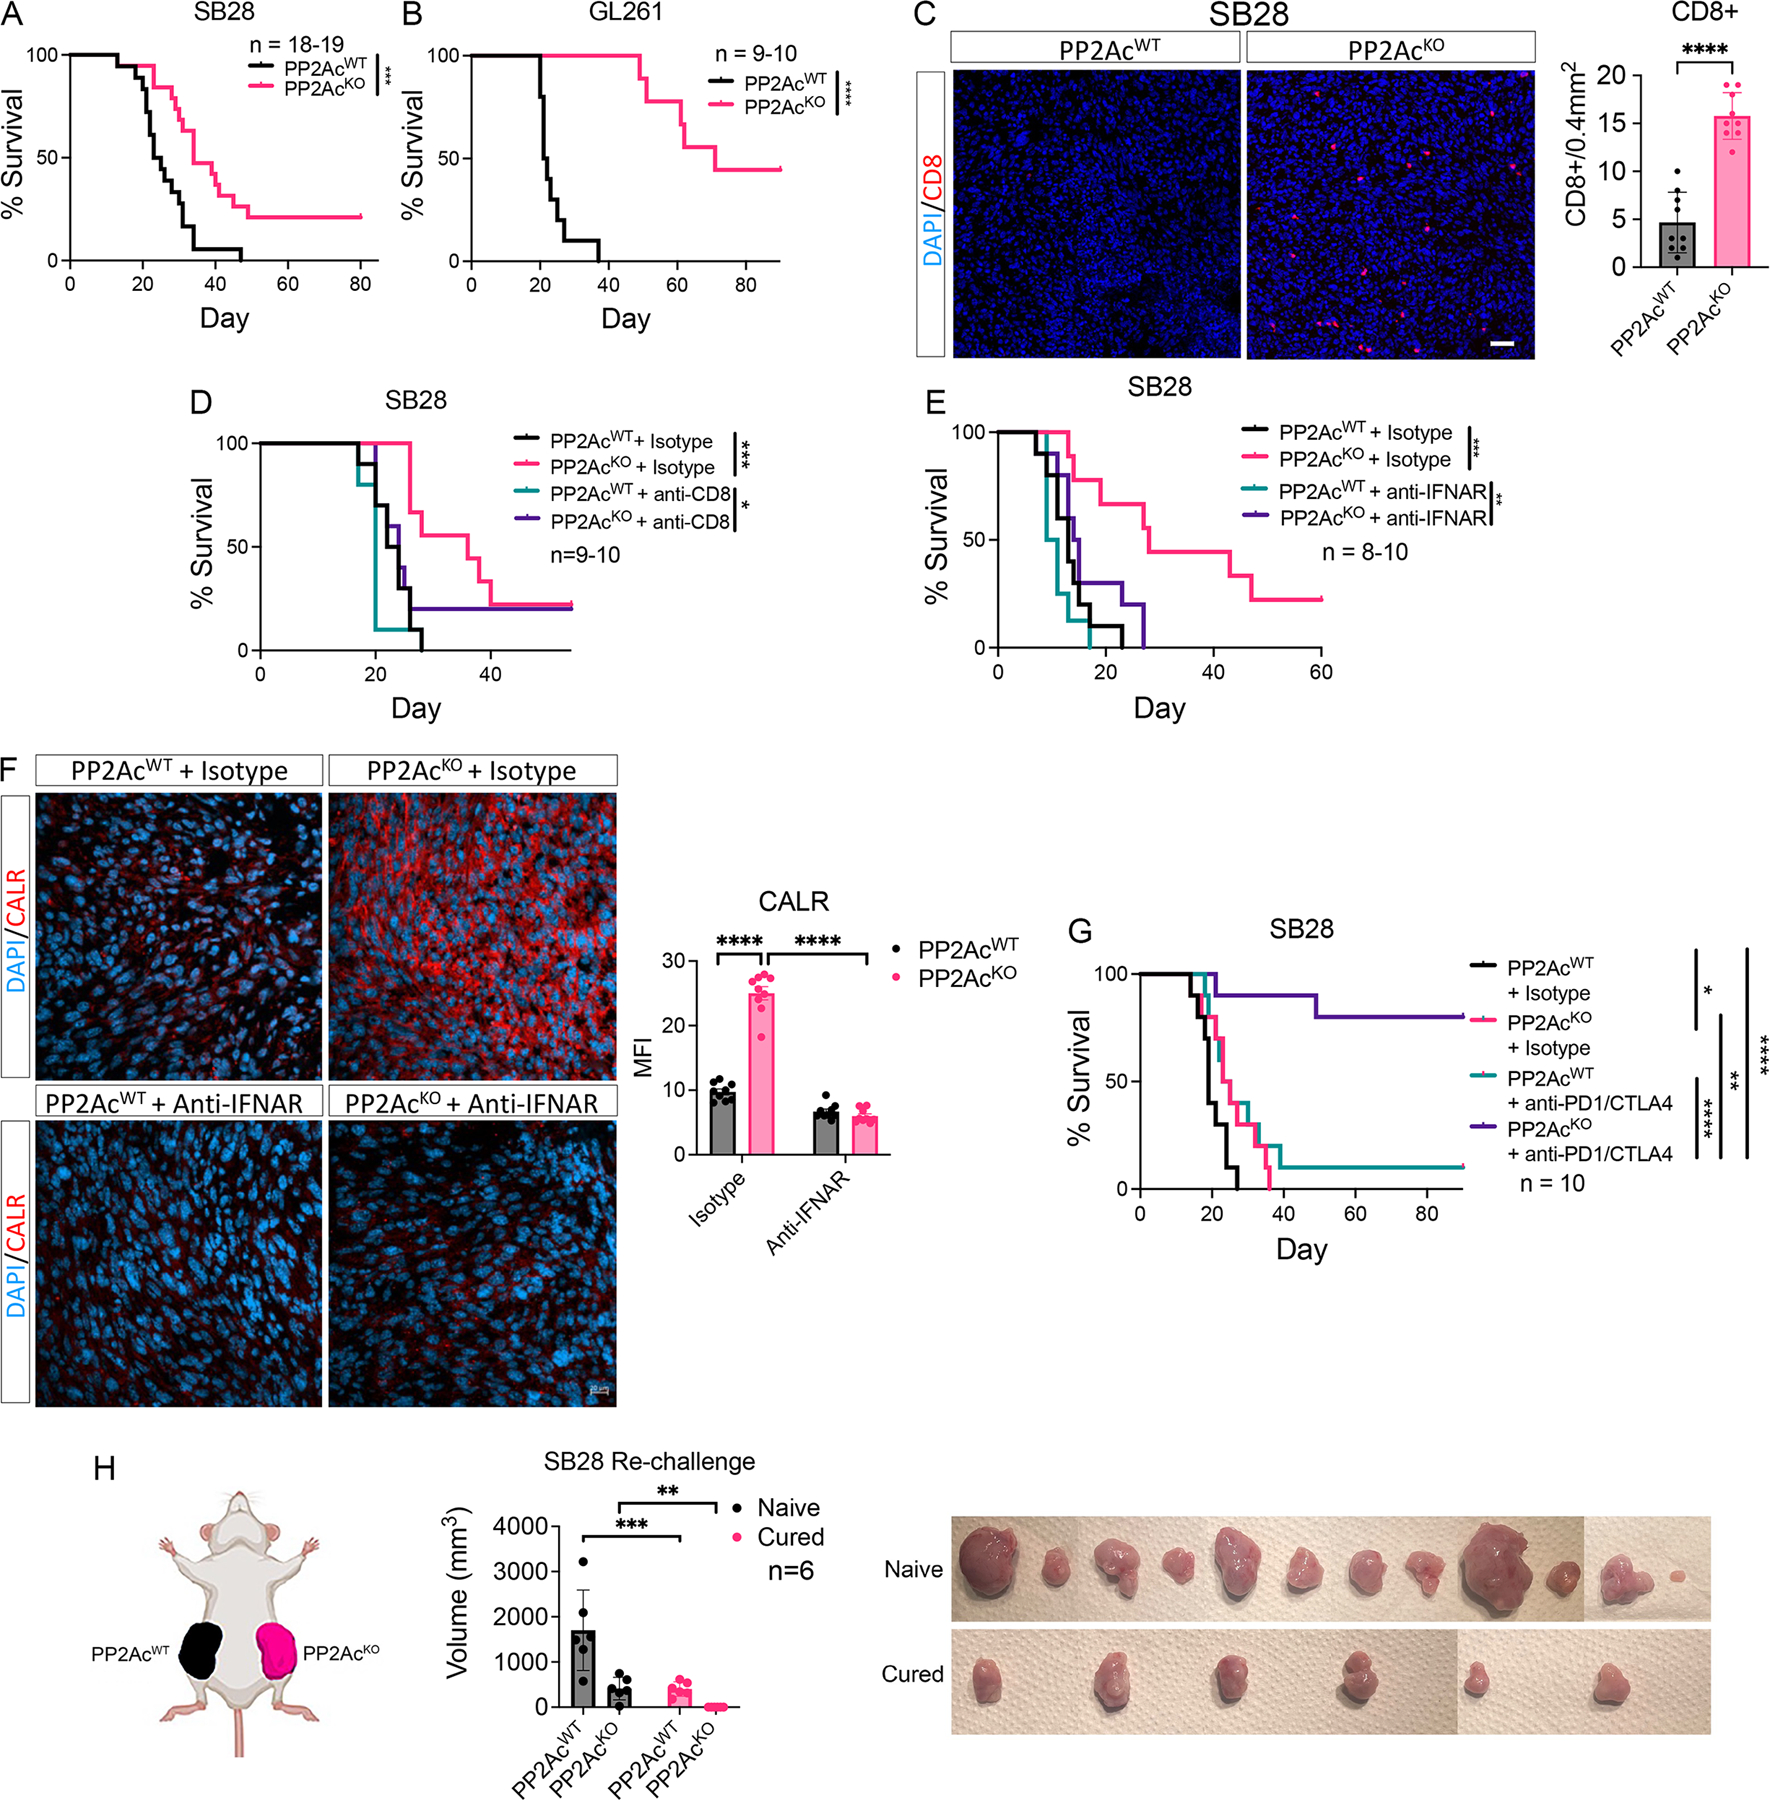
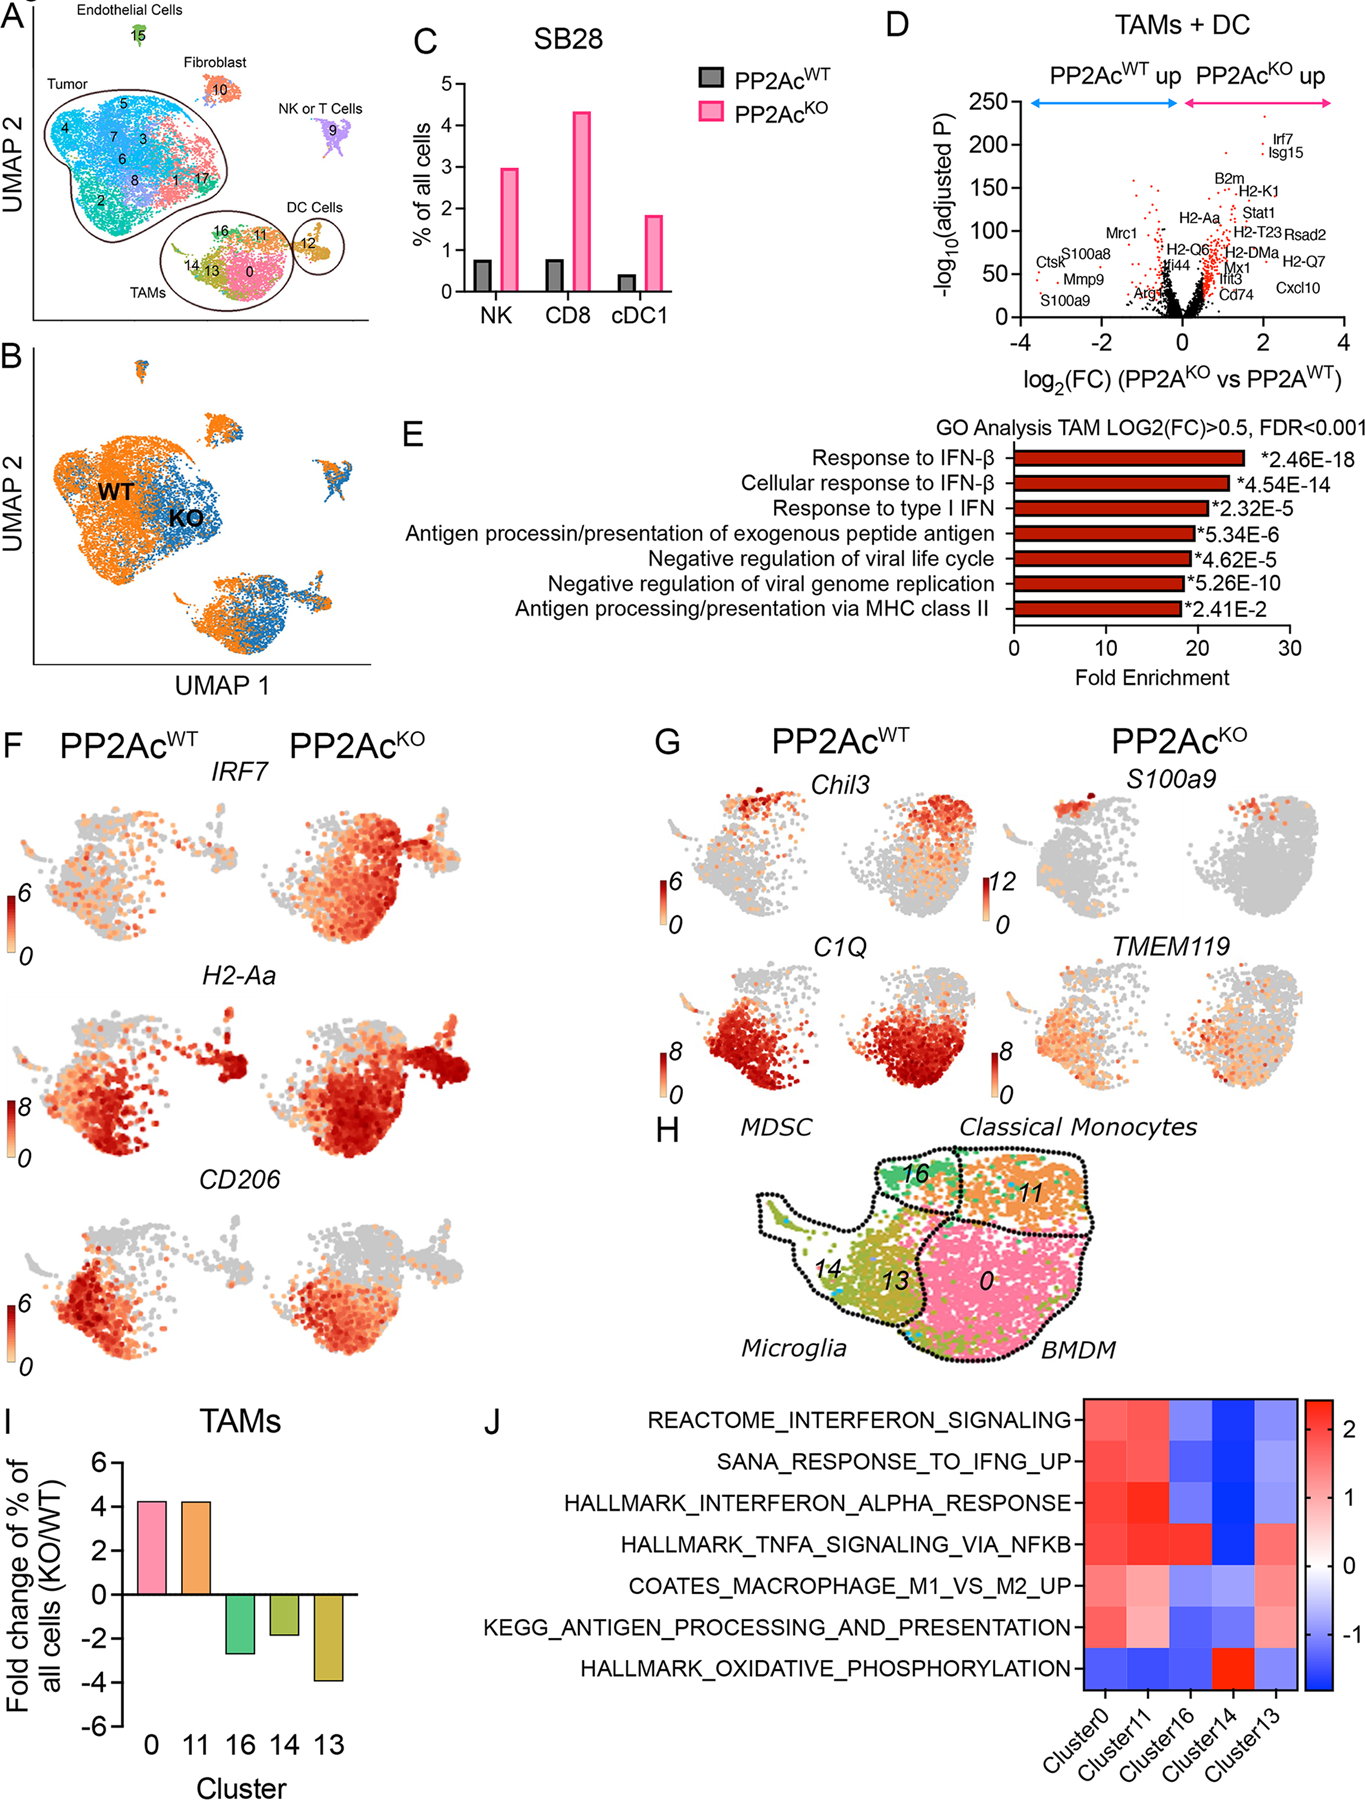
Glioblastoma (GBM) is an immunologically "cold" tumor that does not respond to current immunotherapy. Here, we demonstrate a fundamental role for the α-isoform of the catalytic subunit of protein phosphatase-2A (PP2Ac) in regulating glioma immunogenicity. Genetic ablation of PP2Ac in glioma cells enhanced double-stranded DNA (dsDNA) production and cGAS-type I IFN signaling, MHC-I expression, and tumor mutational burden. In coculture experiments, PP2Ac deficiency in glioma cells promoted dendritic cell (DC) cross-presentation and clonal expansion of CD8+ T cells. In vivo, PP2Ac depletion sensitized tumors to immune-checkpoint blockade and radiotherapy treatment. Single-cell analysis demonstrated that PP2Ac deficiency increased CD8+ T-cell, natural killer cell, and DC accumulation and reduced immunosuppressive tumor-associated macrophages. Furthermore, loss of PP2Ac increased IFN signaling in myeloid and tumor cells and reduced expression of a tumor gene signature associated with worse patient survival in The Cancer Genome Atlas. Collectively, this study establishes a novel role for PP2Ac in inhibiting dsDNA-cGAS-STING signaling to suppress antitumor immunity in glioma.

Significance: PP2Ac deficiency promotes cGAS-STING signaling in glioma to induce a tumor-suppressive immune microenvironment, highlighting PP2Ac as a potential therapeutic target to enhance tumor immunogenicity and improve response to immunotherapy.


Conflict of interest statement

Competing interests: WH and RL hold patents related to targeting PP2A for immunotherapy. All other authors have no competing interests.

Figures

Fig. 1.
Fig. 1.. PP2A deficiency in glioma cells promote Type I IFN signaling, ICD and MHC-I expression.
(A) WT and PP2AcKO SB28 transcriptome profiles were analyzed by RNAseq of (n=3 per group). GO Pathway enrichment analysis showing the top 10 enriched pathways ranked with highest fold enrichment using differentially upregulated genes in PP2AcKO compared to WT SB28 (Log2FC>0.5, FDR<0.01). * indicate p-value of individual pathway. P value adjustment was performed using Bonferroni correction. (B) Gene set enrichment analysis (GSEA) plots for Type I IFN signature among PP2AcKO vs WT SB28. NES: Normalized Enrichment Score. (C) WT and PP2AcKO SB28 expression of IFN-related genes were measured via RT-qPCR (D) WT and PP2AcKO SB28 protein expression of pSTAT1 and pIRF3 were analyzed by immunoblotting. (E) Time course of XCelligence assay showing the normalized cell index over 30 h of the assay for WT and PP2AcKO SB28. Each time-point measurement was from n = 4 biological replicates. (F) Cell cycle analysis of WT and PP2AcKO SB28 cells. Representative plots of DNA vs. EDU content. EDU positivity was used to identify S-phase, while DNA content was used to distinguish G0/1 and G2M phase. * indicate level of significance for difference between WT and PP2AcKO..(G) The expression of apoptosis marker, Annexin V, in WT and PP2AcKO SB28 was determined by flow cytometry. (H-I) Expression of ICD marker CALR. In WT and PP2AcKO SB28 was determined by flow cytometry (I) and immunofluorescence staining for CALR (red) and nucleus (4,6-diamidino-2-phenylindole (DAPI), blue). Scale bar, 20 μm.. (J) Conditioned medium was collected from WT and PP2AcKO SB28 cultures after 3 hours. Secreted HMGB levels were quantified using ELISA. (K) WT and PP2AcKO SB28 expression of MHC-I components and antigen-presenting machinery genes were measured via RT-qPCR. (L) WT and PP2AcKO SB28 surface expression of MHC-I were determined by flow cytometry. (M) Surface expression of MHC-I in WT and PP2AcKO GL261 (murine glioma), SF8628 (human DIPG), D425 (human medulloblastoma) were determined by flow cytometry. PP2Ac protein expression were analyzed by immunoblotting to confirm downregulation of protein expression. (N) WT and PP2AcKO SB28 were treated with isotype control or anti-IFNAR for 72 hours. Surface expression of MHC-I were then determined by flow cytometry (O) WT and PP2AcKO SB28 were treated with isotype control or anti-IFNAR for 72 hours. Expression of IFN-related genes were measured via RT-qPCR. Heat maps reflect log2FC of indicated gene relative to isotype treated WT SB28. Data for C-O are from at least two independent experiments with similar results. Error bars depict standard error of mean (SEM). P values were calculated by unpaired t-test (**P<0.01, ***P<0.001, ****P<0.0001).
Fig. 2.
Fig. 2.. Pharmacologic inhibition of PP2Ac, using LB-100, in glioma promote ICF, Type I IFN signaling, ICD and MHC-I expression.
(A) LB-100 treated WT SB28 with indicated concentration for 3 hours and PP2AcKO SB28 were assessed for PP2A activity measured using phosphatase assay and expressed as ratio relative to untreated WT SB28. (B) Time course of XCelligence assay showing the normalized cell index following LB-100 treatment in WT SB28 cells at indicated concentrations. Each time-point measurement was from n = 4 biological replicates.(C) The relative normalized cell index 3 hour after LB-100 treatment at indicated concentrations compared to untreated WT SB28. (D) LB-100 treated WT SB28 with indicated concentration for 3 hours and PP2AcKO SB28 were assessed for surface CALR expression by flow cytometry. (E) Conditioned medium from LB-100 treated WT SB28 with indicated concentration for 3 hours and PP2AcKO SB28 were assessed for HMGB secretion using ELISA. (F) LB-100 treated WT SB28 with indicated concentration for 72 hours and PP2AcKO SB28 were assessed for p-STAT1 expression by flow cytometry. (G) LB-100 treated WT SB28 with indicated concentration for 72 hours and PP2AcKO SB28. Expression of IFN-related genes were measured via RT-qPCR. Heat maps reflect log2FC of indicated gene relative to isotype treated WT SB28. (H) LB-100 treated WT SB28 with indicated concentration for 72 hours and PP2AcKO SB28 were assessed for MHC-I expression by flow cytometry.All data from at least two independent experiments with similar results. Error bars depict standard error of mean (SEM).
Fig. 3.
Fig. 3.. PP2A deficiency in glioma cells promote expression of tumor associated antigen (TAA), TAA-specific CD8+ T cell cytotoxicity and DC activation.
(A) BMDC was co cultured with WT or PP2AcKO SB28-OVA with a ratio of 1:5 for 24 hours. Surface expressions of SIINFEKL, CD86, MHC-I, and MHC-II were then determined by flow cytometry. (Diagram created with BioRender.com) (B) BMDC was co cultured with WT or PP2AcKO SB28 using a transwell insert with a ratio of 1:5 for 24 hours. Surface expressions of CD86, MHC-I, and MHC-II were then determined by flow cytometry. (Diagram created with BioRender.com) (C) WT and PP2AcKO SB28-OVA expression of OVA-H2Kb (SIINFEKL) were determined by flow cytometry. (D-F) CD8 T cells were isolated from splenocytes of OT-I mice and then activated by CD3/CD28 beads and IL2 (50 ng/ml) for 72 hours. Activated T cells were then: (E) co-cultured with WT and PP2AcKO SB28-OVA cells using 3 different Effector:Target ratios. After 24 hours, the percentage of dead tumor cells (CD45-DAPI+) were quantified via flow cytometry; (F) co-cultured with WT and PP2AcKO SB28-Ova cells with a E:T ratio of 1:1 for 6 hours in the presence of Brefeldin A (5ug/ml) for the last 5 hours. Intracellular staining was then performed and the percentages of IFNγ+ CD8+ T cells were quantified using flow cytometry. (G) BMDC was co cultured with WT or PP2AcKO SB28 and naïve OT-I CD8 T cells at a ratio of (1:5:1). CD8 T cells were pre-stained with cell trace violet (CTV). 48 hours later, proliferation of CD8 T cells were quantified by analyzing the dilution of CTV using flow cytometry. Division index was calculated using Flowjo software. Representative FACS plots of CTV on CD8+ OT-I T cells. Data are from one experiment representative of at least two independent experiments with similar results. Error bars depict SEM. P values were calculated by unpaired t-test (**P<0.01, ***P<0.001, ****P<0.0001).
Fig. 4.
Fig. 4.. PP2A deficiency enhances survival of glioma tumor bearing mice and sensitizes checkpoint therapy.
(A) C57BL/6 mice were inoculated with 3 × 10⁴ WT or PP2AcKO SB28 cells in the brain. (n=18–19). Cumulative survival over time. (B) C57BL/6 mice were inoculated with 5 × 10⁴ WT or PP2AcKO GL261 cells in the brain. (n=9–10). Cumulative survival over time. (C) At survival endpoint, WT or PP2AcKO SB28 tumors were harvested, and histological analysis performed staining for CD8 (red) and nucleus (DAPI, blue). Scale bar, 10 μm. 9 total regions from 2 tumor samples were used for quantification. (D) C57BL/6 mice were treated with anti-CD8 (clone 2.43) depletion antibody or isotype control (rat IgG2B). Mice were given 250 μg i.p. on day −3, −2, −1 then inoculated with 3×10⁴ WT or PP2AKO SB28 cells in the brain (day 0). Depleting antibody or isotype was then given 2x/week until endpoint. (n=9–10). Cumulative survival over time. (E) C57BL/6 mice were inoculated with 3×10⁴ WT or PP2AcKO SB28 cells in the brain. On day 0, mice were randomized to treatment with isotype (mouse IgG1) or anti-IFNAR(MAR1-5A3) blocking antibody (200µg/mouse). Treatment was continued 2x/week until end point (n=8–10). Cumulative survival over time. (F) At survival endpoint, WT or PP2AcKO SB28 tumors treated with isotype or anti-IFNAR were harvested, and histological analysis performed staining for CALR (red) and nucleus (DAPI, blue). Scale bar, 20 μm. 3 regions from each sample and 3 tumor samples were used for quantification. MFI of the red channel was used to quantify CALR staining. (G) C57BL/6 mice were inoculated with 3×10⁴ WT or PP2AcKO SB28 cells in the brain. At day 5, mice were randomized to treatment with isotype (hamster IgG + rat IgG2a) or anti-PD1(RMP1-14) + anti-CTLA4 (9H10) blocking antibody (250µg/mouse, 2x/week for 5 weeks). Cumulative survival over time. (H) C57BL/6 mice inoculated with PP2AcKO SB28 tumors and cured by treatment with anti-PD1+anti-CTLA4 were rechallenged by subcutaneous injection of 6×10⁵ WT and PP2AcKO SB28 tumors in the left and right flank respectively. Naïve C57BL/6 mice were used as control. Tumor volume of both WT and PP2AcKO SB28 were measured 20 days after implantation in naïve and cured mice. Tumors were harvested and photographed. No tumor was grossly noted in cured mice re-challenged with PP2AcKO SB28 tumors. Wilcoxon rank tests were used for survival analysis. Error bars depict SEM. P values were calculated by unpaired t-test for (C-D) and one-way ANOVA with Tukey’s multiple comparison test for (H). (*< 0.05, **P<0.01, ***P<0.001, ****P<0.0001). Data are from two experiments and combined in (A). Data are representative of one independent experiment (B-H).
Fig. 5.
Fig. 5.. PP2Ac deficiency promotes cytoplasmic DNA accumulation and cGAS-STING activation.
(A-B) Whole exome sequencing (WES) was performed on WT and PP2AcKO SB28 cells. Total number of non-synonymous somatic mutations (left) and missense mutations (right) were quantified. (B) Numbers of predicted neoepitopes for MHC-I and MHC-II binding. (C-D) Unrepaired double stranded DNA breaks in the nucleus of WT and PP2AcKO SB28 cells were assessed by: (C) immunofluorescence staining for phosphorylated γH2x (red) and nucleus (DAPI), blue). 15 cells were randomly chosen for quantification. Scale bar, 10 μm; and (D) immunoblotting for protein expression of phosphorylated γH2x in whole cell lysate. (E) Cytoplasmic extract was collected from WT or PP2AKO SB28, GL261 and D425 cells. Double-stranded DNA (dsDNA) normalized to 106 live cells were quantified. (F) WT and PP2AcKO SB28 cells underwent immunofluorescence staining for dsDNA(red) and nucleus (DAPI), blue. Scale bar, 20 μm. (G) Whole cell lysate was collected from WT or PP2AKO SB28, GL261 and D425 cells and cGAMP level measured with ELISA. (H) WT, PP2AcKO, cGASKO and PP2AcKO cGASKO dKO SB28 protein expression of pSTAT1 and pIRF3 were analyzed by immunoblotting. (I) WT, PP2AcKO, cGASKO and PP2AcKO cGASKO dKO SB28 expression of IFN-related genes, MHC-I components and antigen-presenting machinery genes were measured via RT-qPCR. P values indicate comparison between cGASKO and PP2Ac+cGAS dKO. (J) WT and PP2AcKO SB28 cells were radiated with the indicated dose. 24 hours later, cytoplasmic extract was collected and dsDNA/106 live cells were measured. (K) C57BL/6 mice were inoculated with 3×10⁴ WT or PP2AcKO SB28 cells in the brain. At day 4, mice were randomized to sham or focal brain radiation (4Gy on day 4 and day 5 for a total dose of 8Gy). (n=9–10). Cumulative survival over time. Wilcoxon rank tests were used for survival analysis. Error bars depict SEM. P values were calculated by unpaired t-test (**P<0.01, ***P<0.001, ****P<0.0001) for (A,B,C,E,G) and by unpaired one-way ANOVA with Tukey’s multiple comparison test for (I-J). Data are representative of at least two independent experiments with similar results for (C-J). Data are representative of one experiment in (K).
Fig. 6.
Fig. 6.. scRNA-seq analysis reveals tumor-specific PP2Ac deficiency remodeled immune compartment of the tumor microenvironment.
C57BL/6 mice were inoculated with 3×10⁴ WT or PP2AcKO SB28 cells in the brain. On day 18 after implantation, tumors were harvested and 3 mice per group were pooled and analyzed by scRNA-seq. (A) Uniform manifold approximation and projection (UMAP) analyses were performed on 15,448 cells. Expression of GFP and CD45 identify tumor and immune cells respectively. (B) Glioma-specific PP2Ac KO significantly remodeled both tumor and immune compartments. (C) Canonical markers were then used to identified major immune population. The frequencies of NK (NKG7+, CD3-), CD8 (CD8+, CD3+) and cDC1 (CD11c+, CD103+) cells among all sequenced cells were compared between WT and PP2AcKO tumors. (D) Volcano plots showing DEGs (−log10(adjusted P) > 20, log2(FC) > 0.5 or < −0.5, colored in red) in TAMs between WT and PP2AcKO tumors. (E) GO Pathway enrichment analysis performed using upregulated DEGs in TAMs and DCs from PP2AcKO versus WT SB28. The top 7 enriched biological processes for upregulated DEGs ranked by fold enrichment are shown. * indicate p-value of individual pathway. P value adjustment was performed using Bonferroni correction. (F) UMAP plot of TAMs and DC comparing expression levels of IRF7 (IFN- response element), H2-Aa (MHC class I) and CD206 (marker of “M2”-like immunosuppressive TAMs) between WT and PP2AcKO SB28 tumors. (G) UMAP plots showing the expression of key signature genes that are differential between the various TAM subsets. (H) Overview of TAM subsets: (16) m-MDSC derived macrophage; (11) classical monocyte; (14) and (13) microglia; (0) IFN BMDM. (I)The fold change in frequency of the 5 TAMs clusters between WT and PP2AcKO SB28 tumors. (J) Heatmap of Normalized Enrichment Score (NES) from GSEA identifying pathway enrichment by each TAM cluster.
Fig. 7.
Fig. 7.. scRNA-seq analysis reveals tumor-specific PP2Ac deficiency remodeled immune compartment of the tumor microenvironment.
(A) Volcano plots showing DEGs (−log10(adjusted P) > 20, log2(FC) > 0.5 or < −0.5, colored in red) in GFP+ SB28 cells between WT and PP2AcKO tumors. Pseudovalue 1e−300 were added to adjusted P to avoid 0 before log-transformation. (B) GO Pathway enrichment analysis performed using upregulated DEGs in glioma cells from PP2AcKO versus WT SB28 tumors. The top 7 enriched biological processes for upregulated DEGs ranked by fold enrichment are shown. * indicate p-value of individual pathway. P value adjustment was performed using Bonferroni correction. (C) UMAP plot of glioma cells comparing expression levels of ISG15 (IFN- response element), H2-D1 (MHC class I) and TAP1 (MHC-I loading machinery) between WT and PP2AcKO SB28 tumors. (D) The fold change in frequency of the glioma clusters between WT and PP2AcKO SB28 tumors. (E) Heatmap of Normalized Enrichment Score (NES) from GSEA identifying pathway enrichment by each tumor cluster with altered frequency between WT and PP2AcKO SB28. (F) Average expression level of PP2ADN gene signature (down regulated DEGs in glioma cells in (a)) is higher in high grade glioma (n=171) compared to low grade glioma (n=530) from TCGA dataset. P value was calculated by unpaired t-test (****P<0.0001). (G) Average expression level of PP2ADN gene signature is associated with worse survival in patients with glioma (LGG+GBM) using TCGA bulk RNAseq dataset. Q4 represent patients with highest quartile of average expression and Q1 with lowest quartile of average expression. Mantel-Cox log-rank tests were used for survival analysis. (****P<0.0001)

References

    1. . Tamimi AF, Juweid M. Epidemiology and Outcome of Glioblastoma [Internet]. Glioblastoma 2017. Available from: http://www.ncbi.nlm.nih.gov/pubmed/29251870 - PubMed
    1. Reardon DA, Brandes AA, Omuro A, Mulholland P, Lim M, Wick A, et al. Effect of Nivolumab vs Bevacizumab in Patients with Recurrent Glioblastoma: The CheckMate 143 Phase 3 Randomized Clinical Trial. JAMA Oncol American Medical Association; 2020;6:1003–10. - PMC - PubMed
    1. Lim M, Weller M, Idbaih A, Steinbach J, Finocchiaro G, Raval RR, et al. Phase 3 Trial of Chemoradiotherapy With Temozolomide Plus Nivolumab or Placebo for Newly Diagnosed Glioblastoma With Methylated MGMT Promoter. Neuro Oncol 2022; - PMC - PubMed
    1. Yeung JT, Hamilton RL, Ohnishi K, Ikeura M, Potter DM, Nikiforova MN, et al. LOH in the HLA class I region at 6p21 is associated with shorter survival in newly diagnosed adult glioblastoma. Clinical Cancer Research 2013;19:1816–26. - PMC - PubMed
    1. Wei J, Barr J, Kong L-Y, Wang Y, Wu A, Sharma AK, et al. Glioblastoma cancer-initiating cells inhibit T-cell proliferation and effector responses by the signal transducers and activators of transcription 3 pathway. Mol Cancer Ther 2010;9:67–78. - PMC - PubMed

Publication types