. 2023 Jul 3;133(13):e164637.
doi: 10.1172/JCI164637.

iPSC-derived reactive astrocytes from patients with multiple sclerosis protect cocultured neurons in inflammatory conditions

Affiliations

iPSC-derived reactive astrocytes from patients with multiple sclerosis protect cocultured neurons in inflammatory conditions

Janis Kerkering et al. J Clin Invest. .

Abstract

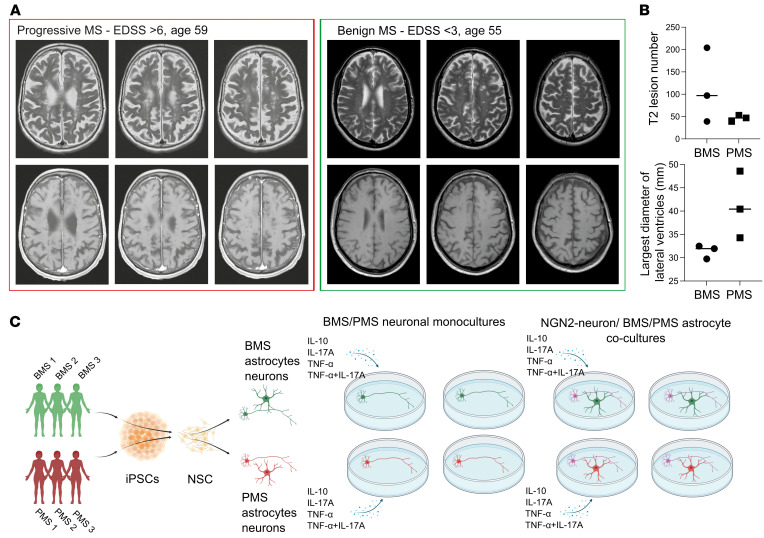
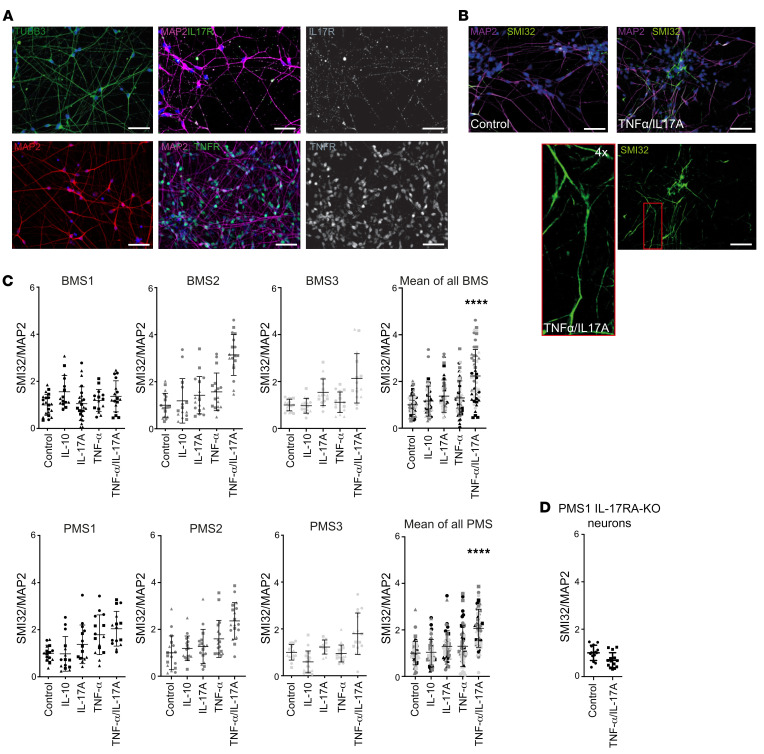
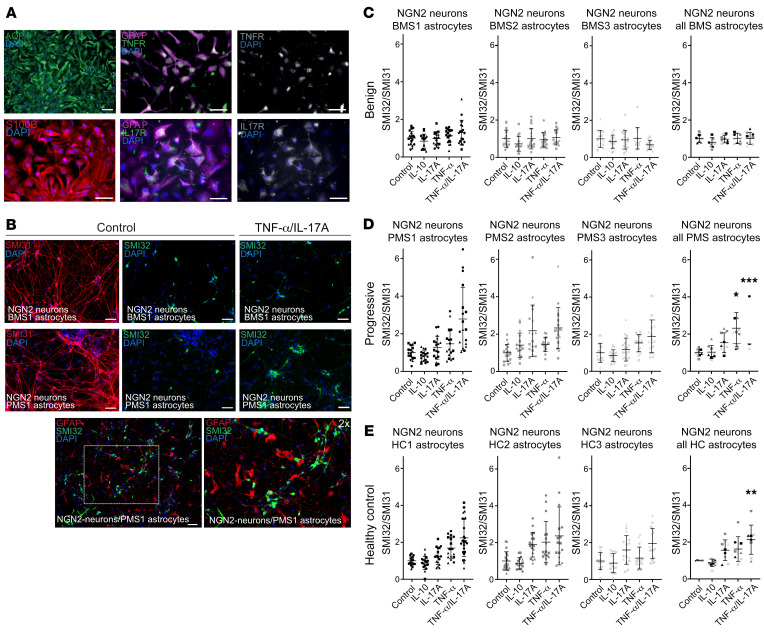
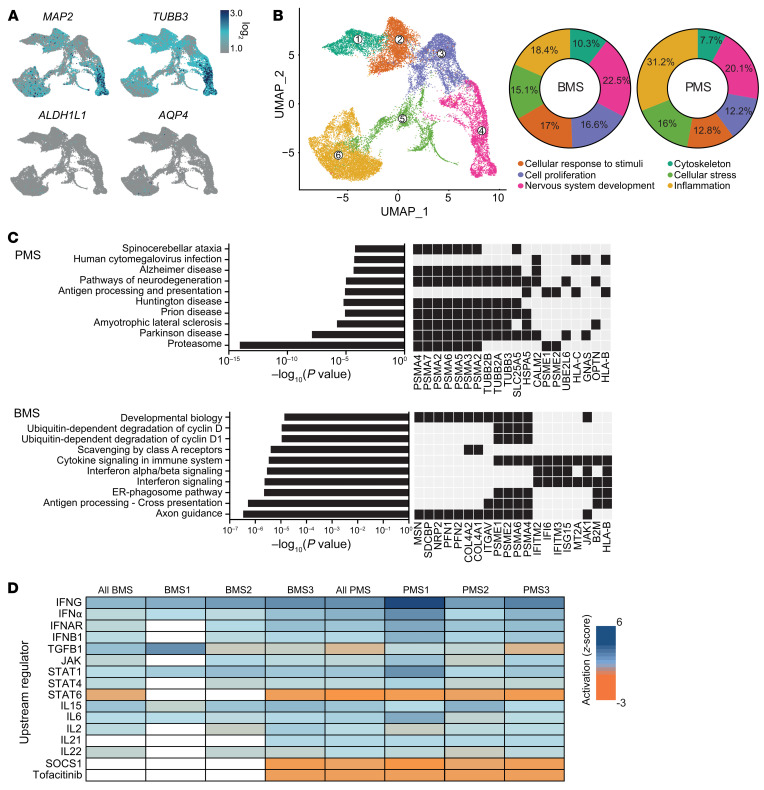
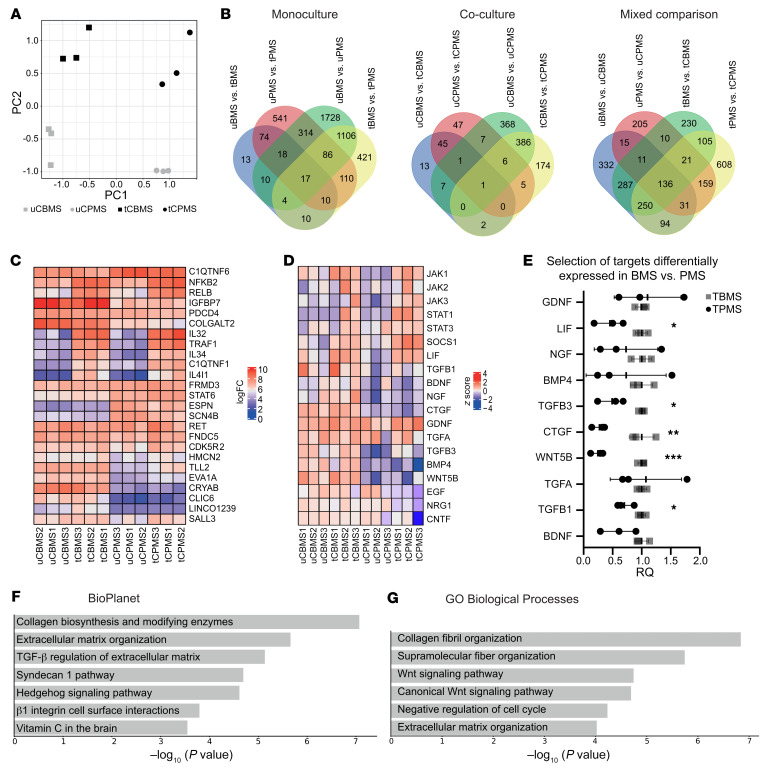
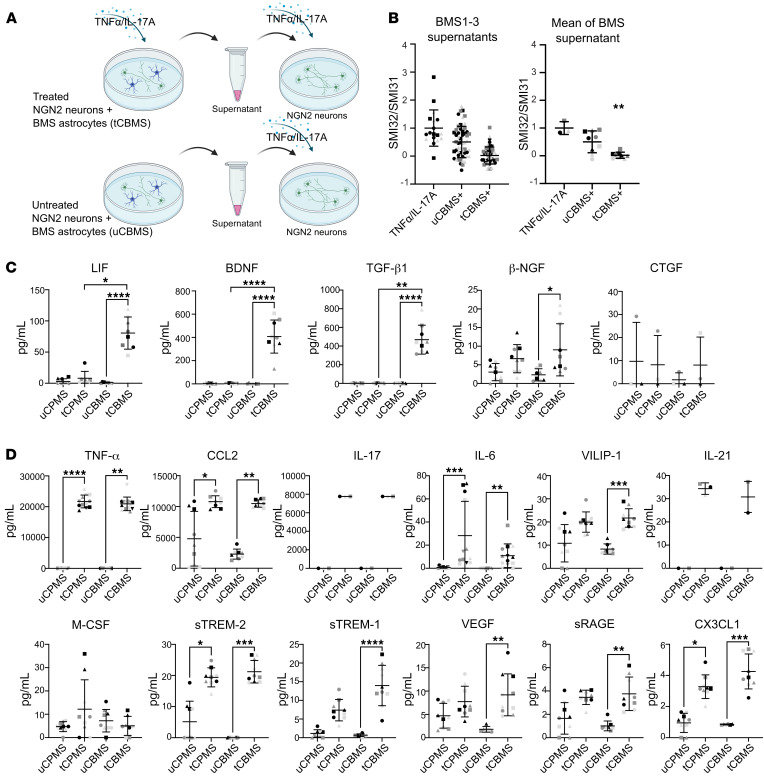
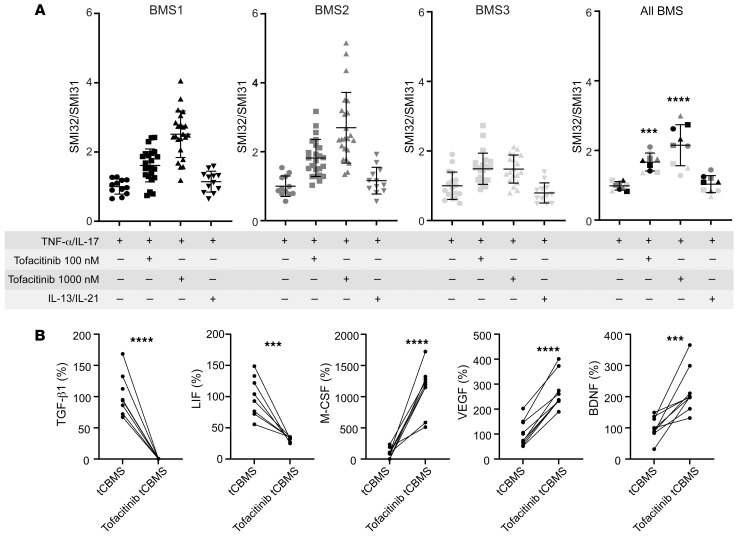
Multiple sclerosis (MS) is the most common chronic central nervous system inflammatory disease. Individual courses are highly variable, with complete remission in some patients and relentless progression in others. We generated induced pluripotent stem cells (iPSCs) to investigate possible mechanisms in benign MS (BMS), compared with progressive MS (PMS). We differentiated neurons and astrocytes that were then stressed with inflammatory cytokines typically associated with MS phenotypes. TNF-α/IL-17A treatment increased neurite damage in MS neurons from both clinical phenotypes. In contrast, TNF-α/IL-17A-reactive BMS astrocytes cultured with healthy control neurons exhibited less axonal damage compared with PMS astrocytes. Accordingly, single-cell transcriptomic BMS astrocyte analysis of cocultured neurons revealed upregulated neuronal resilience pathways; these astrocytes showed differential growth factor expression. Furthermore, supernatants from BMS astrocyte/neuronal cocultures rescued TNF-α/IL-17-induced neurite damage. This process was associated with a unique LIF and TGF-β1 growth factor expression, as induced by TNF-α/IL-17 and JAK-STAT activation. Our findings highlight a potential therapeutic role of modulation of astrocyte phenotypes, generating a neuroprotective milieu. Such effects could prevent permanent neuronal damage.

Keywords: Inflammation; Multiple sclerosis; Neurodegeneration; Stem cells; iPS cells.


Figures

Figure 1
Figure 1. Study overview.
(A) Representative MRI comparing progressive with benign MS, showing comparable T2 hyperintense absolute lesion counts. (B) Lesion count and lateral ventricle maximal diameter of BMS and PMS patients in this study. The absolute tissue loss is increased in PMS as shown by the maximal width of lateral ventricles. (C) Schematic overview of this study.
Figure 2
Figure 2. MS patient neurons without and with exposure to inflammatory cytokines.
(A) Immunofluorescence staining of iPSC-derived neurons. Mature neurons differentiated for 3 weeks stain positive for βIII-tubulin, MAP2, IL-17RA, and TNFR1. Scale bars: 50 μm. (B) Representative images of iPSC-derived neurons treated with TNF-α/IL-17A for 24 hours (50 ng/mL). Cells were fixed and immunofluorescently stained against MAP/SMI32. Scale bars: 50 μm. (C) iPSC-derived neurons were differentiated, and monocultures of neurons were treated with cytokines for 24 hours (50 ng/mL). Immunofluorescently stained MAP/SMI32 neurons were analyzed with ImageJ and are presented as surface ratio of MAP/SMI32 ± SD, normalized to the control. In 5 of 6 neurons the ratio was increased after TNF-α/IL-17A, irrespective of their disease phenotype. (D) CRISPR/Cas9 knockout of IL-17RA in PMS1. No increase of MAP/SMI32 was detectable after TNF-α/IL-17A treatment. Each data point represents a microscopic field of view (641 × 479 μm) of 3 independent experiments depicted by different symbols; pooled data represent the mean from 3 patients and 3 independent experiments. Statistical significance was tested with a Kruskal-Wallis test; ****P < 0.0001.
Figure 3
Figure 3. MS patient astrocytes and cocultures with NGN2 neurons without and with exposure to inflammatory cytokines.
(A) Immunofluorescence staining of iPSC-derived astrocytes. Mature astrocytes differentiated for 6 weeks stain positive for GFAP, s100β, AQP4, IL-17R, and TNFR1. Scale bars: 50 μm. (B) iPSC-derived astrocytes cocultured with NGN2-neurons show close colocalization. Treatment with TNF-α/IL-17A for 24 hours (50 ng/mL) increased SMI32/SMI31 ratio in NGN2-neurons cultured with PMS astrocytes. Scale bars: 50 μm. Immunofluorescently stained SMI32/SMI31 neurons were analyzed with ImageJ and are presented as surface ratio of SMI32/SMI31 ± SD, normalized to the control. (C and D) Neurons in coculture with BMS astrocytes (C) were protected against TNF-α/IL-17A exposure, whereas PMS astrocytes (D) did not show protection against TNF-α and TNF-α/IL-17A. (E) Neurons in coculture with healthy control astrocytes (HC1, HC2, HC3) also showed increased SMI32/SMI31 ratios after TNF-α/IL-17A exposure. Each data point represents a microscopic field of view (641 × 479 μm) of 3 independent experiments depicted by different symbols; pooled data represent the mean from 3 individual patients (different colors) and 3 independent experiments (different symbols). Statistical significance was tested with a Kruskal-Wallis test; *P < 0.05, **P < 0.01, ***P < 0.001.
Figure 4
Figure 4. Single-cell transcriptome analysis of MS patient astrocyte/NGN2 neuron cocultures.
Cells were treated for 24 hours with TNF-α/IL-17A or left untreated (control) and harvested with Accutase. Single-cell suspensions of 6 technical repeats per sample were filtered, and subsamples were labeled with CMOs to allow pooling for multiplexed libraries. (A) UMAP of all cells with projection of expression of MAP2 and TUBB3 (neuronal markers) and ALDH1L1 and AQP4 (astrocyte markers). (B) UMAP and pie chart to analyze the proportional distribution of cells in the color-coded subclusters, which were named according to the most prevalent defining genes (ranked by log2 fold change) and their prospective function. Neurons of PMS cultures were found to be higher in the inflammation cluster compared with BMS. (C) Enrichr analysis of KEGG 2021 and Reactome 2016 pathways comparing PMS and BMS. A black box represents the presence of a gene. (D) IPA analysis comparing samples according to potential upstream mediators (short list; for complete analysis see Supplemental Table 1). The z score represents the activation score of a predicted regulator based on the expression of the input genes; a positive score represents an activation and a negative score an inhibition. Each column of BMS or PMS represents the data set of 1 experiment (TNF-α/IL-17A treated vs. control); “all BMS” and “all PMS” are the mean of samples BMS1–BMS3 or PMS1–PMS3, respectively. The analysis predicted a JAK/STAT activation and a negative score for tofacitinib in all PMS samples.
Figure 5
Figure 5. Bulk transcriptome analysis of MS patient astrocytes from monocultures and cocultures with NGN2 neurons.
Cells were treated for 24 hours with TNF-α/IL-17A or left untreated (control). Neurons were washed off, and remaining astrocytes were used for further processing. (A) PCA plot of bulk RNA-Seq of coculture-derived astrocytes shows distinct segregation of samples according to patient group (PC1) and according to cytokine treatment versus control (PC2). (B) Venn chart representing shared and unique genes comparing mono- and coculture-derived astrocytes. (C) Heatmap showing the top 25 regulated genes ranked by the adjusted P value. (D) Heatmap representing expression of genes encoding neurotrophic and JAK/STAT–related factors. The z score was calculated including all 12 samples. (E) Reverse transcriptase qPCR of selected targets confirmed differentially expressed genes between BMS and PMS after treatment. Statistical significance was tested with an unpaired 2-tailed t test; *P < 0.05, **P < 0.01, ***P < 0.001. (F and G) Enrichr analysis of activated pathways (F) and Gene Ontology (GO) labels of biological processes (G) comparing tCBMS versus tCPMS.
Figure 6
Figure 6. Supernatant analysis of MS patient astrocyte/NGN2-neuron cocultures.
(A) Supernatants of TNF-α/IL-17A–treated and untreated NGN2 and BMS astrocytes were collected after 24 hours of stimulation and applied on monocultures of TNF-α/IL-17A–preincubated NGN2-neurons. (B) NGN2-neurons were treated with TNF-α/IL-17A (50 ng/mL) for 24 hours (represented by “+”), and medium was replaced with untreated or treated coculture supernatants. Each data point represents a microscopic field of view (641 × 479 μm) of 3 independent experiments depicted by different symbols; pooled data show the mean from 3 patients (different colors) and 3 independent experiments (different symbols). Neurons showed protection when given supernatants of treated BMS cocultures. “+” represents an arbitrary proportion of the target in tBMS compared with tPMS; “=” indicates an equal level. (C and D) Bead-based multiplex assay and ELISA (CTGF) analysis of supernatants. LIF, BDNF, and TGF-β1 concentrations were significantly higher in tCBMS than in tCPMS. Each data point represents 1 sample collectively of 3 individual patients (different colors) and 3 independent experiments (different symbols). Statistical significance was tested with a Kruskal-Wallis test; *P < 0.05, **P < 0.01, ***P < 0.001, ****P < 0.0001.
Figure 7
Figure 7. Blocking JAK/STAT with tofacitinib in MS patient astrocyte/NGN2-neuron cocultures.
(A) iPSC-derived astrocytes cocultured with NGN2-neurons were treated with tofacitinib (100/1,000 nM) or IL-13 plus IL-21 (50 ng/mL each) for 24 hours, followed by a treatment with TNF-α/IL-17A (50 ng/mL) for 24 hours. Inhibition of JAK/STAT by tofacitinib led to failed neurite protection, as shown by an increase in SMI32/SMI31 ratio. Immunofluorescently stained SMI32/SMI31 neurons were analyzed with Imaris (Bitplane) and presented as surface ratio of SMI32/SMI31 ± SD, normalized to the control. Each data point represents a microscopic field of view (641 × 479 μm) of 3 independent experiments (different symbols); pooled data represent the mean from 3 individual patients (different colors) and 3 independent experiments (different symbols). Statistical significance was tested with a Kruskal-Wallis test; ***P < 0.001, ****P < 0.0001. (B) Supernatants of tofacitinib-treated samples were collected after the cytokine stimulation period of 24 hours. Relative changes of cytokine concentration in tofacitinib-treated versus control cocultures were analyzed. LIF and TGF-β1 levels were decreased, whereas M-CSF, VEGF, and BDNF were increased. Changes are displayed in percentage compared with (control) tCBMS (100%); each data point represents a single supernatant measurement. Statistical significance was tested with a Mann-Whitney U test; ***P < 0.001, ****P < 0.0001.

References

    1. Winkelmann A, et al. Disease-modifying therapies and infectious risks in multiple sclerosis. Nat Rev Neurol. 2016;12(4):217–233. doi: 10.1038/nrneurol.2016.21. - DOI - PubMed
    1. Elliott C, et al. Chronic white matter lesion activity predicts clinical progression in primary progressive multiple sclerosis. Brain. 2019;142(9):2787–2799. doi: 10.1093/brain/awz212. - DOI - PMC - PubMed
    1. Luchetti S, et al. Progressive multiple sclerosis patients show substantial lesion activity that correlates with clinical disease severity and sex: a retrospective autopsy cohort analysis. Acta Neuropathol. 2018;135(4):511–528. doi: 10.1007/s00401-018-1818-y. - DOI - PMC - PubMed
    1. Thompson AJ, et al. Charting a global research strategy for progressive MS—an international progressive MS Alliance proposal. Mult Scler. 2022;28(1):16–28. doi: 10.1177/13524585211059766. - DOI - PMC - PubMed
    1. Brosnan CF, Raine CS. The astrocyte in multiple sclerosis revisited. Glia. 2013;61(4):453–465. doi: 10.1002/glia.22443. - DOI - PubMed

Publication types

MeSH terms

Substances