. 2023 Jul 3;133(13):e166070.
doi: 10.1172/JCI166070.

Tumor-activated lymph node fibroblasts suppress T cell function in diffuse large B cell lymphoma

Affiliations

Tumor-activated lymph node fibroblasts suppress T cell function in diffuse large B cell lymphoma

Benedetta Apollonio et al. J Clin Invest. .

Abstract

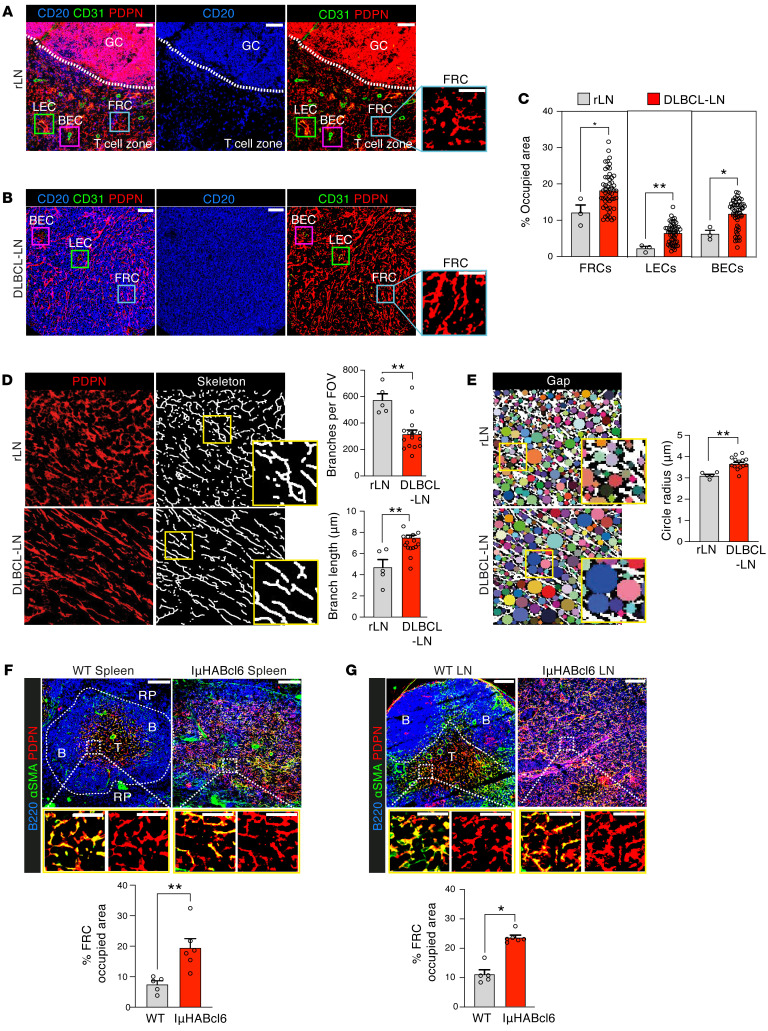
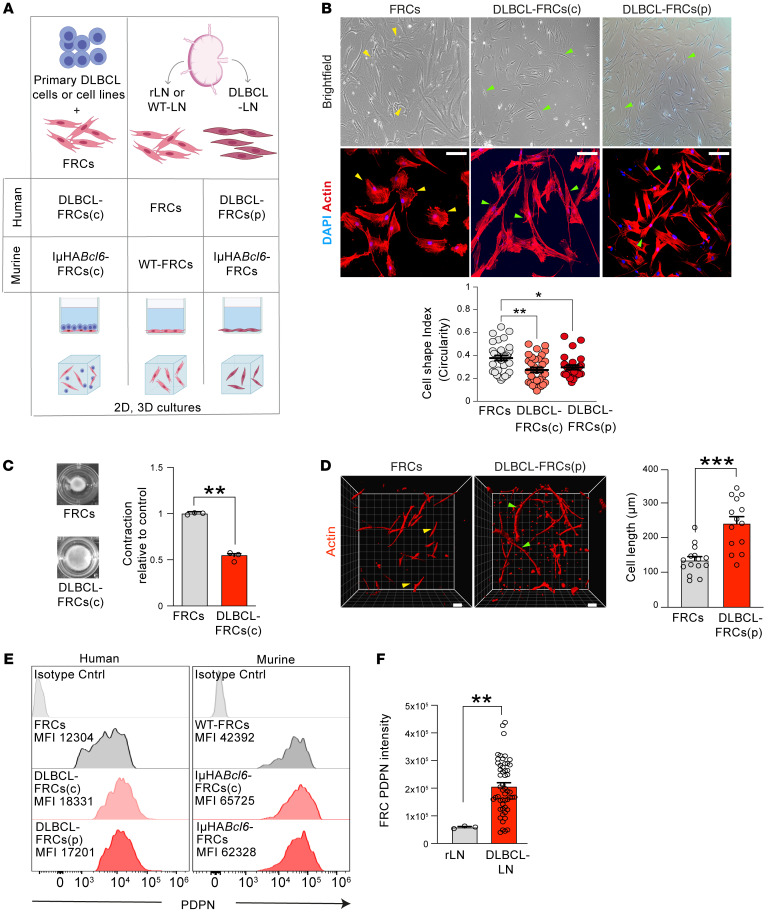
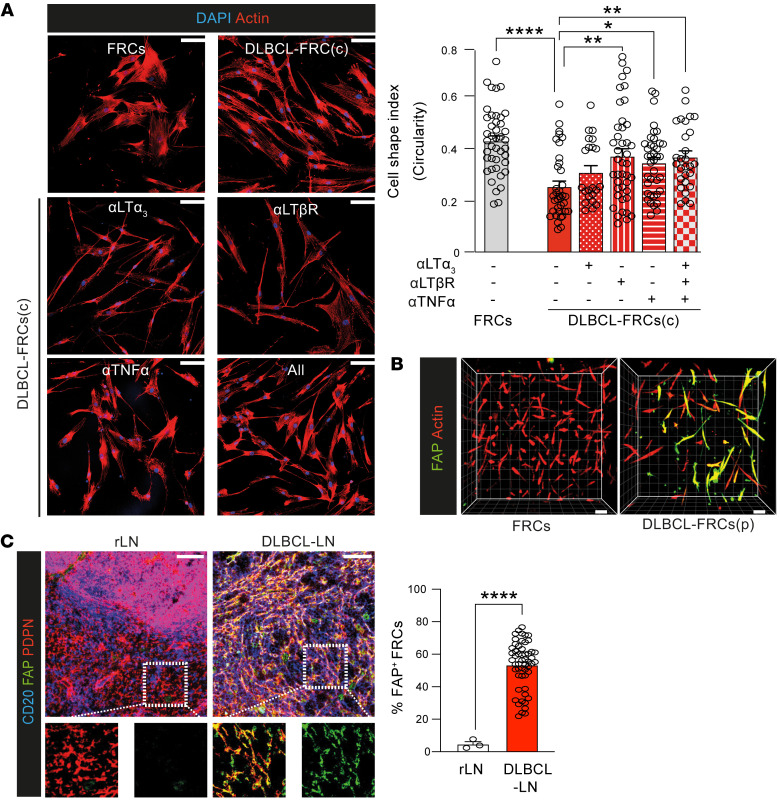
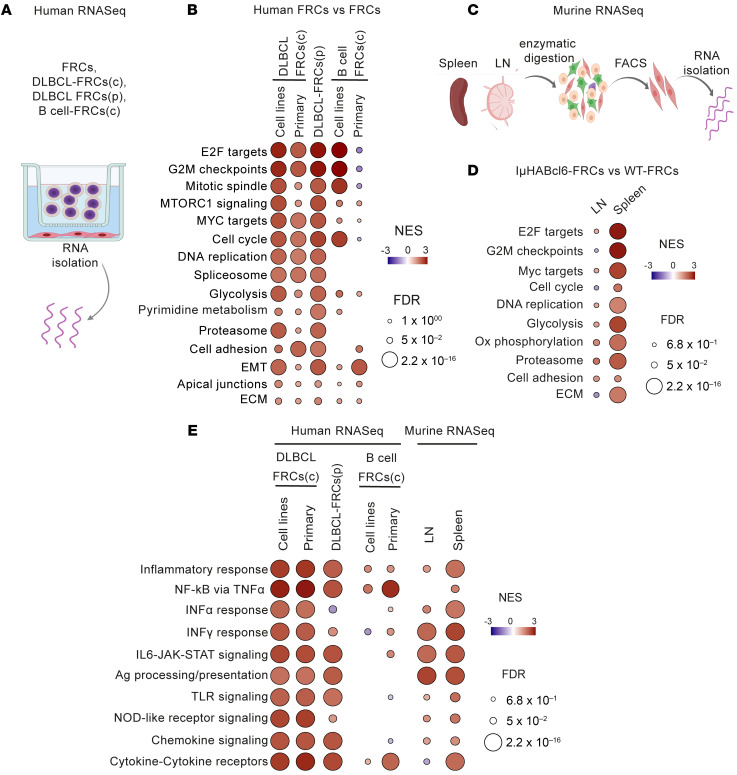
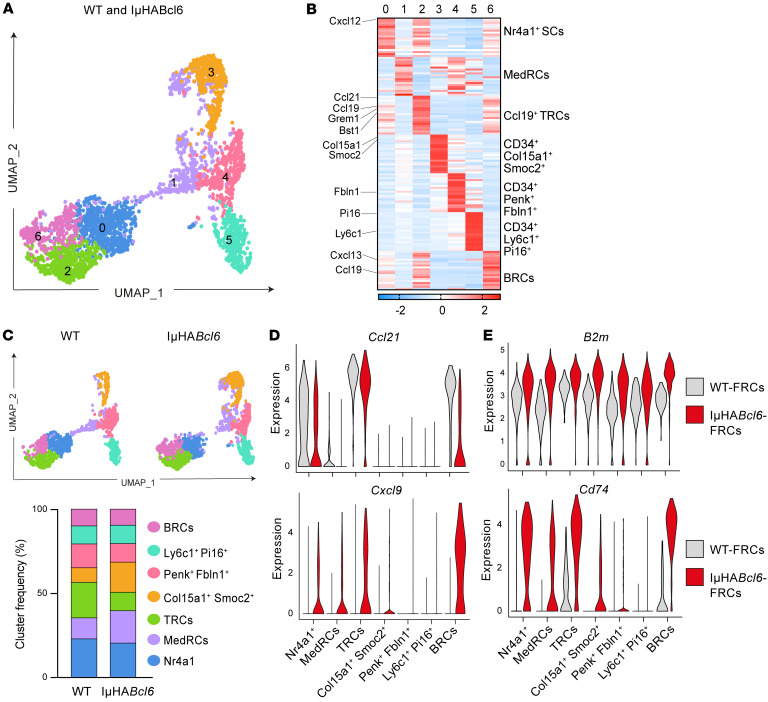
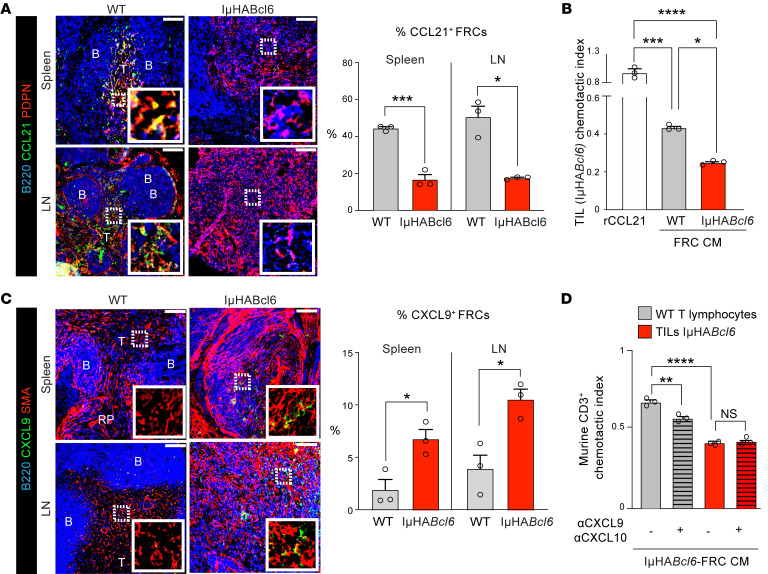
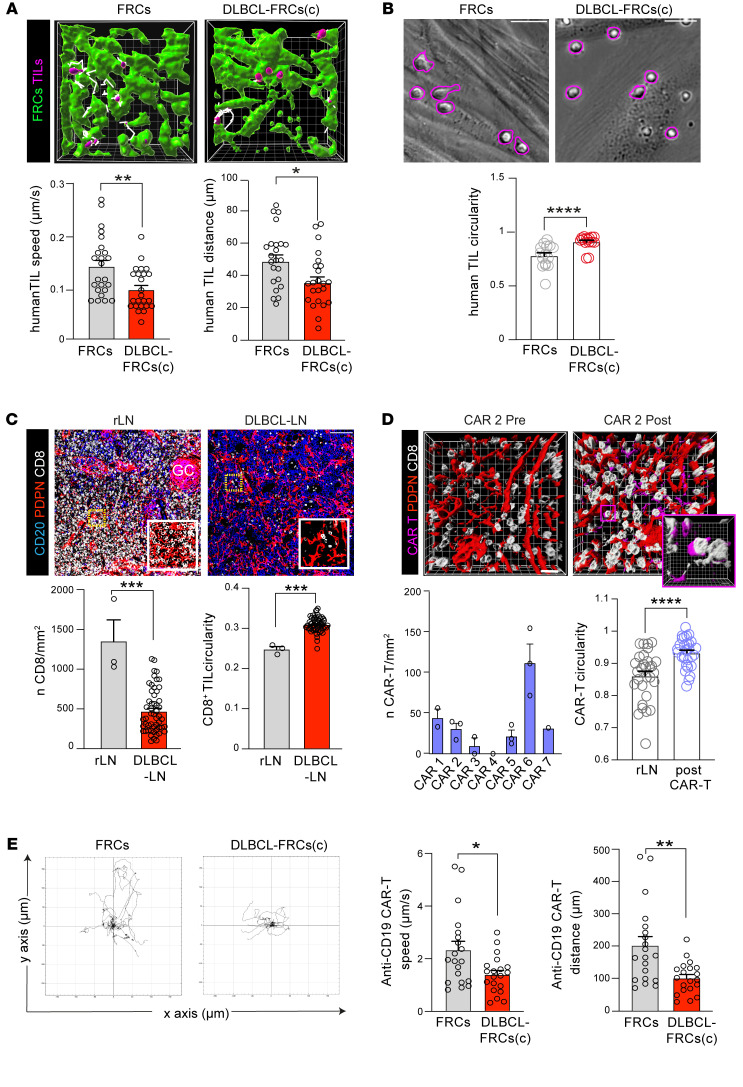
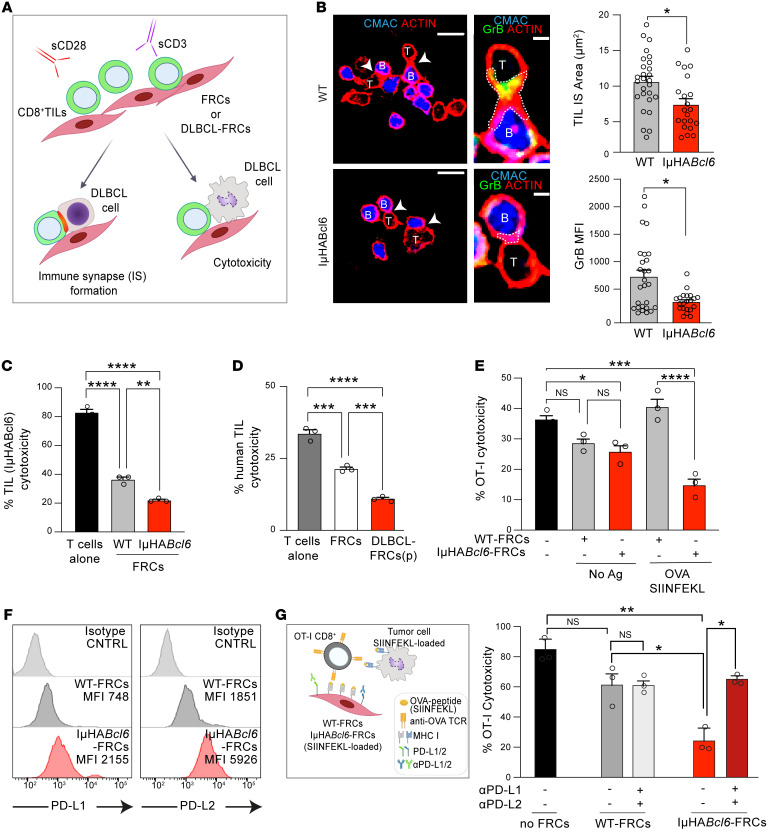
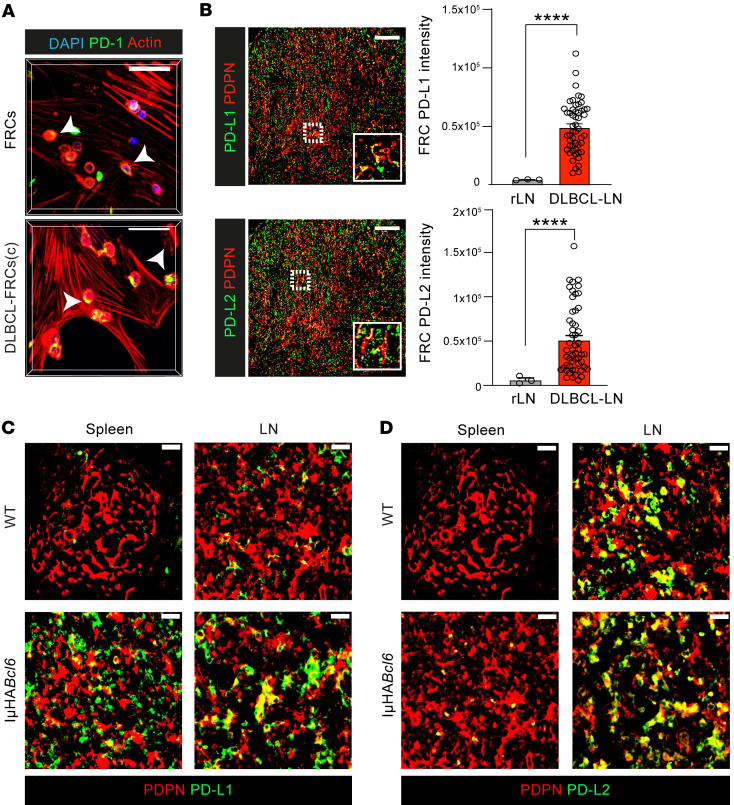
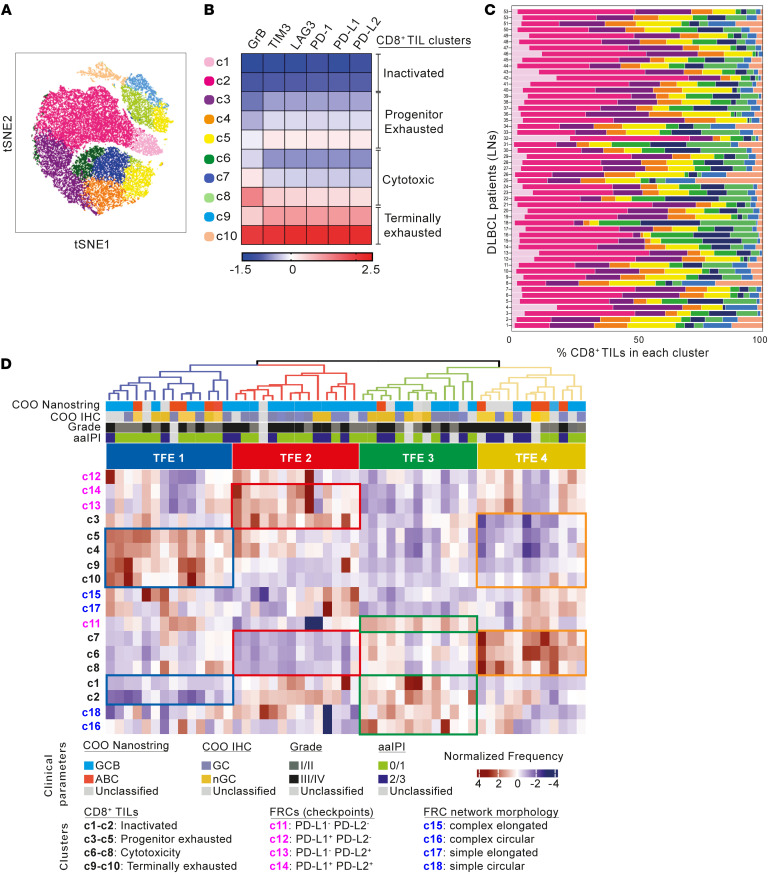
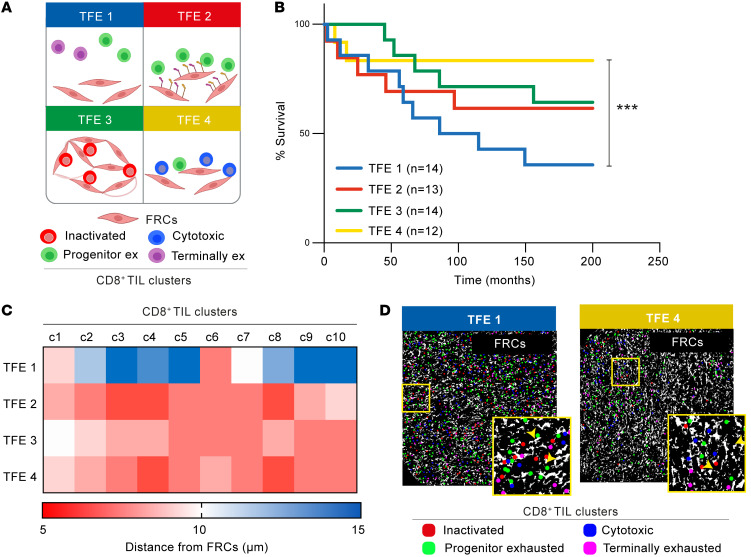
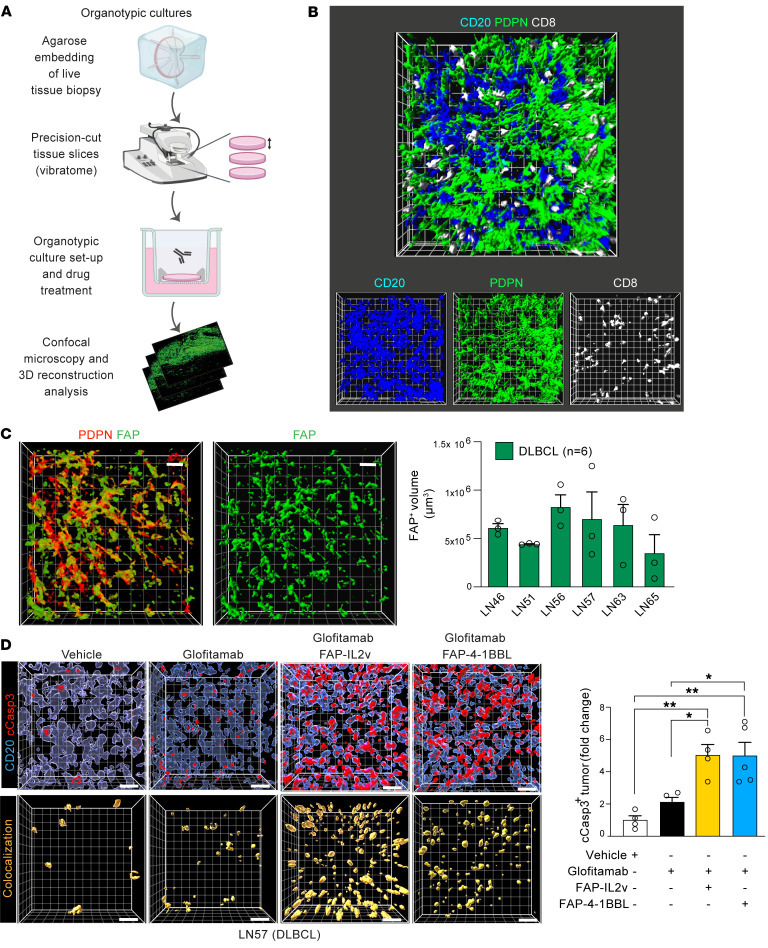
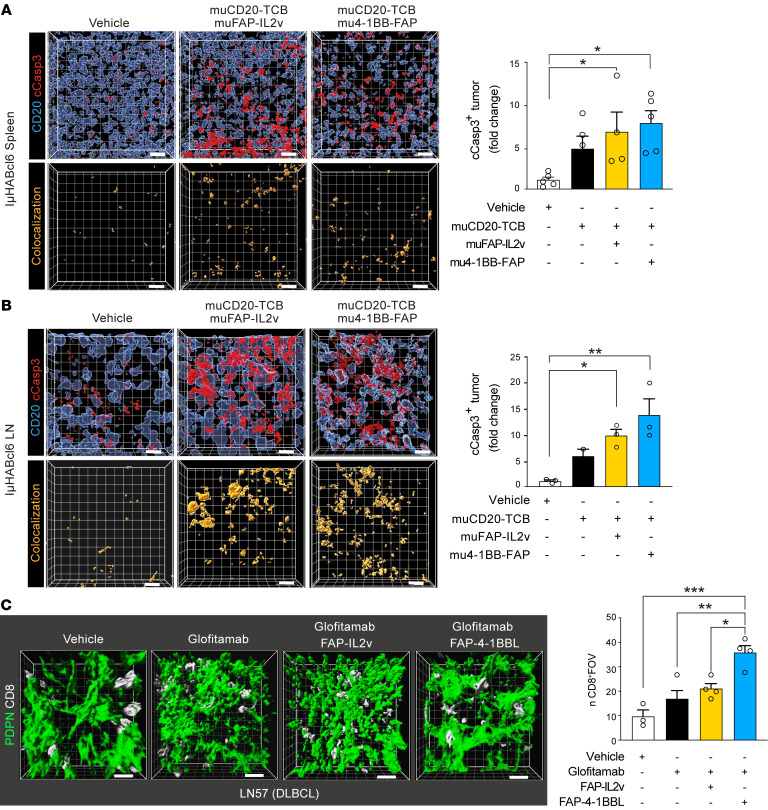
Recent transcriptomic-based analysis of diffuse large B cell lymphoma (DLBCL) has highlighted the clinical relevance of LN fibroblast and tumor-infiltrating lymphocyte (TIL) signatures within the tumor microenvironment (TME). However, the immunomodulatory role of fibroblasts in lymphoma remains unclear. Here, by studying human and mouse DLBCL-LNs, we identified the presence of an aberrantly remodeled fibroblastic reticular cell (FRC) network expressing elevated fibroblast-activated protein (FAP). RNA-Seq analyses revealed that exposure to DLBCL reprogrammed key immunoregulatory pathways in FRCs, including a switch from homeostatic to inflammatory chemokine expression and elevated antigen-presentation molecules. Functional assays showed that DLBCL-activated FRCs (DLBCL-FRCs) hindered optimal TIL and chimeric antigen receptor (CAR) T cell migration. Moreover, DLBCL-FRCs inhibited CD8+ TIL cytotoxicity in an antigen-specific manner. Notably, the interrogation of patient LNs with imaging mass cytometry identified distinct environments differing in their CD8+ TIL-FRC composition and spatial organization that associated with survival outcomes. We further demonstrated the potential to target inhibitory FRCs to rejuvenate interacting TILs. Cotreating organotypic cultures with FAP-targeted immunostimulatory drugs and a bispecific antibody (glofitamab) augmented antilymphoma TIL cytotoxicity. Our study reveals an immunosuppressive role of FRCs in DLBCL, with implications for immune evasion, disease pathogenesis, and optimizing immunotherapy for patients.

Keywords: Cancer immunotherapy; Immunology; Lymphomas; Oncology.


Conflict of interest statement

Conflict of interest: MB, CC, PU, and CK are employees of Roche with stock ownership and patents: Bispecific activating antigen binding molecules, #WO2016020309A1 (CK, PU, MB); Antigen binding molecules comprising a TNF family ligand trimer, #WO2016075278 (CK, PU, CC); Novel immunoconjugates, #WO2012146628 (CK, PU); Combination therapy with targeted 4-1BB (CD137) agonists; #WO2018114754 (MB, CC, CK, PU); Combination therapy of anti-20/anti-CD3 bispecific antibodies and 4-1BB (CD137) agonists, #WO2018114748 (MB, CK, PU). PRH and AKG are employees of Bristol-Myers Squibb and have equity ownership. PRH also holds a patent: Cycling therapy using 3-(5-amino-2-methyl-4-oxo-4H-quinazolin-3-yl)-piperidine-2,6-dione, #10,159,675 (PRH). AGR received research support from Roche Glycart AG and Bristol-Myers Squibb.

Figures

Figure 1
Figure 1. Aberrantly remodeled FRCs in human and murine DLBCL.
(A and B) Representative IMC staining of B cells (CD20) and the LN stromal population FRCs (higher magnification insets), BECs, and LECs (CD31, PDPN) in (A) rLN (n = 3) and (B) DLBCL-LN TMA (n = 53). Scale bars: 100 μm. (C) Area occupied by FRCs, LECs, and BECs in rLN (n = 3) and DLBCL-LN tissues (n = 53) (IMC). Two distinct biopsy cores per patient sample (data points). (D) PDPN+ FRCs in rLN (n = 5) and DLBCL-LNs (n = 15) examined using skeleton analysis. Left, original PDPN signal; right, skeletonized images. Quantification of the mean number of branches and lengths per field of view. (E) Binary images of PDPN staining for gap analysis (colored circles) of the FRC network in rLN (n = 5) and DLBCL-LNs (n = 15). Gap (circle) radii analysis. Original magnification, ×20. (F and G) Representative confocal analysis of the FRC network in the spleens (F) and LNs (G) of WT and IμHABcl6 lymphoma mice. Scale bars: 100 μm (upper panels); 50 μm (lower panels). B, B cell zone; T, T cell zone; RP, red pulp. Area occupied analysis of PDPN+ FRCs in spleen (F) and LN tissue images (G) from WT (n = 5) and lymphoma IμHABcl6 (n = 6) mice. Data are represented as mean ± SEM (CG). *P < 0.05; **P < 0.01, Mann-Whitney U test (CG).
Figure 2
Figure 2. Coculture models recapitulate remodeled DLBCL-FRCs.
(A) Schematic of 2D and 3D DLBCL-FRC crosstalk cultures. Primary FRCs were conditioned with DLBCL cell lines (5 days) or with primary DLBCL B cells (3 days) (human, DLBCL-FRCs[c]; murine, IμHABcl6-FRCs[c]). Primary FRCs were isolated from rLNs (human, FRCs; murine, WT-FRCs) or from DLBCL-LN patient biopsies (human, DLBCL-FRCs[p]); murine IμHABcl6-FRCs). (B) Representative brightfield (top), confocal images (bottom), and analysis (dot plot) of FRCs (n = 6), DLBCL-FRCs(c) (conditioned with primary DLBCL cells, n = 6 patients), and DLBCL-FRCs(p) (n = 2 patients) (ABC and GCB). Scale bars: 10 μm. (C) 3D contraction assays for FRCs and DLBCL-FRCs(c) (SU-DHL16). Brightfield gel images at 3 days. (D) 3D images and length analysis of FRCs (n = 3) and DLBCL-FRCs(p) (n = 2 patients, ABC and GCB). Scale bars: 10 μm. (E) PDPN expression histograms. Left, FRCs (gray, n = 3), DLBCL-FRCs(c) (primary DLBCL cells, light red, n = 3 patients) and DLBCL-FRCs(p) (dark red, n = 3 patients, 1 ABC and 2 GCB). Right, WT-FRCs (gray, n = 3), IμHABcl6-FRCs(c) (light red, n = 3), and IμHABcl6-FRCs (dark red, n = 3). (F) IMC quantification of PDPN expression on FRCs from rLN (n = 3) and DLBCL-LNs (n = 53). (D) Representative data from n = 3 independent experiments. Data are represented as mean ± SEM (B, C, D, and F). *P < 0.05; **P < 0.01; ***P < 0.001, 1-way ANOVA with Tukey’s test (B) or Mann-Whitney U test (C, D, and F).
Figure 3
Figure 3. DLBCL-FRCs express elevated CAF marker FAP.
(A) Cell-shape analysis of FRCs and DLBCL-FRCs(c) (SU-DHL16) treated with isotype or blocking/neutralizing antibodies. Scale bars: 10 μm, Right, quantification. (B) 3D images of FRC and DLBCL-FRC(p) gels stained as indicated. Scale bars: 10 μm. (C) IMC images of rLN (n = 3, same representative tissue presented in Figure 1A) and DLBCL-LNs (n = 53) stained for CD20 (B cells), PDPN (FRCs), and FAP. Scale bars: 100 μm. Frequency of FAP+ FRCs quantified using IMC. (A) Representative data from n = 3 independent experiments. Data are represented as mean ± SEM (A and C). *P < 0.05; **P < 0.01; ****P <.0001, 1-way ANOVA with Tukey’s test (A) or Mann-Whitney U test (C).
Figure 4
Figure 4. DLBCL B cells reprogram FRCs into an activated state.
(A) Experimental strategy for human bulk RNA-Seq. RNA was extracted from FRCs (n = 3), DLBCL-FRCs(c) cocultured with DLBCL cell lines (n = 8), or primary DLBCL B cells (n = 4 patients) and B cell–FRCs(c) cocultured with B cell lines (n = 3) or primary rLN-derived B cells (n = 3) for 48 hours using Transwell. In parallel, RNA was extracted from DLBCL-FRCs(p) (n = 2 patients). (B) GSEA fibroblast activation pathways in human DLBCL-FRCs(c) or DLBCL-FRCs(p) versus FRCs. (C) Murine low-input bulk RNA-Seq workflow. Spleens and LNs from IμHABcl6 (n = 3, n = 7 respectively) and WT mice (n = 6, n = 5 respectively) were processed for FRC isolation (FACS). (D) GSEA fibroblast activation pathways in IμHABcl6-FRCs versus WT-FRCs from spleen and LNs. (E) GSEA immunologically relevant pathways in human and murine bulk gene expression profiles. Circle colors depict the normalized enrichment score (NES) and FDR.
Figure 5
Figure 5. scRNA-Seq of murine DLBCL-FRCs reveals altered chemokine and antigen-presentation gene pathways.
(A) UMAP of scRNA-Seq data generated from FACS-sorted LN stromal cells for WT-FRCs (1,408 cells) and IμHABcl6-FRCs (1,422 cells). Seven clusters (c0–c6) identified with FRC-reclustered analysis. (B) Heatmap showing the top 20 genes and average expression levels in each cluster and their assigned identity (FDR < 0.001 and highest log-fold changes). (C) Distribution of FRC clusters in IμHABcl6 versus WT. Upper panels, UMAP of FRC clusters across the WT (left) and IμHABcl6 (right) samples. Lower panel, histogram showing frequency of FRC clusters in WT and IμHABcl6. (D and E) Violin plots of Ccl21 and Cxcl9 (D)and B2m and Cd74 (E) expression in IμHABcl6-FRC versus WT-FRC clusters.
Figure 6
Figure 6. DLBCL-FRCs show a reduced ability to attract TILs.
(A) Images of stained WT (n = 3) and IμHABcl6 (n = 3) spleens and LNs. Scale bars: 100 μm. B, B cell zones; T, T cell zones. Graph shows percentages of CCL21+ FRCs. (B) TIL (IμHABcl6) chemotaxis toward recombinant CCL21, CM from WT-FRCs, or IμHABcl6-FRCs. (C) Images of stained WT (n = 3) and IμHABcl6 (n = 3) spleens and LNs. Scale bars: 100 μm. Graph shows percentages of CXCL9+ FRCs. (D) WT T lymphocyte TIL (IμHABcl6) chemotaxis toward IμHABcl6-FRCs CM with isotype (–) or CXCL9/CXCL10–neutralizing antibodies (+). (B and D) One experiment from n = 5 (B) or n = 3 (D) independent sample experiments. Data are represented as mean ± SEM (AD). *P < 0.05; **P < 0.01; ***P < 0.001; ****P < 0.0001, 1-way ANOVA with Tukey’s test (B and D) or Mann-Whitney U test (A and C).
Figure 7
Figure 7. DLBCL-FRCs exhibit a diminished capacity to support T cell and CAR T migration.
(A) Human 3D TIL motility in gels containing FRCs or DLBCL-FRCs(c) (primary DLBCL cells with autologous TILs) (white lines indicate TIL [purple] migratory tracks). TIL speed and distance quantification. Original magnification, ×20. (B) Human TIL cell shape analysis (circularity) during 2D motility on FRCs or DLBCL-FRCs(c) (primary DLBCL cells with autologous TILs) monolayers. Motile TILs (morphology highlighted in purple). TIL cell-shape quantification. (C) IF images of stained human rLN (n = 5) and DLBCL-LNs (n = 15). Scale bars: 100 μm. IMC CD8+ T cell numbers/mm2 quantification and their circularity in rLN (n = 3) and DLBCL-LNs (n = 53). (D) Images of stained DLBCL-LNs (CAR 2) before and after CAR T cell infusion (CD8+ TILs [white], FRCs [red], and CAR T cells [purple]). CD8+ CAR T cell numbers/mm2 after infusion and their circularity (compared with rLN CD8+ cells). (E) Anti-CD19 CAR T cell 2D motility on FRCs versus DLBCL-FRCs(c) (SU-DHL16). Left panel, migratory tracks. Right panels, CAR T cell speed and distance quantification. (A, B, and E) Representative patient data from n = 3 independent primary DLBCL patient/donor experiments. Data are represented as mean ± SEM (AE). *P < 0.05; **P < 0.01; ***P < 0.001; ****P < 0.0001, Mann-Whitney U test.
Figure 8
Figure 8. DLBCL-FRCs dampen CD8+ TIL killing function.
(A) Autologous assay schematic assessing CD8+ TIL antitumor activities following exposure (24 hours) to DLBCL-FRCs or FRCs. (B) CD8+ TIL (IμHABcl6) (T) and DLBCL B cells (B) immune synapse following the exposure of TILs to WT-FRCs or IμHABcl6-FRCs. Scale bars: 100 μm; 25 μm (magnified). CD8+ TIL:DLBCL F-actin+ immune synapse (IS) area and GrB MFI. (C) TIL (IμHABcl6) cytotoxicity against DLBCL B cells. TILs activated alone or with WT-FRCs or IμHABcl6-FRCs. (D) Human anti-DLBCL TIL cytotoxicity. TILs activated alone or with FRCs or DLBCL-FRCs(p). TILs, DLBCL cells, and DLBCL-FRCs(p) were autologous (representative patient data from n = 2 independent patient samples, ABC and GCB-DLBCL). (E) OT-I T lymphocyte cytotoxicity against IμHABcl6 DLBCL cells loaded with SIINFEKL. OT-I exposed to FRCs pulsed with (+) or without (–) SIINFEKL before cytotoxicity assays. (F) Histograms of PD-L1 and PD-L2 expression on WT-FRCs (gray, n = 3) or IμHABcl6-FRCs (red, n = 5). (G) Schematic shows pretreatment of FRCs with anti–PD-L1/PD-L2 in the antigen-specific model. OT-I–mediated anti-DLBCL cytotoxicity. (B, C, E, and G) Representative data from n = 3 independent sample experiments. Data are represented as mean ± SEM (B-D, E, and G). *P < 0.05; **P < 0.01; ***P < 0.001; ****P < 0.0001, 1-way ANOVA with Tukey’s test (CE, and G) or Mann-Whitney U test (B).
Figure 9
Figure 9. DLBCL-FRCs show aberrant expression of coinhibitory ligands.
(A) Z-stack images of activated T lymphocytes interacting with FRCs or DLBCL-FRCs(c) (SU-DHL16). Polarized PD-1 expression in DLBCL-FRCs(c). Scale bars: 50 μm. (B) IMC images (left) and pixel intensity analysis (right) of FRC-associated PD-L1 and PD-L2 expression in human DLBCL-LNs (n = 53) and rLN (n = 3). Scale bars: 100 μm. (C and D) Images of WT and IμHABcl6 spleens and LN (n = 5 mice/group) stained as indicated. Scale bars: 100 μm. (H) Representative data from n = 3 independent sample experiments. Data are represented as mean ± SEM (B). ****P < 0.0001, Mann-Whitney U test.
Figure 10
Figure 10. IMC reveals distinct CD8+ TFEs in DLBCL.
(A) t-SNE plot of CD8+ TILs from 53 DLBCL-LN core biopsies (2 per patient tissue) (IMC). TILs are clustered based on the expression of PD-1, LAG-3, TIM-3, PD-L1, PD-L2, and GrB. (B) Heatmap of the median normalized protein expression per CD8+ cluster (c1–c10) and associated phenotypic identities indicated. (C) Frequency distribution of the identified CD8+ clusters across the 53 DLBCL-LNs (TMA patient IDs shown). (D) Hierarchical clustering of DLBCL patient data (n = 53) based on the z-scored frequency of each CD8+ TIL cluster (c1–c10), FRC PD-1 ligand expression cluster (c11–c14) (Supplemental Figure 7J), and FRC morphological shape cluster (c15–c18) (Supplemental Figure 1H). Four CD8+ TFEs (TFE1–4) are indicated at the top of the heatmap.
Figure 11
Figure 11. CD8+ TIL/FRC spatial organization associates with survival outcome in DLBCL.
(A) TFEs in the DLBCL-LN TMA schematic. CD8+ TIL phenotypic identities: inactivated (red), progenitor exhausted (green), cytotoxic (blue), and terminally exhausted (purple). (B) Kaplan-Meier curves of overall survival for each identified TFE (n = number of patients per TFE group). (C) Heatmap showing the average distance of each CD8+ cell (within CD8+ TIL clusters, c1–c10) from the FRC network for each TFE. (D) Two representative DLBCL-LN samples belonging to TFE 1 and TFE 4, showing the FRC mask (white) and the center of each CD8+ phenotypic cluster: inactivated (red), progenitor exhausted (green), cytotoxic (blue), terminally exhausted (pink). Original magnification, ×20. (B) ***P < 0.001, log-rank (Mantel-Cox) test.
Figure 12
Figure 12. Combining FRC-targeted immunotherapy with glofitamab enhances antitumor activity in organotypic cultures.
(A) 3D precision-cut LN slice-based organotypic cultures schematic. (B) Representative 3D image reconstruction of a human lymphoma organotypic culture stained for DLBCL cells (CD20), FRCs (PDPN), and TILs (CD8). Original magnification, ×20. (C) Confocal analysis of in situ FRCs (DLBCL-LN organotypic culture) stained for PDPN and FAP (left, 3D images; right, volume occupied analysis of FAP+ FRCs, n = 6 DLBCL patient LNs). (D) DLBCL organotypic cultures (LN57) treated for 48 hours with control antibodies (vehicle: DP47-TCB, DP47-4-1BBL, FAP-PGLALA) or with glofitamab (CD20xCD3) alone or in combination with FAP-IL2v or FAP-4-1BBL. 3D volume-rendered images show CD20+ tumor cells and cleaved caspase-3 (cCasp3) staining (upper images) and the colocalization channel (CD20+/c-Casp3+ cells) (lower). Cleaved caspase-3+ tumor cells (fold change quantification compared with vehicle treatment). Data are represented as mean ± SEM (C and D). *P < 0.05; **P < 0.01, 1-way ANOVA with Tukey’s multiple-comparisons test. Scale bars: 15 μm.
Figure 13
Figure 13. Combination immunotherapy enhances T cell retention in organotypic cultures.
(A and B) Representative IμHABcl6 spleen (A) and LN (B) organotypic cultures treated for 48 hours with vehicle or with surrogate murine (mu) muCD20-TCB alone or in combination with muFAP-IL2v or mu4-1BB-FAP immunotherapy. Cleaved caspase-3+ DLBCL cells (fold change quantification compared with vehicle). Data show 1 experiment (from n = 3 independent mice). (C) 3D confocal reconstruction of in situ FRCs and CD8+ TILs in a DLBCL (LN57) organotypic culture treated for 48 hours with the drugs indicated. Number of CD8+ TILs per field of view. Data are represented as mean ± SEM (AC). *P < 0.05; **P < 0.01; ***P < 0.001, 1-way ANOVA with Tukey’s multiple-comparisons test. Scale bars: 15 μm.

Comment in

Similar articles

Cited by

References

    1. Sehn LH, Salles G. Diffuse large B-cell lymphoma. N Engl J Med. 2021;384(9):842–858. doi: 10.1056/NEJMra2027612. - DOI - PMC - PubMed
    1. Wilson WH, et al. Effect of ibrutinib with R-CHOP chemotherapy in genetic subtypes of DLBCL. Cancer Cell. 2021;39(12):1643–1653. doi: 10.1016/j.ccell.2021.10.006. - DOI - PMC - PubMed
    1. Rosenwald A, et al. The use of molecular profiling to predict survival after chemotherapy for diffuse large-B-cell lymphoma. N Engl J Med. 2002;346(25):1937–1947. doi: 10.1056/NEJMoa012914. - DOI - PubMed
    1. Alizadeh AA, et al. Distinct types of diffuse large B-cell lymphoma identified by gene expression profiling. Nature. 2000;403(6769):503–511. doi: 10.1038/35000501. - DOI - PubMed
    1. Scott DW, et al. Prognostic significance of diffuse large B-cell lymphoma cell of origin determined by digital gene expression in formalin-fixed paraffin-embedded tissue biopsies. J Clin Oncol. 2015;33(26):2848–2856. doi: 10.1200/JCO.2014.60.2383. - DOI - PMC - PubMed

Publication types