. 2023 Jul 3;133(13):e170011.
doi: 10.1172/JCI170011.

Prevalence and functional profile of SARS-CoV-2 T cells in asymptomatic Kenyan adults

Affiliations

Prevalence and functional profile of SARS-CoV-2 T cells in asymptomatic Kenyan adults

Taraz Samandari et al. J Clin Invest. .

Abstract

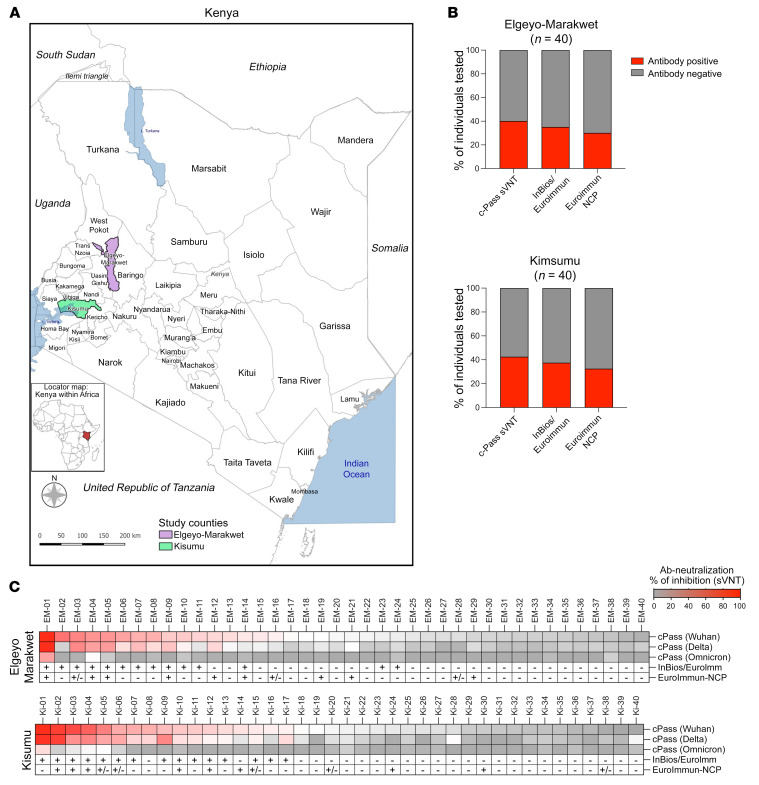
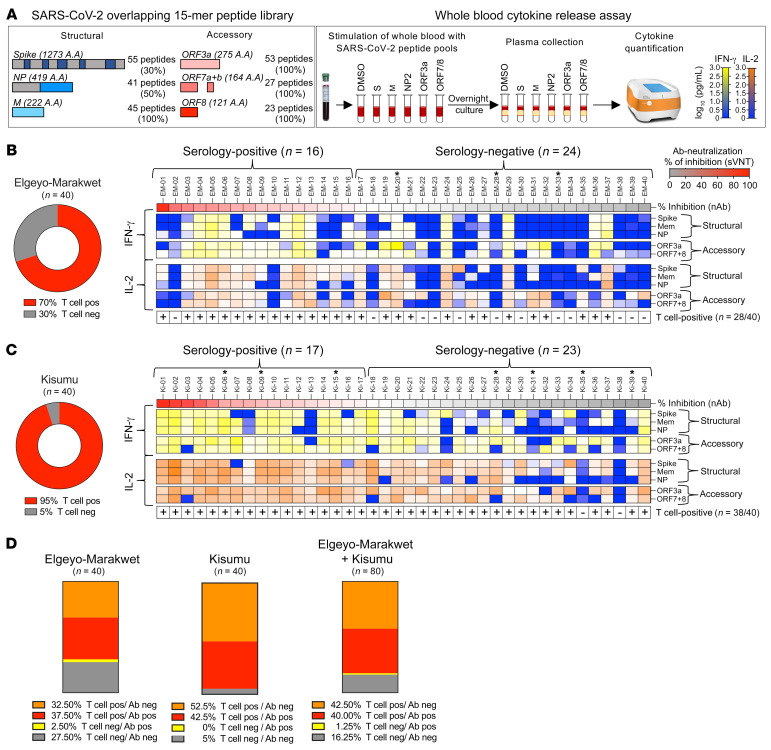
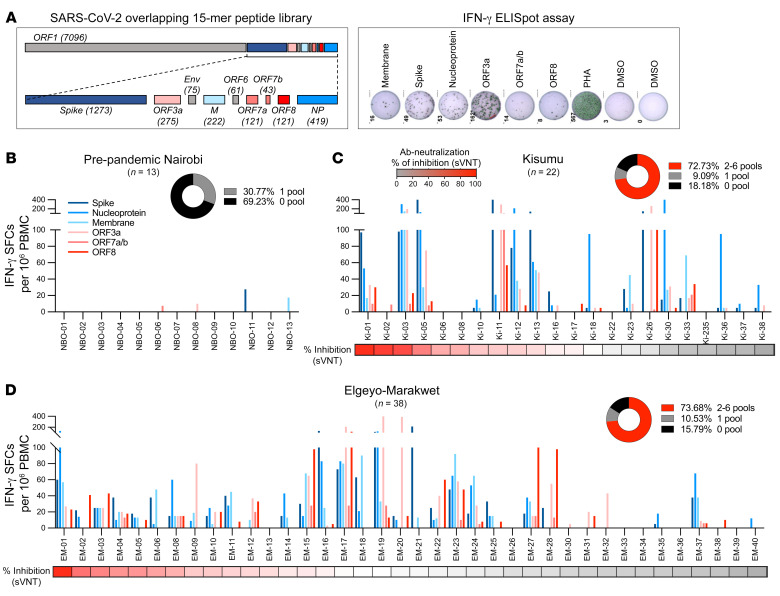
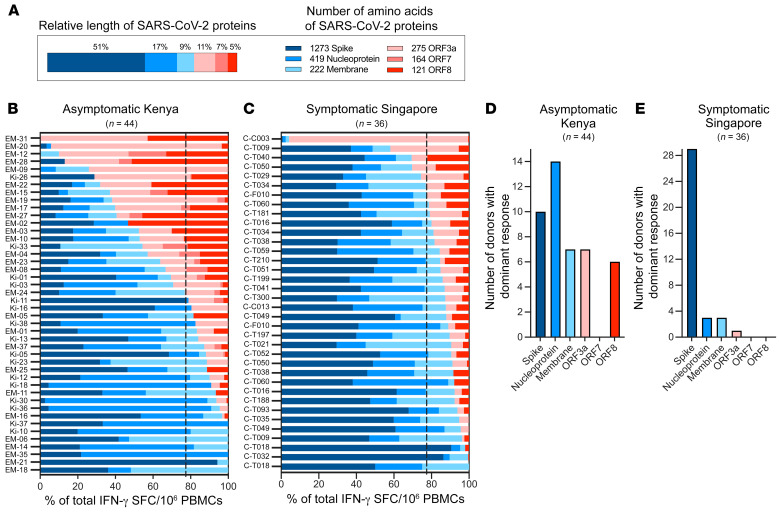
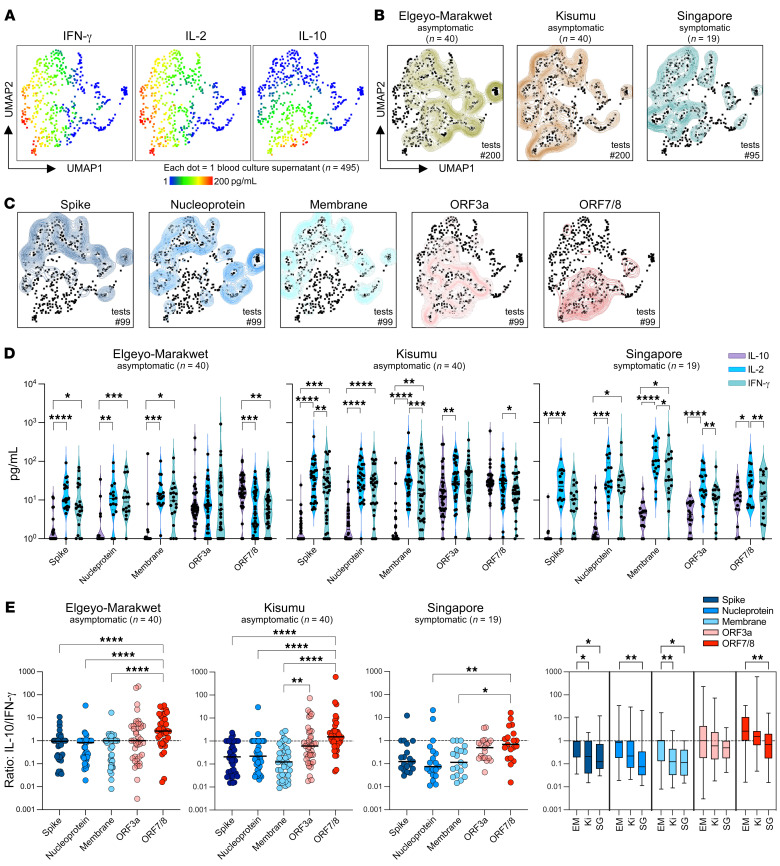
BackgroundSARS-CoV-2 infection in Africa has been characterized by a less severe disease profile than what has been observed elsewhere, but the profile of SARS-CoV-2-specific adaptive immunity in these mainly asymptomatic patients has not, to our knowledge, been analyzed.MethodsWe collected blood samples from residents of rural Kenya (n = 80), who had not experienced any respiratory symptoms or had contact with individuals with COVID-19 and had not received COVID-19 vaccines. We analyzed spike-specific antibodies and T cells specific for SARS-CoV-2 structural (membrane, nucleocapsid, and spike) and accessory (ORF3a, ORF7, ORF8) proteins. Pre-pandemic blood samples collected in Nairobi (n = 13) and blood samples from mild-to-moderately symptomatic COVID-19 convalescent patients (n = 36) living in the urban environment of Singapore were also studied.ResultsAmong asymptomatic Africans, we detected anti-spike antibodies in 41.0% of the samples and T cell responses against 2 or more SARS-CoV-2 proteins in 82.5% of samples examined. Such a pattern was absent in the pre-pandemic samples. Furthermore, distinct from cellular immunity in European and Asian COVID-19 convalescents, we observed strong T cell immunogenicity against viral accessory proteins (ORF3a, ORF8) but not structural proteins, as well as a higher IL-10/IFN-γ cytokine ratio profile.ConclusionsThe high incidence of T cell responses against different SARS-CoV-2 proteins in seronegative participants suggests that serosurveys underestimate SARS-CoV-2 prevalence in settings where asymptomatic infections prevail. The functional and antigen-specific profile of SARS-CoV-2-specific T cells in African individuals suggests that environmental factors can play a role in the development of protective antiviral immunity.FundingUS Centers for Disease Control and Prevention, Division of Global Health Protection; the Singapore Ministry of Health's National Medical Research Council (COVID19RF3-0060, COVID19RF-001, COVID19RF-008, MOH-StaR17Nov-0001).

Keywords: COVID-19; Infectious disease; T cells.


Figures

Figure 1
Figure 1. SARS-CoV-2 seropositivity in asymptomatic individuals living in Elgeyo Marakwet and Kisumu.
(A) Individuals with no history of COVID-19 symptoms (including cough, shortness of breath, fever, or sinus congestion) and no contact with confirmed SARS-CoV-2–infected individuals were recruited in 2 counties of Kenya highlighted in purple and green. Elgeyo Marakwet (n = 40 participants); Kisumu (n = 40 participants). (B) Sera from participants were analyzed with 3 antibody tests measuring spike-specific antibodies: cPass measuring SARS-CoV-2–neutralizing antibodies with a surrogate virus neutralization test (sVNT); InBios SCoV-2 Detect IgG ELISA as an initial test followed by the EUROIMMUN anti–SARS-CoV-2 test as a confirmatory test for participants who were positive by InBios; and 1 antibody test, EUROIMMUN-NCP, measuring NP-specific antibodies. The percentages of participants positive for the different tests are shown in red. (C) Antibody data are shown for the individual participants from Elgeyo Marakwet and Kisumu. All participants were tested with the cPass sVNT against the spike protein of the first SARS-CoV-2 variant (Wuhan-Hu-1 strain) and the spike protein of the SARS-CoV-2 variants Delta and Omicron. In addition, test results from the InBios/EUROIMMUN and EUROIMMUN-NCP tests are shown (+, positive; –, negative; ±, borderline).
Figure 2
Figure 2. T cell response specific for different SARS-CoV-2 proteins in asymptomatic participants from Elgeyo Marakwet and Kisumu.
(A) Schematic representation of the 5 SARS-CoV-2–specific peptide pools containing 15 mer overlapping peptides spanning 30% of spike (S), entire membrane (M), and 50% NP, and complete accessory proteins ORF3a and ORF7/8 that were used in 18-hour whole-blood cultures. Levels of IFN-γ and IL-2 secreted in response to peptide stimulation were quantified in the plasma of the blood cultures. If peptide stimulation induced greater than 5 pg/mL cytokines (IFN-γ and/or IL-2) above the corresponding DMSO controls with 2 distinct peptide pools, the individual was considered positive for SARS-CoV-2–specific T cells. The percentages of individuals from (B) Elgeyo Marakwet and (C) Kisumu who were positive for SARS-CoV-2–specific T cells are shown in red. Heatmaps show the levels of cytokines (yellow to blue: IFN-γ; orange to blue: IL-2) released upon stimulation with the distinct peptide pools in each individual; HIV-positive individuals are indicated by a single asterisk (*); samples considered positive for T cells are indicated by a plus sign (+). Participants’ data are organized according to the level of neutralizing antibodies. (D) Percentage of individuals who tested positive or negative for SARS-CoV-2–specific T cells and neutralizing antibodies. Mem, membrane; ORF7+8, ORF7 and ORF8; pos, positive; neg, negative.
Figure 3
Figure 3. T cells specific for different SARS-CoV-2 proteins in pre-pandemic samples and in the asymptomatic study participants.
(A) SARS-CoV-2 proteome organization; analyzed proteins are highlighted in color. PBMCs were stimulated with 15 mer peptide pools covering SARS-CoV-2 spike, membrane, and NP structural proteins and ORF3a, ORF7, and ORF8 accessory proteins. IFN-γ–secreting cells (SFCs) in response to peptide stimulation were quantified by ELISPOT assay. The frequency of IFN-γ–secreting cells per 1 million PBMCs is shown for each peptide pool in (B) pre-pandemic samples from Nairobi (n = 13) and in samples collected in December 2021 from asymptomatic participants from (C) Kisumu (n = 22) and (D) Elgeyo Marakwet (n = 38). Participants are organized by level of neutralizing antibodies (percentage of inhibition by sVNT). (BD) Pie chart insets show the percentage of participants with responses to 2–6 peptide pools (in red).
Figure 4
Figure 4. Immunodominance hierarchy of T cell responses to structural and accessory proteins of SARS-CoV-2.
(A) Schematic representation of the relative length of the 6 different SARS-CoV-2 proteins tested (left) and their number of amino acids (right). (B) The SARS-CoV-2 T cell response composition in each responding asymptomatic participant from Kenya (n = 44) is shown as a percentage of the total detected response (structural proteins are shown in shades of blue; accessory proteins are shown in shades of red). The dotted line represents the relative length of the structural (77%) and accessory proteins (23%) tested. (C) The composition of the SARS-CoV-2 response in convalescent symptomatic COVID-19 patients from Singapore (n = 36) is shown as a percentage of the total detected response. The number of participants with a dominant T cell response to the indicated SARS-CoV-2 proteins is shown for samples from asymptomatic participants from Kenya (D) and symptomatic convalescent COVID-19 patients from Singapore (E).
Figure 5
Figure 5. Cytokine secretion profile of SARS-CoV-2 peptide pool–stimulated whole blood from asymptomatic Kenyans and symptomatic convalescent Singaporeans.
Whole blood was stimulated with SARS-CoV-2 peptide pools overnight, and the cytokine secretion profile (IFN-γ, IL-2, and IL-10) was analyzed using an unsupervised clustering algorithm UMAP. (A) UMAP plots with cytokine secretion heatmaps. (B) Concatenated cytokine secretion profiles from asymptomatic participants from Elgeyo Marakwet (left, green, n = 40 individuals, n = 200 tests) and from Kisumu (middle, brown, n = 40 individuals, n = 200 tests), and convalescent symptomatic COVID-19 patients from Singapore (right, blue, n = 19 individuals, n = 95 tests) overlaid on the global UMAP plot of all analyzed samples (black dots; each dot corresponds to 1 culture supernatant). (C) UMAP plots comparing the cytokine secretion profiles of whole blood from all individuals tested (n = 99) stimulated with the 5 different SARS-CoV-2 peptide pools shown individually. (D) Violin plots showing the quantity of IL-10, IL-2, and IFN-γ detected in the different culture supernatants from asymptomatic participants from Elgeyo Marakwet (left) and Kisumu (middle) and from symptomatic convalescents from Singapore (right). Friedman’s test followed by Dunn’s multiple-comparison test (line indicates the median). (E) Ratios of IL-10/IFN-γ quantities detected in the culture supernatants stimulated with the different peptide pools. (F) Ratios of IL-10/IFN-γ quantities detected in the culture supernatants stimulated with the different peptide pools are compared between the 3 cohorts. EM, Elgeyo Marakwet; Ki, Kisumu; SG, Singapore. (E and F) Kruskal-Wallis test, followed by Dunn’s multiple-comparison test (line indicates the median). *P < 0.05, **P < 0.01, ***P < 0.001, and ****P < 0.0001.

References

    1. Mbow M, et al. COVID-19 in Africa: dampening the storm? Science. 2020;369(6504):624–626. doi: 10.1126/science.abd3902. - DOI - PubMed
    1. Cabore JW, et al. COVID-19 in the 47 countries of the WHO African region: a modelling analysis of past trends and future patterns. Lancet Glob Health. 2022;10(8):e1099–e1114. doi: 10.1016/S2214-109X(22)00233-9. - DOI - PMC - PubMed
    1. Njenga MK, et al. Why is there low morbidity and mortality of COVID-19 in Africa? Am J Trop Med Hyg. 2020;103(2):564–569. doi: 10.4269/ajtmh.20-0474. - DOI - PMC - PubMed
    1. Ngere I, et al. High seroprevalence of SARS-CoV-2 but low infection fatality ratio eight months after introduction in Nairobi, Kenya. Int J Infect Dis. 2021;112:25–34. doi: 10.1016/j.ijid.2021.08.062. - DOI - PMC - PubMed
    1. Sagar M, et al. Recent endemic coronavirus infection is associated with less-severe COVID-19. J Clin Invest. 2020;131(1):e143380. doi: 10.1172/JCI143380. - DOI - PMC - PubMed

Publication types