. 2023 May 22;4(2):102320.
doi: 10.1016/j.xpro.2023.102320. Online ahead of print.

WaveMAP for identifying putative cell types from in vivo electrophysiology

Affiliations

WaveMAP for identifying putative cell types from in vivo electrophysiology

Kenji Lee et al. STAR Protoc. .

Abstract

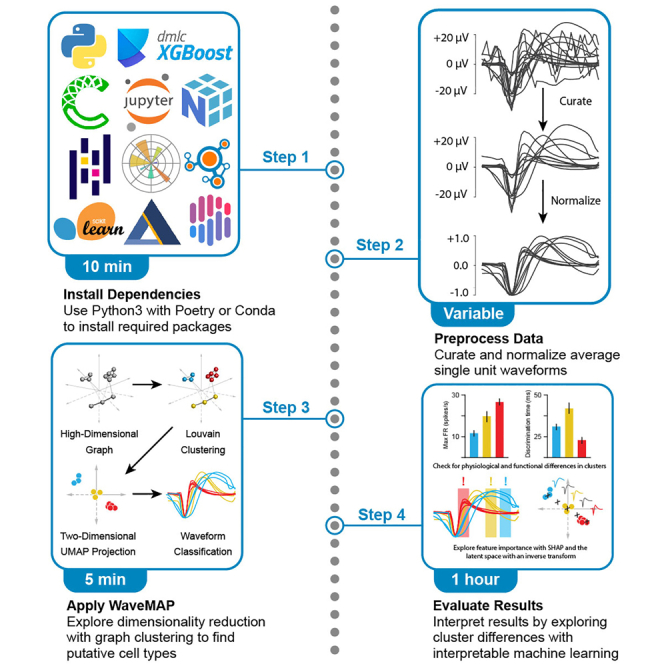
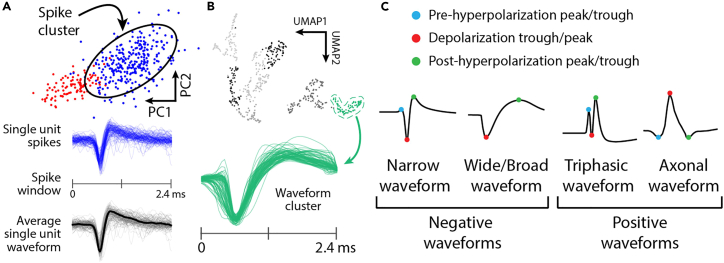
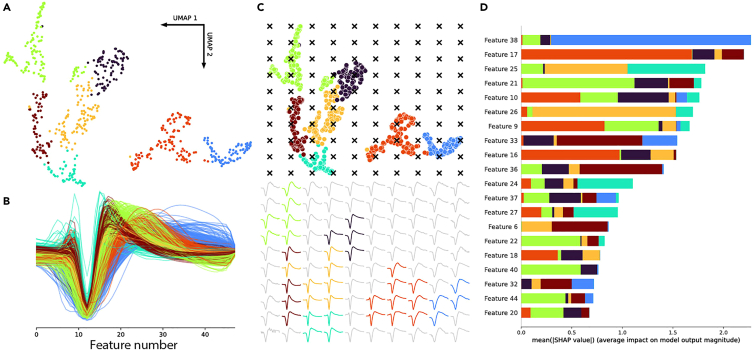
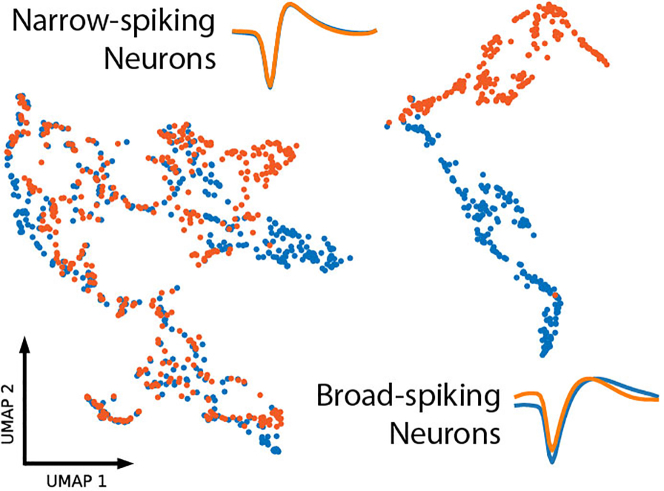
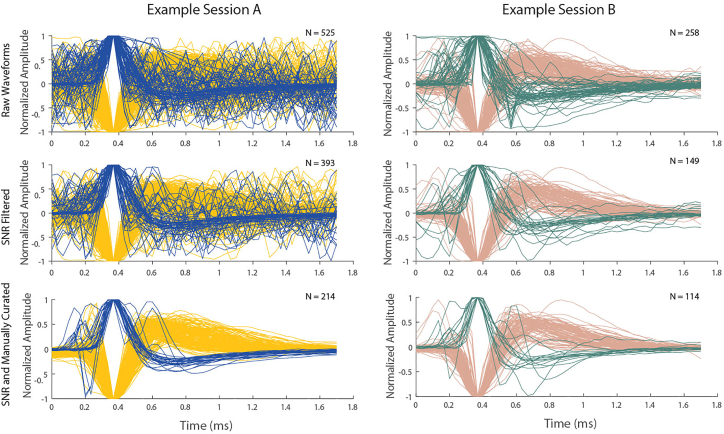
Action potential spike widths are used to classify cell types as either excitatory or inhibitory; however, this approach obscures other differences in waveform shape useful for identifying more fine-grained cell types. Here, we present a protocol for using WaveMAP to generate nuanced average waveform clusters more closely linked to underlying cell types. We describe steps for installing WaveMAP, preprocessing data, and clustering waveform into putative cell types. We also detail cluster evaluation for functional differences and interpretation of WaveMAP output. For complete details on the use and execution of this protocol, please refer to Lee et al. (2021).1.

Keywords: Behavior; Cognitive Neuroscience.


Conflict of interest statement

Declaration of interests The authors declare no competing interests.

Figures

None
Graphical abstract
Figure 1
Figure 1
Terminology of spikes and waveforms (A) (A, top) After action potentials are collected in an electrophysiological recording, they are clustered in principal component space as “spike clusters”. (A, middle) All the action potentials recorded from a cluster are colloquially called “spikes” and are aligned within a “spike window” which defines the snippet of time capturing a spike. (A, bottom) These spikes are then averaged into a “average single unit waveform” shown as a solid black line. (B) (B, top) UMAP projection of average waveforms. Each cluster is a “waveform cluster” made up of the average waveform from different neurons. This is not to be confused with the aforementioned “spike clusters” which are the individual spikes from a single neuron. (B, bottom) The average waveforms within a waveform cluster which are grouped via Louvain clustering according to their similarity in shape. (C) Electrophysiological features of both negative (left) and positive (right) average waveforms.
Figure 2
Figure 2
The installation process for WaveMAP and JupyterLab (Top left) Adding an environment kernel to Jupyter with ipykernel and launching JupyterLab. (Top right) A successful installation of JupyterLab and the WaveMAP environment kernel. (Bottom left) Screenshot of using Poetry in MacOS’s Terminal to create an environment and install WaveMAP. (Bottom right) Testing that WaveMAP and UMAP’s packages have installed properly by importing each package.
Figure 3
Figure 3
Unnormalized vs. normalized waveforms in UMAP-space with pre-normalization amplitude shown as marker color (A) Unnormalized average single-unit waveforms from Lee et al. 2021 after UMAP projection and colored by the logarithm of their unnormalized amplitude. (B) Amplitude-normalized average single-unit waveforms from Lee et al. 2021 and colored by the logarithm of their pre-normalized amplitude.
Figure 4
Figure 4
Output plots of applying WaveMAP to average waveforms from primate dorsal premotor cortex (A) WaveMAP applied to normalized average single-unit waveforms from Lee et al. 2021. Units are in the UMAP projected space and colored by their Louvain cluster membership. (B) Normalized average single-unit waveforms from (A) and colored by their Louvain cluster membership. (C, top) The same visualization as in (A) but with a grid of test points (small x’s) overlaid on the embedded space. (C, bottom) Waveforms predicted at each test point in (C, top) using UMAP’s inverse transformation function which itself uses Delaunay triangulation. Waveforms are colored by their Louvain cluster membership with gray waveforms not occurring near or within a cluster in the embedding. Waveforms far from clusters incur artifactual noise as there is no real data to constrain predictions. (D) Mean absolute SHAP (SHapley Additive exPlanations) values (a measure of feature importance) for each time point along the waveform (called a “feature” and numbered in order). Each mean absolute SHAP value is composed of SHAP value contributions from each of the Louvain clusters colored as stacked bars.
Figure 5
Figure 5
Different filter properties produce “mirroring” or “duplication” of structure in UMAP projected space WaveMAP applied to a concatenated dataset consisting of the same normalized average single-unit waveforms with either a 500 Hz high pass (blue) or 1 kHz high pass filter (orange) applied (both a zero-phase 4th order Butterworth). Averaged waveforms for both the narrow- (scatter points on left) and broad-spiking (scatter points on right) are shown.
Figure 6
Figure 6
Noise in recordings obscures underlying latent structure WaveMAP applied to the same extracellular average waveforms (insets) collected from Lee et al. 2021 both with (left) and without (right) additive Gaussian noise at a signal-to-noise ratio of 2.5.
Figure 7
Figure 7
Conservative selection of average waveforms accomplished through SNR filtering and manual curation Two experimental samples of normalized Neuropixels waveform templates directly from the spike sorter Kilosort2 (https://github.com/MouseLand/Kilosort/releases/tag/v2.0) both before (top) and after automated curation (signal-to-noise ratio thresholding; middle). Subsequent manual curation cleans up the dataset further (discarding spikes with highly variable spike shape e.g., those with many peaks and likely multi-unit; bottom). Manual curation was always conducted after automated thresholding to minimize curation time. Positive and negative spikes are highlighted in separate colors. Dataset from Trepka et al.

Similar articles

Cited by

References

    1. Lee E.K., Balasubramanian H., Tsolias A., Anakwe S.U., Medalla M., Shenoy K.V., Chandrasekaran C. Non-linear dimensionality reduction on extracellular waveforms reveals cell type diversity in premotor cortex. Elife. 2021;10:e67490. doi: 10.7554/eLife.67490. - DOI - PMC - PubMed
    1. McInnes L., Healy J., Melville J. UMAP: Uniform Manifold Approximation and Projection for dimension reduction. arXiv. 2018 doi: 10.48550/arXiv.1802.03426. Preprint at. - DOI
    1. Blondel V.D., Guillaume J.-L., Lambiotte R., Lefebvre E. Fast unfolding of communities in large networks. J. Stat. Mech. 2008;2008:P10008. doi: 10.1088/1742-5468/2008/10/p10008. - DOI
    1. Lundberg S.M., Lee S.-I. A Unified Approach to Interpreting Model Predictions. arXiv. 2017
    1. Chandrasekaran C., Peixoto D., Newsome W.T., Shenoy K.V. Laminar differences in decision-related neural activity in dorsal premotor cortex. Nat. Commun. 2017;8:614. doi: 10.1038/s41467-017-00715-0. - DOI - PMC - PubMed

LinkOut - more resources