

Surveillance for Violent Deaths - National Violent Death Reporting System, 48 States, the District of Columbia, and Puerto Rico, 2020
- PMID: 37220104
- PMCID: PMC10208308
- DOI: 10.15585/mmwr.ss7205a1
Surveillance for Violent Deaths - National Violent Death Reporting System, 48 States, the District of Columbia, and Puerto Rico, 2020
Abstract
Problem/condition: In 2020, approximately 71,000 persons died of violence-related injuries in the United States. This report summarizes data from CDC's National Violent Death Reporting System (NVDRS) on violent deaths that occurred in 48 states, the District of Columbia, and Puerto Rico in 2020. Results are reported by sex, age group, race and ethnicity, method of injury, type of location where the injury occurred, circumstances of injury, and other selected characteristics.
Period covered: 2020.
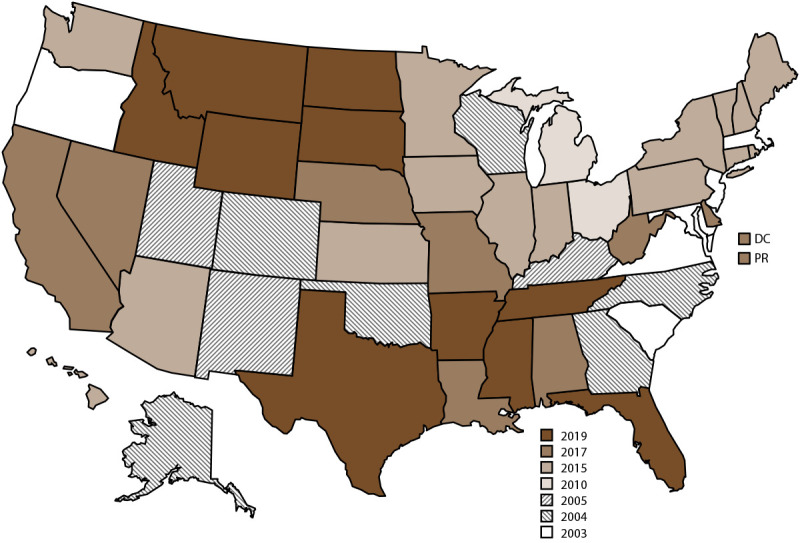
Description of system: NVDRS collects data regarding violent deaths obtained from death certificates, coroner and medical examiner records, and law enforcement reports. This report includes data collected for violent deaths that occurred in 2020. Data were collected from 48 states (all states with exception of Florida and Hawaii), the District of Columbia, and Puerto Rico. Forty-six states had statewide data, two additional states had data from counties representing a subset of their population (35 California counties, representing 71% of its population, and four Texas counties, representing 39% of its population), and the District of Columbia and Puerto Rico had jurisdiction-wide data. NVDRS collates information for each violent death and links deaths that are related (e.g., multiple homicides, homicide followed by suicide, or multiple suicides) into a single incident.
Results: For 2020, NVDRS collected information on 64,388 fatal incidents involving 66,017 deaths that occurred in 48 states (46 states collecting statewide data, 35 California counties, and four Texas counties), and the District of Columbia. In addition, information was collected for 729 fatal incidents involving 790 deaths in Puerto Rico. Data for Puerto Rico were analyzed separately. Of the 66,017 deaths, the majority (58.4%) were suicides, followed by homicides (31.3%), deaths of undetermined intent (8.2%), legal intervention deaths (1.3%) (i.e., deaths caused by law enforcement and other persons with legal authority to use deadly force acting in the line of duty, excluding legal executions), and unintentional firearm deaths (<1.0%). The term "legal intervention" is a classification incorporated into the International Classification of Diseases, Tenth Revision, and does not denote the lawfulness or legality of the circumstances surrounding a death caused by law enforcement.Demographic patterns and circumstances varied by manner of death. The suicide rate was higher for males than for females. Across all age groups, the suicide rate was highest among adults aged ≥85 years. In addition, non-Hispanic American Indian or Alaska Native (AI/AN) persons had the highest suicide rates among all racial and ethnic groups. Among both males and females, the most common method of injury for suicide was a firearm. Among all suicide victims, when circumstances were known, suicide was most often preceded by a mental health, intimate partner, or physical health problem or by a recent or impending crisis during the previous or upcoming 2 weeks. The homicide rate was higher for males than for females. Among all homicide victims, the homicide rate was highest among persons aged 20-24 years compared with other age groups. Non-Hispanic Black (Black) males experienced the highest homicide rate of any racial or ethnic group. Among all homicide victims, the most common method of injury was a firearm. When the relationship between a homicide victim and a suspect was known, the suspect was most frequently an acquaintance or friend for male victims and a current or former intimate partner for female victims. Homicide most often was precipitated by an argument or conflict, occurred in conjunction with another crime, or, for female victims, was related to intimate partner violence. Nearly all victims of legal intervention deaths were male, and the legal intervention death rate was highest among men aged 35-44 years. The legal intervention death rate was highest among AI/AN males, followed by Black males. A firearm was used in the majority of legal intervention deaths. When a specific type of crime was known to have precipitated a legal intervention death, the type of crime was most frequently assault or homicide. When circumstances were known, the three most frequent circumstances reported for legal intervention deaths were as follows: the victim's death was precipitated by another crime, the victim used a weapon in the incident, and the victim had a substance use problem (other than alcohol use).Other causes of death included unintentional firearm deaths and deaths of undetermined intent. Unintentional firearm deaths were most frequently experienced by males, non-Hispanic White (White) persons, and persons aged 15-24 years. These deaths most frequently occurred while the shooter was playing with a firearm and were precipitated by a person unintentionally pulling the trigger. The rate of deaths of undetermined intent was highest among males, particularly among AI/AN and Black males, and among adults aged 30-54 years. Poisoning was the most common method of injury in deaths of undetermined intent, and opioids were detected in nearly 80% of decedents tested for those substances.
Interpretation: This report provides a detailed summary of data from NVDRS on violent deaths that occurred in 2020. The suicide rate was highest among AI/AN and White males, whereas the homicide rate was highest among Black male victims. Intimate partner violence precipitated a large proportion of homicides for females. Mental health problems, intimate partner problems, interpersonal conflicts, and acute life stressors were primary circumstances for multiple types of violent death.
Public health action: Violence is preventable, and states and communities can use data to guide public health action. NVDRS data are used to monitor the occurrence of violence-related fatal injuries and assist public health authorities in developing, implementing, and evaluating programs, policies, and practices to reduce and prevent violent deaths. For example, the Colorado Violent Death Reporting System (VDRS), Kentucky VDRS, and Oregon VDRS have used their VDRS data to guide suicide prevention efforts and generate reports highlighting where additional focus is needed. In Colorado, VDRS data were used to examine the increased risk for suicide among first and last responders in the state. Kentucky VDRS used local data to highlight how psychological and social effects of the COVID-19 pandemic might increase risk for suicide, particularly among vulnerable populations. Oregon VDRS used their data to develop a publicly available data dashboard displaying firearm mortality trends and rates in support of the state's firearm safety campaign. Similarly, states participating in NVDRS have used their VDRS data to examine homicide in their state. Illinois VDRS, for example, found that state budget cuts were associated with notable increases in homicides among youths in Chicago. With an increase of participating states and jurisdictions, this report marks progress toward providing nationally representative data.
Conflict of interest statement
All authors have completed and submitted the International Committee of Medical Journal Editors form for disclosure of potential conflicts of interest. No potential conflicts of interest were disclosed.
Figures
References
-
- CDC. WISQARS—Web-based Injury Statistics Query and Reporting System. Atlanta, GA: US Department of Health and Human Services, CDC, National Center for Injury Prevention and Control; 2021. https://www.cdc.gov/injury/wisqars/index.html
-
- Institute of Medicine. Reducing the burden of injury: advancing prevention and treatment. Washington DC: National Academies Press; 1999. https://nap.nationalacademies.org/read/6321/chapter/1 - PubMed
-
- World Health Organization. International Classification of Diseases, Tenth Revision. Geneva, Switzerland: World Health Organization; 2007. https://icd.who.int/browse10/2019/en
MeSH terms
LinkOut - more resources
Full Text Sources
Medical
Research Materials