. 2023 May 23;21(5):e3002107.
doi: 10.1371/journal.pbio.3002107. eCollection 2023 May.

Optimal restoration for pollination services increases forest cover while doubling agricultural profits

Affiliations

Optimal restoration for pollination services increases forest cover while doubling agricultural profits

Sofía López-Cubillos et al. PLoS Biol. .

Abstract

Pollinators are currently facing dramatic declines in abundance and richness across the globe. This can have profound impacts on agriculture, as 75% of globally common food crops benefit from pollination services. As many native bee species require natural areas for nesting, restoration efforts within croplands may be beneficial to support pollinators and enhance agricultural yields. Yet, restoration can be challenging to implement due to large upfront costs and the removal of land from production. Designing sustainable landscapes will require planning approaches that include the complex spatiotemporal dynamics of pollination services flowing from (restored) vegetation into crops. We present a novel planning framework to determine the best spatial arrangement for restoration in agricultural landscapes while accounting for yield improvements over 40 years following restoration. We explored a range of production and conservation goals using a coffee production landscape in Costa Rica as a case study. Our results show that strategic restoration can increase forest cover by approximately 20% while doubling collective landholder profits over 40 years, even when accounting for land taken out of production. We show that restoration can provide immense economic benefits in the long run, which may be pivotal to motivating local landholders to undertake conservation endeavours in pollinator-dependent croplands.


Conflict of interest statement

The authors have declared that no competing interests exist.

Figures

Fig 1
Fig 1. Spatial optimization framework.
In the “Agricultural context” box, 3 different contexts are represented. The “Baseline” context is the current landscape where there is no coffee expansion or restoration. In the “Only restoration” context, restoration is allowed to happen within the coffee cropland, but no coffee expansion is allowed. In the “Expansion and restoration” context, both coffee expansion in intact forest and coffee cropland restoration is allowed across the landscape. The “Model input” box represents all the biophysical and economic data needed to run the optimization (see Methods). In the “Optimization” boxes, we want to simultaneously maximise the coffee NPV and forest habitat for each agricultural context. In the “Sensitivity analysis” box, 4 sets of sensitivity analyses are conducted on key variables (see Methods). Finally, the “Pareto frontier” box represents the trade-offs between maximising the NPV or forest. In this box, we can highlight 3 main goals for each optimization: (1) The “Conservation Focus Goal” gives more priority to restoration; (2) the “Profit Focus Goal” gives more priority to agricultural profit (NPV), and (3) the “Balanced Goal” aims to find an equilibrium between both objectives. Most of the clip art were created on the website https://www.autodraw.com/ that is a Creative Commons Attribution 4.0 International License and only a couple (plants for restoration and also restoration failure) were drawn by hand.
Fig 2
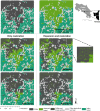
Fig 2. Baseline and spatial representation of the different goals for each context in the last time step (year 40) as described below in section “Planning goals and optimization analysis.
” The data underlying this figure can be found in S1 Data in tabs 1–6 for each map. The base map layer was taken from The World Bank Data Catalog and do not require credit because of public domain (https://datacatalog.worldbank.org/search/dataset/0038272/World-Bank-Official-Boundaries).
Fig 3
Fig 3. Trade-offs between profit (NPV) and forest for the end of the restoration horizon (40 years).
Pareto curve for the “baseline,” “only restoration,” and “expansion and restoration” agricultural contexts. The black and grey lines represent all the scaling values used (λ). “Profit focus,” “balanced,” and “conservation focus” goals are represented by diamond, squares, and triangle, respectively. The index is the result of the profit (NPV) or forest for all “planning cells” over the 40-year period. Here, the forest index includes both restored and remanent forest. The data underlying this figure can be found in S2 Data.
Fig 4
Fig 4
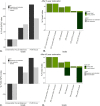
The difference in the profit (NPV) index (A and C) and the forest index (B and D) for each goal per context compared to the baseline at the end of the restoration time horizon for 5-year and 40-year restoration outcomes. The dashed line at zero represents the baseline. The data underlying this figure can be found in S3 Data.
Fig 5
Fig 5
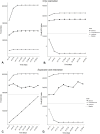
Cumulative forest (A and C) and profit (NPV) index (B and D) over the time horizon (40 years) for the only restoration and expansion and restoration contexts. The data underlying this figure can be found in S4 Data.
Fig 6
Fig 6. Changes in forest and NPV among the agricultural contexts based on the sensitivity analyses (see Methods section).
The dashed line indicates the baseline, and the box and whisker plots indicate the variation from all sensitivity analyses. The solid black line represents the median and the lower and upper hinges correspond to the first and third quartiles (the 25th and 75th percentiles). The data underlying this figure can be found in S5 Data.

Similar articles

Cited by

References

    1. Suding K, Higgs E, Palmer M, Callicott JB, Anderson CB, Baker M, et al.. Committing to ecological restoration. Science. 2015;348(6235):638–40. - PubMed
    1. Bonn C. Restoration commitments from Africa push the Bonn Challenge beyond 100 million hectares. Bonn Challenge. 2016.
    1. Jaggard KW, Qi A, Ober ES. Possible changes to arable crop yields by 2050. Philos Trans R Soc Lond B Biol Sci. 2010;365(1554):2835–51. doi: 10.1098/rstb.2010.0153 - DOI - PMC - PubMed
    1. Maxwell SL, Fuller RA, Brooks TM, Watson JEM. Biodiversity: The ravages of guns, nets and bulldozers. Nature. 2016;536(7615):143–5. doi: 10.1038/536143a - DOI - PubMed
    1. Kanianska R. Agriculture and Its Impact on Land-Use, Environment, and Ecosystem Services. IntechOpen; 2016.

Publication types