. 2023 May 23;16(786):eabo4863.
doi: 10.1126/scisignal.abo4863. Epub 2023 May 23.

Neuropilin-1 interacts with VE-cadherin and TGFBR2 to stabilize adherens junctions and prevent activation of endothelium under flow

Affiliations

Neuropilin-1 interacts with VE-cadherin and TGFBR2 to stabilize adherens junctions and prevent activation of endothelium under flow

Emy Bosseboeuf et al. Sci Signal. .

Abstract

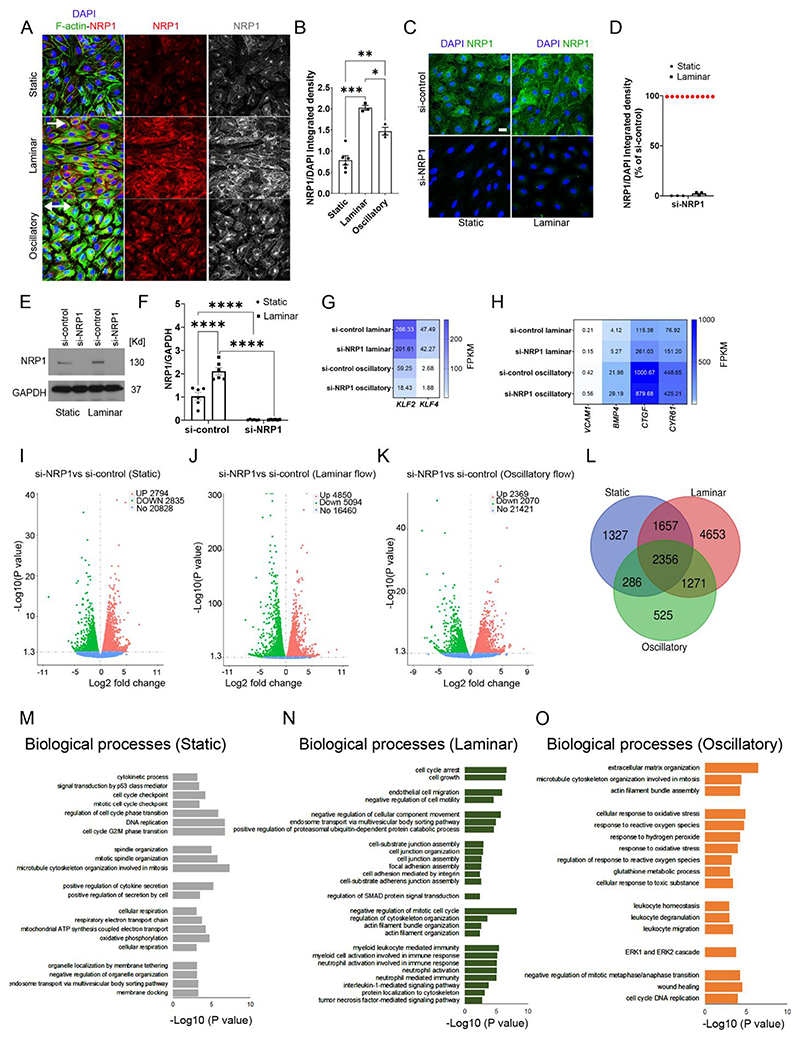
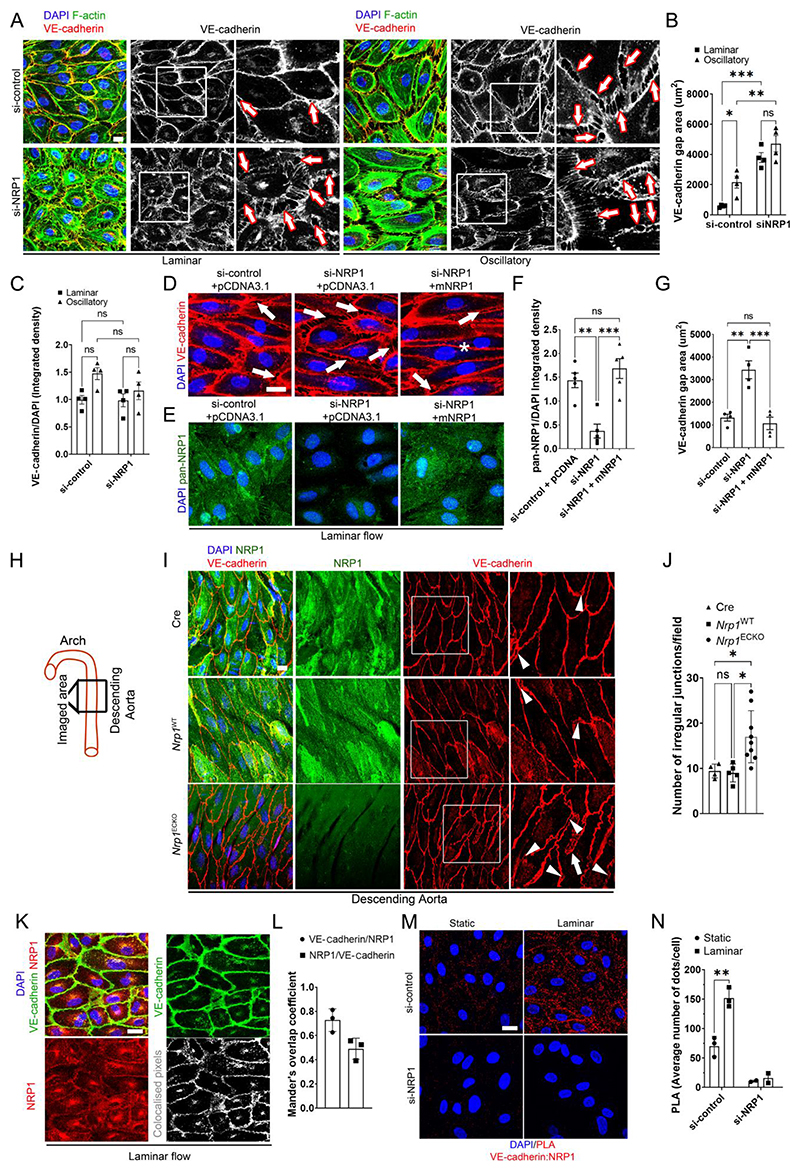
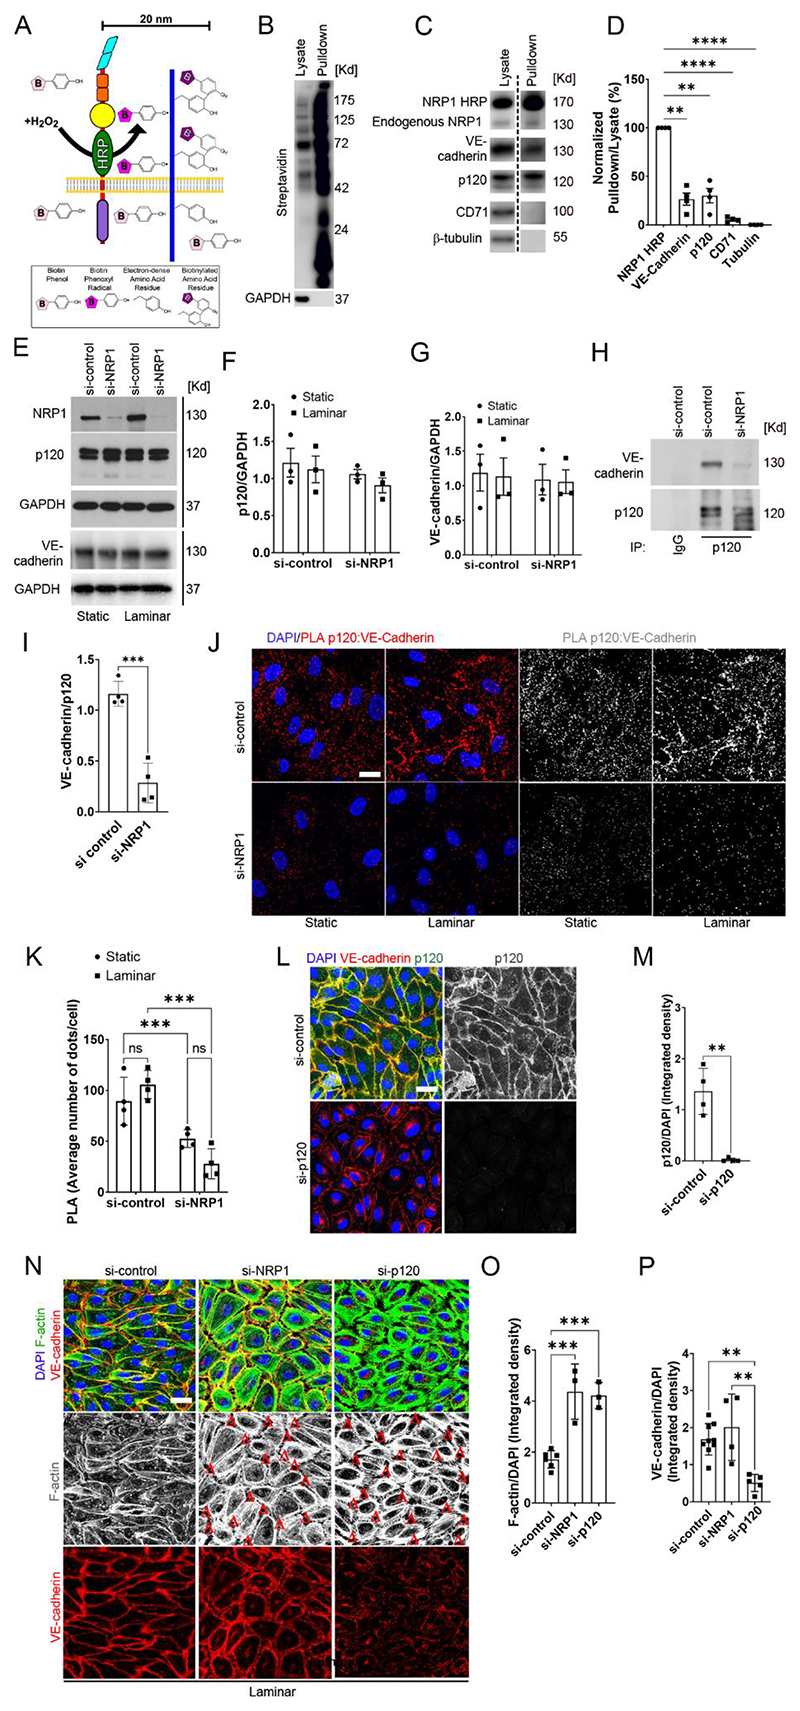
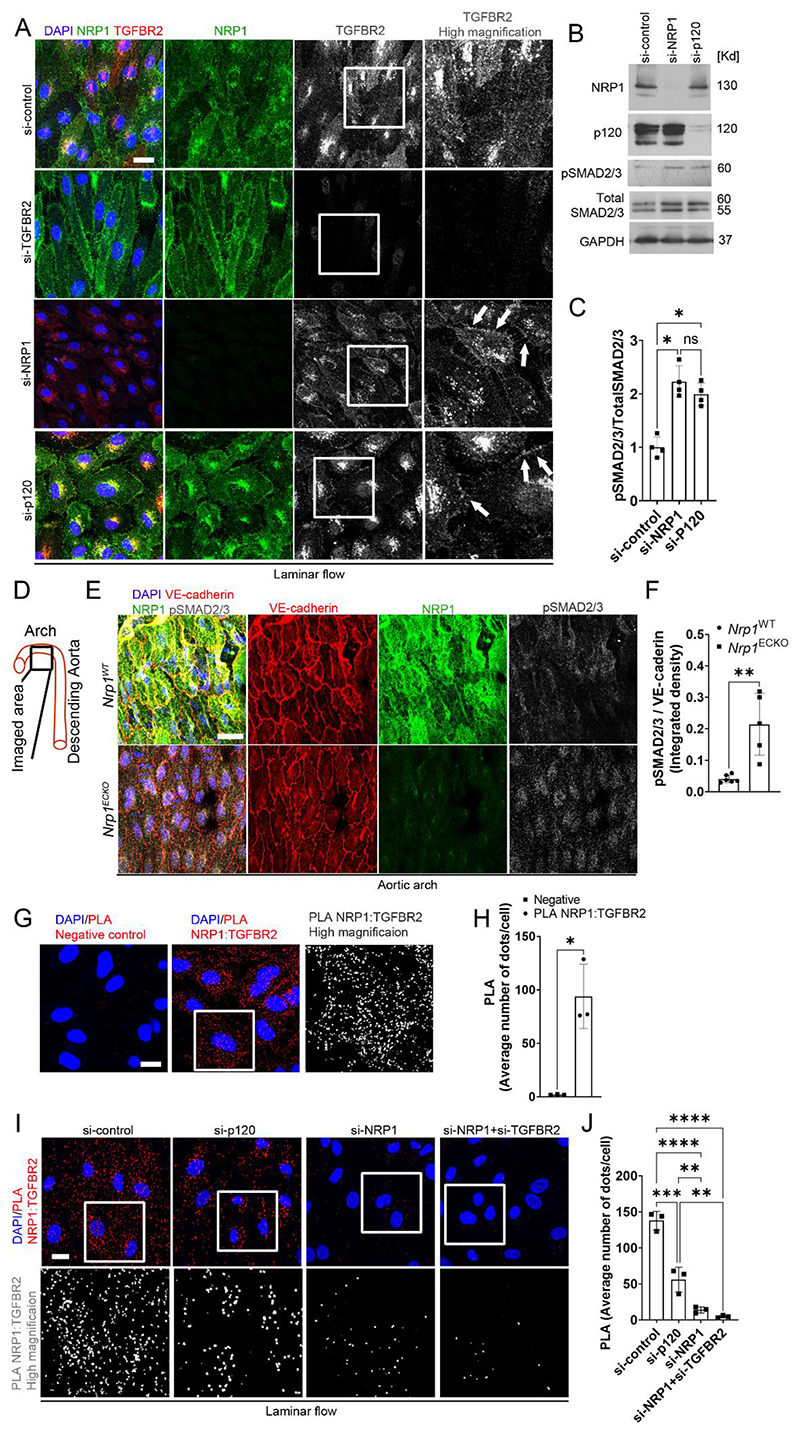
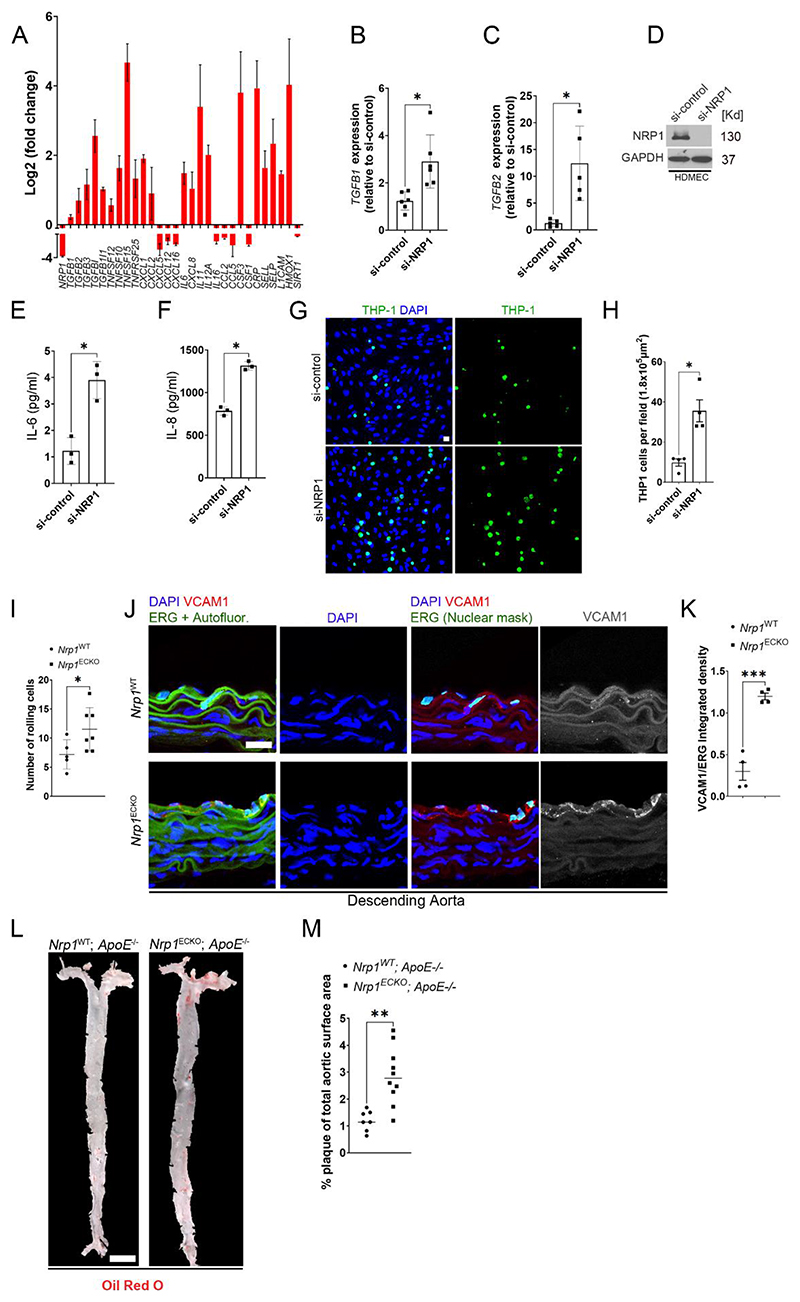
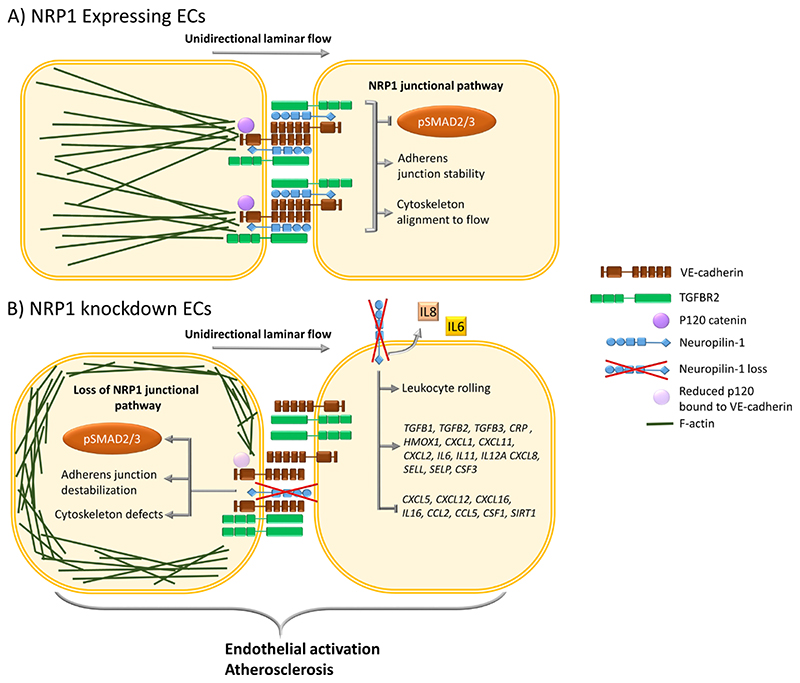
Linear and disturbed flow differentially regulate gene expression, with disturbed flow priming endothelial cells (ECs) for a proinflammatory, atheroprone expression profile and phenotype. Here, we investigated the role of the transmembrane protein neuropilin-1 (NRP1) in ECs exposed to flow using cultured ECs, mice with an endothelium-specific knockout of NRP1, and a mouse model of atherosclerosis. We demonstrated that NRP1 was a constituent of adherens junctions that interacted with VE-cadherin and promoted its association with p120 catenin, stabilizing adherens junctions and inducing cytoskeletal remodeling in alignment with the direction of flow. We also showed that NRP1 interacted with transforming growth factor-β (TGF-β) receptor II (TGFBR2) and reduced the plasma membrane localization of TGFBR2 and TGF-β signaling. NRP1 knockdown increased the abundance of proinflammatory cytokines and adhesion molecules, resulting in increased leukocyte rolling and atherosclerotic plaque size. These findings describe a role for NRP1 in promoting endothelial function and reveal a mechanism by which NRP1 reduction in ECs may contribute to vascular disease by modulating adherens junction signaling and promoting TGF-β signaling and inflammation.


Conflict of interest statement

Competing interests: The authors declare that they have no competing interests.

Figures

Fig. 1
Fig. 1. NRP1 regulates flow-induced gene expression in endothelial cells.
(A) HUVECs exposed to laminar or oscillatory flow or cultured under static conditions for 24 hours were stained for NRP1 (red and grey), F-actin (green) and DAPI (blue). Scale bar =20 μm. White arrows show the direction of flow. (B) NRP1 integrated density was measured in optical z-stacks and normalized to DAPI. Data are presented as means ± SEM. N=3 (laminar or oscillatory) or 6 (static) biological replicates per group from 3 independent experiments. *p < 0.05, **p < 0.005, ***p < 0.001 by one-way ANOVA. (C) HUVECs transfected for 72 hours with si-control or si-NRP1 and exposed to laminar flow for 24 hours or cultured under static condition were stained for NRP1 (green) and DAPI (blue). Scale bar = 20 μm. (D) NRP1 integrated density was measured in optical z-stacks, normalized to DAPI and expressed as percentage of si-control. Data are presented as means ± SEM. N = 3 biological replicates per group. (E) Representative immunoblotting for NRP1 and GAPDH of HUVECs transfected for 72 hours with si-control or si-NRP1 and exposed to static or laminar flow for 24 hours. (F) Quantification of NRP1 signal normalized to GAPDH signal expressed as fold change of static si-control. Data are presented as means ± SEM. N = 6 biological replicates per group. **p < 0.005, ***p < 0.001 by two-way ANOVA. (G, H) Heat-map of gene expression in HUVECs transfected for 72 hours with si-control or si-NRP1 exposed to laminar or oscillatory flow showing fragments per kilobase of transcript per million mapped reads (FPKM). (I-K) Volcano plots of RNA-seq transcriptomic data displaying significantly differentially expressed genes in si-NRP1-transfected HUVECs relative to si-control-transfected HUVECs cultured under static conditions (I), exposed to laminar flow (J) or oscillatory flow (K) for 24 hours. (L) Venn diagram of RNA-seq transcriptome data displaying the number of differentially expressed genes between si-control and si-NRP1 common or specific to static, laminar or oscillatory conditions. (M-O) GO analysis of biological processes differentially modulated in HUVECs transfected with si-control or si-NRP1 for 72 hours and cultured under static conditions (M) or laminar flow (N) or oscillatory flow (O) for 24 hours. For (G) to (O), N = 3 biological replicates per group.
Fig. 2
Fig. 2. NRP1 regulates adherence junctions by VE-cadherin.
(A) HUVECs transfected with si-control or si-NRP1 for 72 hours were exposed to laminar or oscillatory flow for 24 hours and stained for VE-cadherin (red and grey), F-actin (green) and DAPI (blue). Scale bar = 20 μm. White squares indicate the areas shown in higher magnification. Arrows indicate representative gaps between adjacent cells. (B) VE-cadherin staining gap (μm2) between neighboring cells measured in optical z-stacks. Data are presented as means ± SEM. N = 4 biological replicates per group. ns = non-significant, *p < 0.05, **p < 0.005, ***p < 0.001 by two-way ANOVA. (C) VE-cadherin integrated density measured in optical z-stacks normalized to DAPI. Data are presented as means ± SEM. N = 4 biological replicates per group. ns = non-significant by two-way ANOVA. (D and E) HUVECs transfected with si-control or si-NRP1 and pCDNA3.1 empty vector or pCDNA3.1 encoding WT mouse NRP1 for 72 hours and exposed to laminar flow for 24 hours were stained for VE-cadherin (red) (D) or with a pan-NRP1 antibody (green) (E) and counterstained with DAPI (blue). Scale bar = 20 μm. Arrows indicate representative gaps between adjacent cells. Asterisk indicates normal cellcell junction. (F) Quantification of NRP1 integrated density measured in optical z-stacks and normalized to DAPI. Data are presented as means ± SEM. N = 4 biological replicates per group. **p < 0.005, ***p < 0.001 by one-way ANOVA. (G) VE-cadherin gap (μm2) between adjacent cells measured in optical z-stacks Data are presented as means ± SEM. N = 4 biological replicates per group. **p < 0.005, ***p < 0.001 by one-way ANOVA. (H) Schematic indicating the aortic regions analyzed in (I) and (J). (I) C57BL/6 mice carrying two WT NRP1 alleles expressing Cdh5(PAC)-iCreERT2 (Cre), Nrp1fl/fl (Nrp1WT) or Nrp1fl/fl;Cdh5(PAC)-iCreERT2 (Nrp1ECKO) littermates injected daily with tamoxifen (12.5mg/kg) for 5 days at 4 weeks of age. Aortae were collected after 4 weeks and immunostained for NRP1 (green), VE-cadherin (red), DAPI (blue); Scale bar = 20 μm. White squares indicate the areas shown in higher magnification. White arrowheads indicate VE-cadherin discontinuous irregular patterns. White arrows show finger-like protrusions. (J) Number of irregular VE-cadherin junctions per field in optical z-stacks. Data are presented as means ± SD. N > 4 mice per group. *p < 0.05 by one-way ANOVA. (K) HUVECs subjected to laminar flow for 24 hours were stained for NRP1 (red), VE-cadherin (green) and DAPI (blue). Grey scale image represents NRP1/VE-cadherin co-localized pixels. Scale bar = 20 μm. (L) Mander’s coefficient of VE-cadherin and NRP1 colocalization. Data are presented as means ± SD. N = 3 biological replicates per group. (M) PLAs (red) for NRP1 and VE-cadherin in HUVECs transfected with si-control or si-NRP1 for 72 hours and subjected to static or laminar flow for 24 hours. Cells were counterstained with DAPI (blue). Scale bar = 20 μm. (N) Average PLA signal per cell measured in a minimum of 80 cells per experiment in 3 experiments for si-control and 2 experiments for si-NRP1. Data are presented as means ± SD. *p < 0.05 by paired t-test).
Fig. 3
Fig. 3. Loss of NRP1 reduces the interaction between p120 catenin cadherin and VE-cadherin, resulting in adherens junction and cytoskeletal disruption.
A) Schematic illustrating the HRP–based proximity-labelling in which an HRP-containing protein exposed to hydrogen peroxide for 1 minute oxidizes fluid-phase–fed biotin tyramide, resulting in the biotinylation of proteins within a 20 nm radius. (B and C) Biotinylated proteins were pulled down from lysates with streptravidin beads, and pulldown samples and lysates were analysed by immunoblotting for the indicated proteins (dashed line indicates images are from different exposure times). (D) Quantification of pulled down proteins normalized to pulled down NRP1-HRP (100%) and tubulin (0%). Data are presented as means ± SEM. N = 4 biological replicates per group. **p<0.009; ****p<0.0001 by repeated measure one-way ANOVA with Dunnett post hoc test. (E to G) Representative immunoblotting (E) for NRP1, p120 catenin, VE-Cadherin and GAPDH in HUVECs transfected for 72 hours with si-control or si-NRP1 and exposed to laminar flow or static conditions for 24 hours. Densitometry analysis of p120 catenin (F) and VE-cadherin (G) relative to GAPDH. Data are presented as means ± SEM. N = 3 biological replicates per group. Two-way ANOVA. (H) Endogenous VE-cadherin and p120 catenin were co-immunoprecipitated from lysates of HUVECs cultured under static conditions and transfected with control or NRP1 siRNAs for 72 hours. p120 catenin or control IgG immunoprecipitates were immunoblotted for VE-cadherin and p120 catenin. (I) Densitometry analysis of endogenous co-immunoprecipitated VE-cadherin normalized to immunoprecipitated p120 catenin. Data are presented as means ± SEM. N = 4 biological replicates per group. ***p < 0.001 by paired t-test. (J) PLA (red, grey) for p120 catenin:VE-cadherin in HUVECs transfected with si-control or si-NRP1 for 72 hours, exposed to static or laminar flow conditions for 24 hours and counterstained with DAPI (blue). Scale bar = 20 μm. (K) Average PLA signal per cell was measured in a minimum of 80 cells per experiment from 4 independent experiments. Data are presented as means ± SD. **p < 0.001 by two-way ANOVA. (L) Staining for VE-cadherin (red), p120 catenin (green and gray) of HUVECs transfected for 72 hours with si-control or si-p120 catenin and exposed to laminar flow for 24 hours. Scale bar = 20 μm. (M) Quantification of p120 catenin integrated density in optical z-stacks normalized to DAPI. Data are presented as means ± SD. N = 4 biological replicates per group. **p < 0.001 by t-test. (N) HUVECs transfected for 72 hours with si-control, si-NRP1 or si-p120 catenin were subjected to laminar flow for 24 hours and stained for VE-cadherin (red), F-actin (green and grey) and DAPI (blue). Red Δs indicate gaps between adjacent cells. Scale bar = 20 μm. (O) Quantification of F-actin integrated density in optical z-stacks normalized to DAPI. Data are presented as means ± SD. N ≥ 3 biological replicates per group. ns = non-significant, ***p < 0.0001 by one-way ANOVA. (P) Quantification of VE-cadherin integrated density in optical z-stacks and normalized to DAPI. Data are presented as means ± SD. N ≥ 4 biological replicates per group. ns = non-significant, **p < 0.005 by one-way ANOVA.
Fig. 4
Fig. 4. NRP1 and p120 catenin cooperate to suppress TGF-β signaling.
(A) HUVECs transfected for 72 hours with si-control, si-NRP1, si-p120 catenin or si-TGFBR2 and exposed to laminar flow for 24 hours were stained for TGFBR2 (red and grey), NRP1 (green) and DAPI (blue). Scale bar = 20 μm. White squares indicate the areas shown in higher magnification. White arrows show TGFBR2 plasma membrane enrichment. N = 3 biological replicates per group. (B) Representative immunoblotting for NRP1, p120 catenin, pSMAD2/3, total SMAD2/3 and GAPDH of HUVECs transfected for 72 hours with si-control, si-NRP1 or si-p120 catenin. (C) Quantification of SMAD2/3 phosphorylation relative to total SMAD2/3 expressed as fold change compared to si-control. Data are presented as means ± SD. N = 4 biological replicates per group. ns = non-significant, *p < 0.05 by one-way ANOVA. (D) Schematic indicating the region in the aortic arch analyzed in (E) and (F). (E) Aortic arches of Nrp1WT or Nrp1ECKO mice injected daily with tamoxifen (12.5mg/kg) for 5 days at 4 weeks of age, collected after 4 weeks and immunostained for NRP1 (green), VE-cadherin (red), pSMAD2/3 (grey) and DAPI (blue). Scale bar = 20 μm. (F) Quantification of pSMAD2/3 integrated density relative to VE-cadherin. Data are presented as means ± SD. N ≥ 5 mice per group. **p < 0.005 by unpaired t-test. (G) PLA (red, grey) for NRP1:TGFBR2 in HUVECs cultured under static conditions. Scale bar = 20 μm. White square shows the location of enhanced magnification of PLA shown in grey scale in the righthand side panel. (H) Average PLA signal per cell measured in a minimum of 80 cells per experiment from 3 independent experiments. Data are presented as means ± SD. *p < 0.05 by paired t-test. (I) PLA (red, grey) for NRP1 :TGFBR2 in HUVECs transfected for 72 hours with si-control, si-NRP1, si-p120 catenin or co-transfected with si-NRP1 and si-TGFBR2, exposed to laminar flow for 24 hours and counterstained with DAPI (blue). Scale bar = 20 μm. White square shows the location of enhanced magnification of PLA shown in grey scale in the bottom panels. (J) Average PLA signal was measured in a minimum of 80 cells per experiment from 3 independent experiments. Data are presented as means ± SD. **p < 0.005, ***p < 0.001, ****p < 0.0001 by one-way ANOVA.
Fig. 5
Fig. 5. NRP1 suppresses inflammatory pathways and atherosclerosis.
(A) Fold changes (Log2) in gene expression of HUVECs transfected with si-NRP1 for 72 hours and exposed to laminar flow for 24 hours relative to HUVECs transfected with si-control under the same experimental conditions. Data are presented as means ± SD. N = 3 biological replicates per group. (B) TGFB1 gene expression in HUVECs transfected for 72 hours with si-control or si-NRP1 and cultured under static conditions, expressed as fold change relative to si-control. Data are presented as means ± SD. N = 6 biological replicates per group. *p < 0.05 by paired t-test. (C) TGFB2 gene expression was measured in HUVECs transfected for 72 hours with si-control or si-NRP1 and cultured under static conditions. TGF-β2 gene expression was expressed as fold change relative to si-control. Data are presented as means ± SD. N = 5 biological replicates per group. *p < 0.05 by paired t-test. (D) Representative immunoblotting for NRP1 and GAPDH of HDMECs transfected for 72 hours with si-control or si-NRP1 and cultured under static conditions. (E and F) Quantification by ELISA of IL-6 (E) and IL-8 (F) secretion in HDMECs transfected for 72 hours with si-control or si-NRP1. Data are presented as means ± SD. N = 3 biological replicates per group. *p < 0.05 by t-test. (G) THP-1 cells labelled with Calcein-AM 1μM (green) adhering to a confluent monolayer of HUVECs transfected with si-control or si-NRP1 for 72 hours and counterstained with DAPI (blue). (H) Number of adhering THP-1 cells per field. Data are presented as means ± SEM. N = 3 biological replicates per group. *p < 0.05 by paired t-test. (I) Rolling leukocytes in the postcapillary venules of the mesentery of Nrp1WT (n=5) or Nrp1ECKO (n=7) mice injected daily with tamoxifen (12.5mg/kg) for 5 days at 4 weeks of age and imaged after 2 weeks. Data are presented as means ± SD. *p < 0.05 by unpaired t-test. (J) Rings of descending aortae from Nrp1WT or Nrp1ECKO mice injected daily with tamoxifen (12.5mg/kg) for 5 days at 4 weeks of age and immunostained after 4 weeks for ERG (green), VCAM1 (red and grey) and counterstained with DAPI (blue). Scale bar = 20 μm. ImageJ software was used to mask the autofluorescence in the green channel to reveal ERG-DAPI double positive ECs. (K) Quantification of VCAM1 integrated density relative to ERG. Data are presented as means ± SD. N = 4 mice per group. ***p < 0.001 by paired t-test. (L) En-face aortae from Nrp1WT;ApoE-/- or Nrp1ECKO;ApoE-/- mice, injected daily with tamoxifen (12.5mg/kg) for 5 days at 4 weeks and stained 18 weeks of age with Oil-Red-O (Red). Red staining shows plaque deposition on the inner wall of aortae. Scale bar = 2.1 mm (M) Quantification of plaque deposition was expressed as percentage of total aortic surface coverage. Data are presented as means ± SD. N ≥ 7 mice per group. **p < 0.005 by t-test.
Fig. 6
Fig. 6. Schematic representation of the effect of NRP1 on the TGFBR2-VE-cadherin pathway in regulating adherens junctions and inflammatory responses.
(A) In ECs, NRP1 interacts with VE-cadherin and TGFBR2, reducing TGF-β signaling and stabilizing adherens junctions. NRP1 promotes VE-cadherin interaction with p120 catenin, leading to optimal coupling of the actin cytoskeleton with the adherens junction complex and to alignment of the cytoskeleton to the direction of flow. (B) In the absence of NRP1, the interaction of NRP1 with VE-cadherin is lost and that of VE-cadherin with p120 catenin is reduced, leading to cytoskeleton remodeling and abundant cortical actin and resulting in a lack of cytoskeleton alignment to the flow direction. Furthermore, in ECs lacking NRP1, adherens junction destabilization increases the plasma membrane localization of TGFBR2, resulting in the downstream phosphorylation of SMAD2/3. Loss of NRP1-dependent signaling pathways results in EC activation, leading to increases in the expression of genes encoding proinflammatory cytokines, chemokines, adhesion molecules, secretion of IL6 and IL8, leukocyte rolling, and plaque formation in an atherosclerosis mouse model.

References

    1. Dejana E, Orsenigo F, Lampugnani MG. The role of adherens junctions and VE-cadherin in the control of vascular permeability. J Cell Sci. 2008;121:2115–2122. - PubMed
    1. Muller WA. How endothelial cells regulate transmigration of leukocytes in the inflammatory response. Am J Pathol. 2014;184:886–896. - PMC - PubMed
    1. Nourshargh S, Alon R. Leukocyte migration into inflamed tissues. Immunity. 2014;41:694–707. - PubMed
    1. Muller WA. Leukocyte-endothelial-cell interactions in leukocyte transmigration and the inflammatory response. Trends Immunol. 2003;24:327–334. - PubMed
    1. Lampugnani MG, et al. VE-cadherin regulates endothelial actin activating Rac and increasing membrane association of Tiam. Mol Biol Cell. 2002;13:1175–1189. - PMC - PubMed

Publication types

LinkOut - more resources