

Transcriptional Characterization of Bronchoalveolar Lavage Fluid Reveals Immune Microenvironment Alterations in Chemically Induced Acute Lung Injury
- PMID: 37220504
- PMCID: PMC10200123
- DOI: 10.2147/JIR.S407580
Transcriptional Characterization of Bronchoalveolar Lavage Fluid Reveals Immune Microenvironment Alterations in Chemically Induced Acute Lung Injury
Abstract
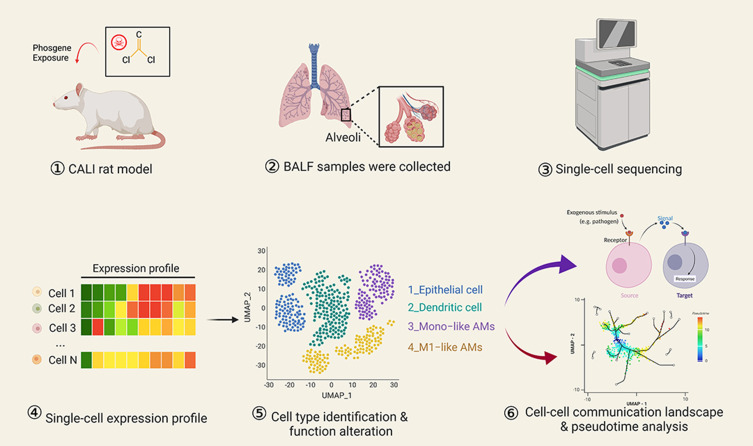
Purpose: Chemically induced acute lung injury (CALI) has become a serious health concern in our industrialized world, and abnormal functional alterations of immune cells crucially contribute to severe clinical symptoms. However, the cell heterogeneity and functional phenotypes of respiratory immune characteristics related to CALI remain unclear.
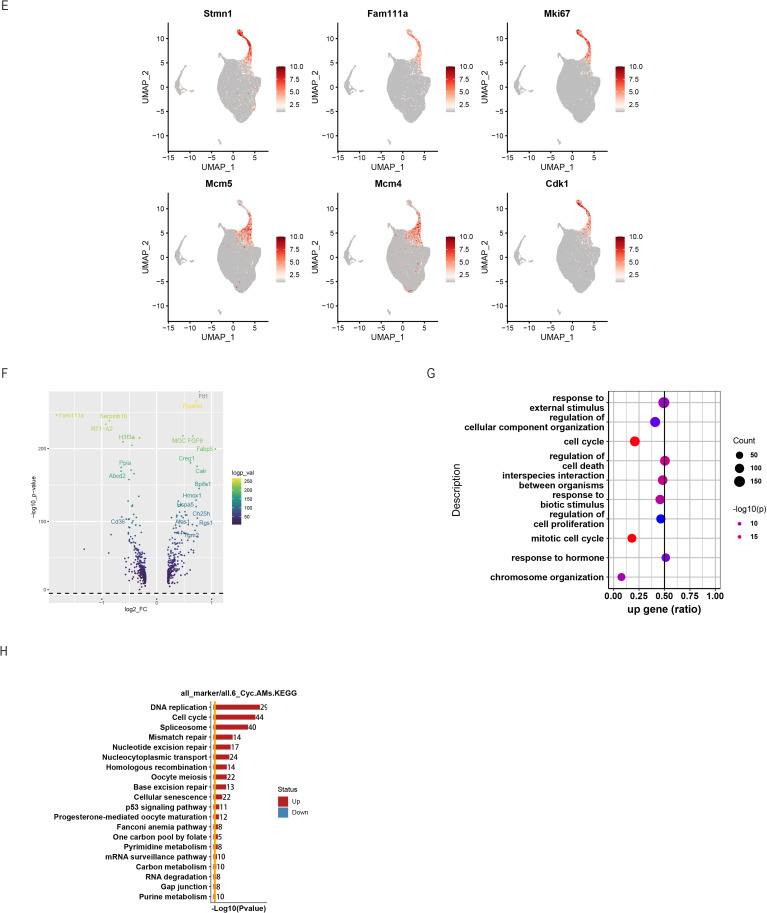
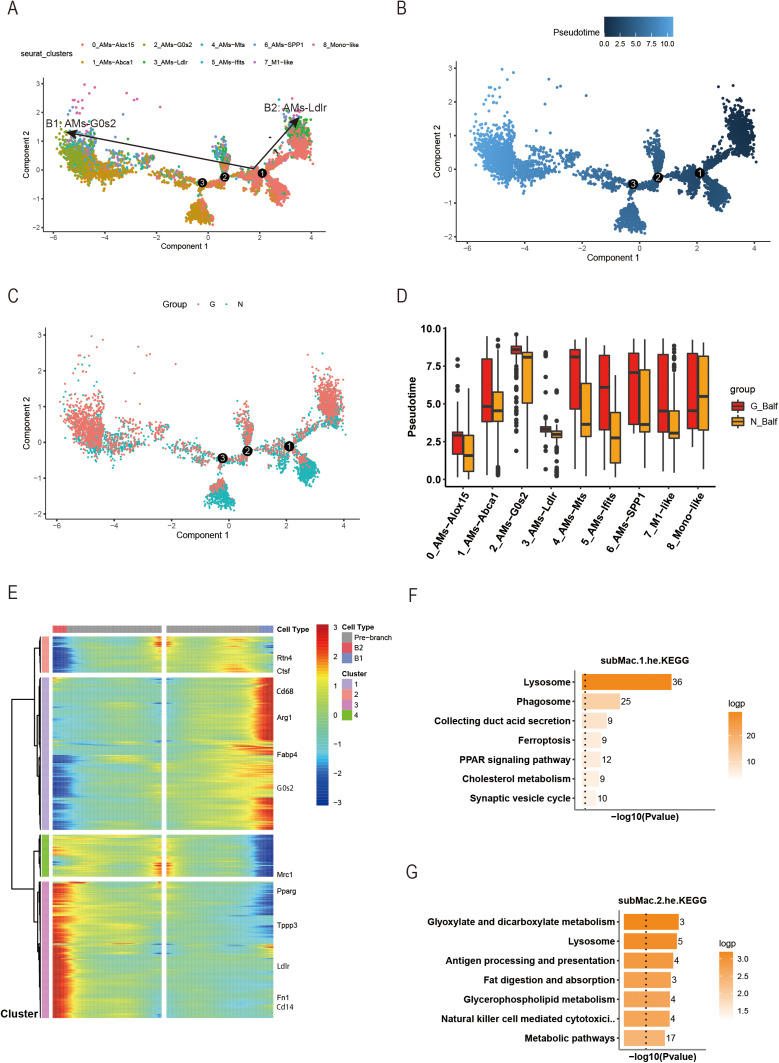
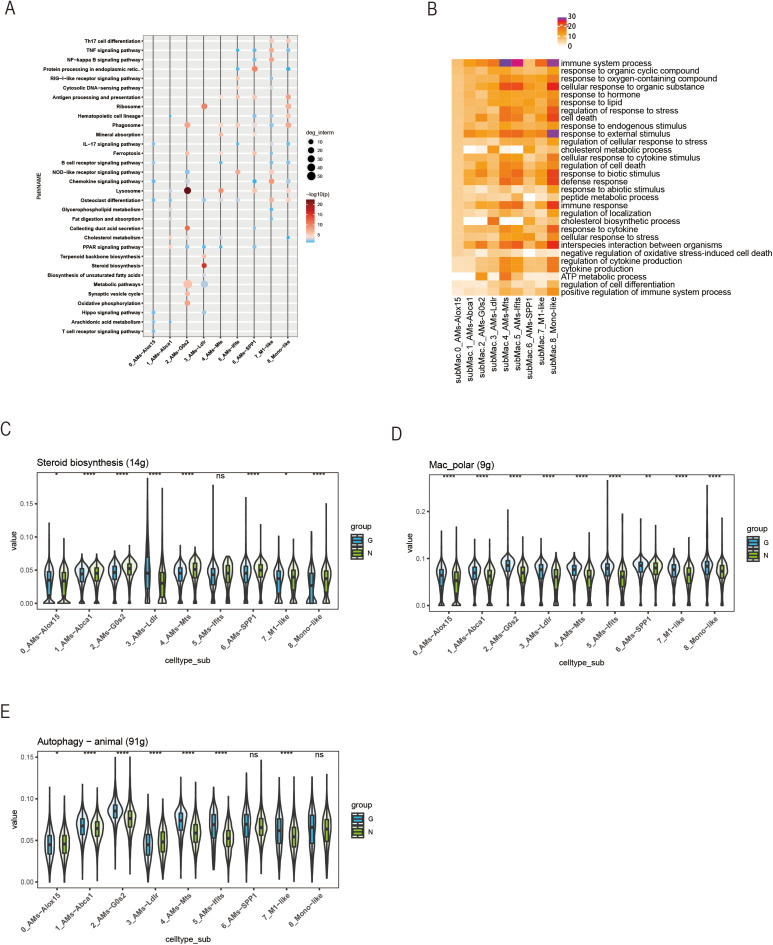
Methods: We performed scRNA sequencing on bronchoalveolar lavage fluid (BALF) samples obtained from phosgene-induced CALI rat models and healthy controls. Transcriptional data and TotalSeq technology were used to confirm cell surface markers identifying immune cells in BALF. The landscape of immune cells could elucidate the metabolic remodeling mechanism involved in the progression of acute respiratory distress syndrome and cytokine storms. We used pseudotime inference to build macrophage trajectories and the corresponding model gene expression changes, and identified and characterized alveolar cells and immune subsets that may contribute to CALI pathophysiology based on gene expression profiles at single-cell resolution.
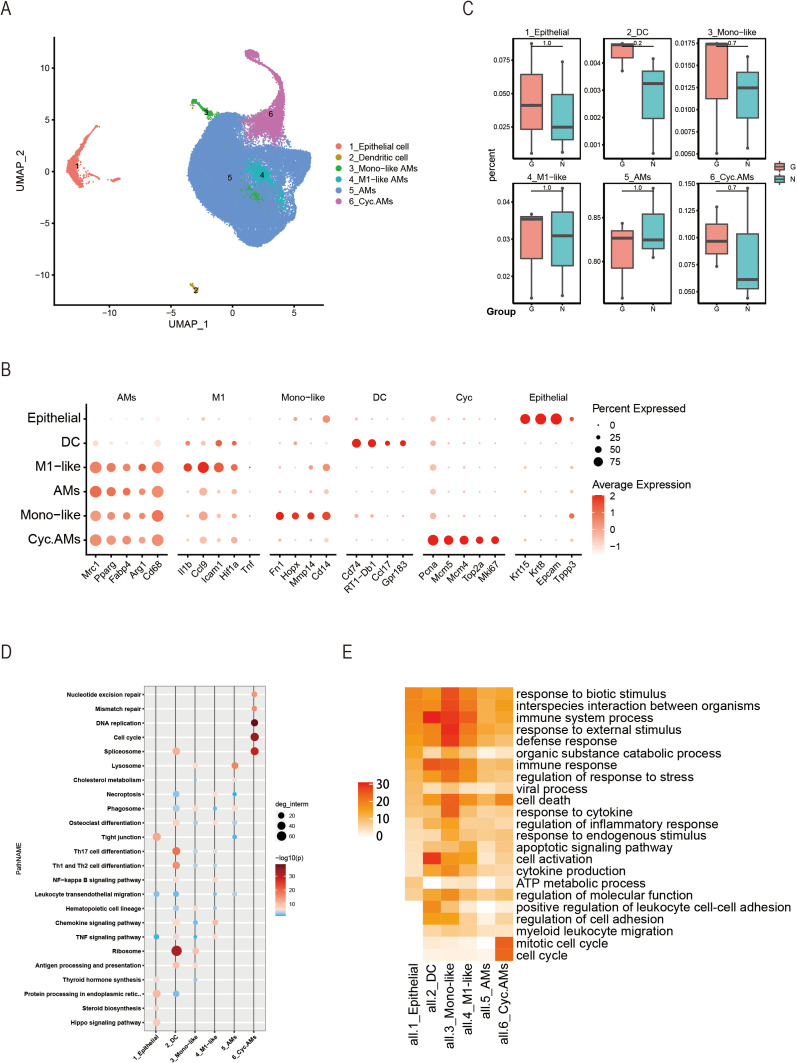
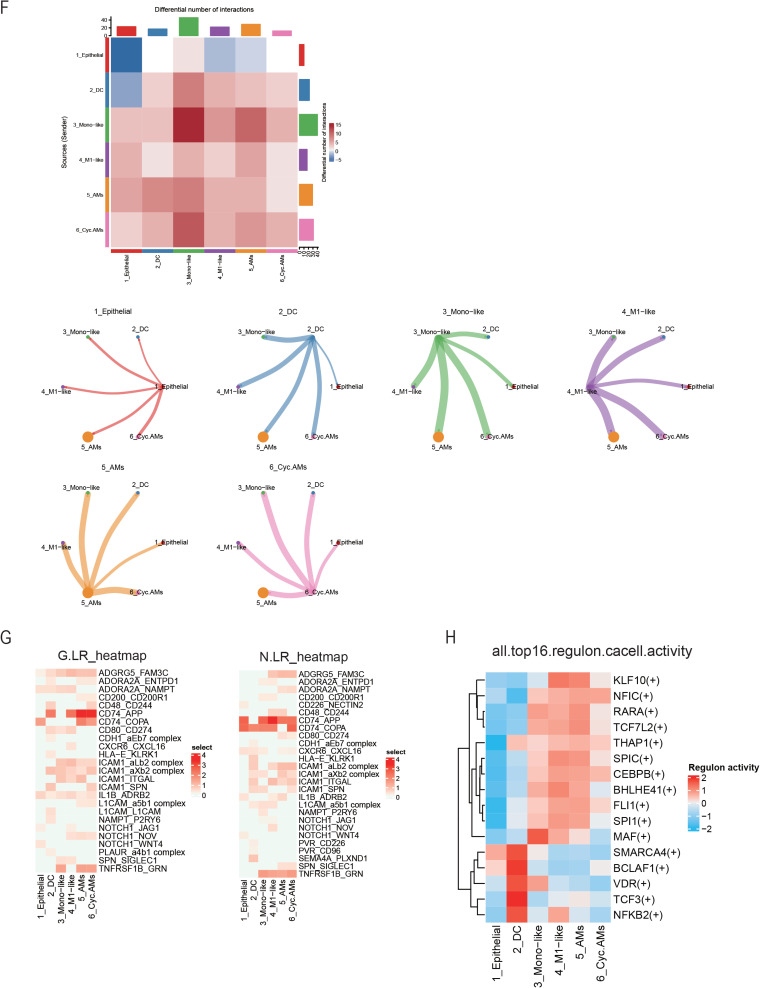
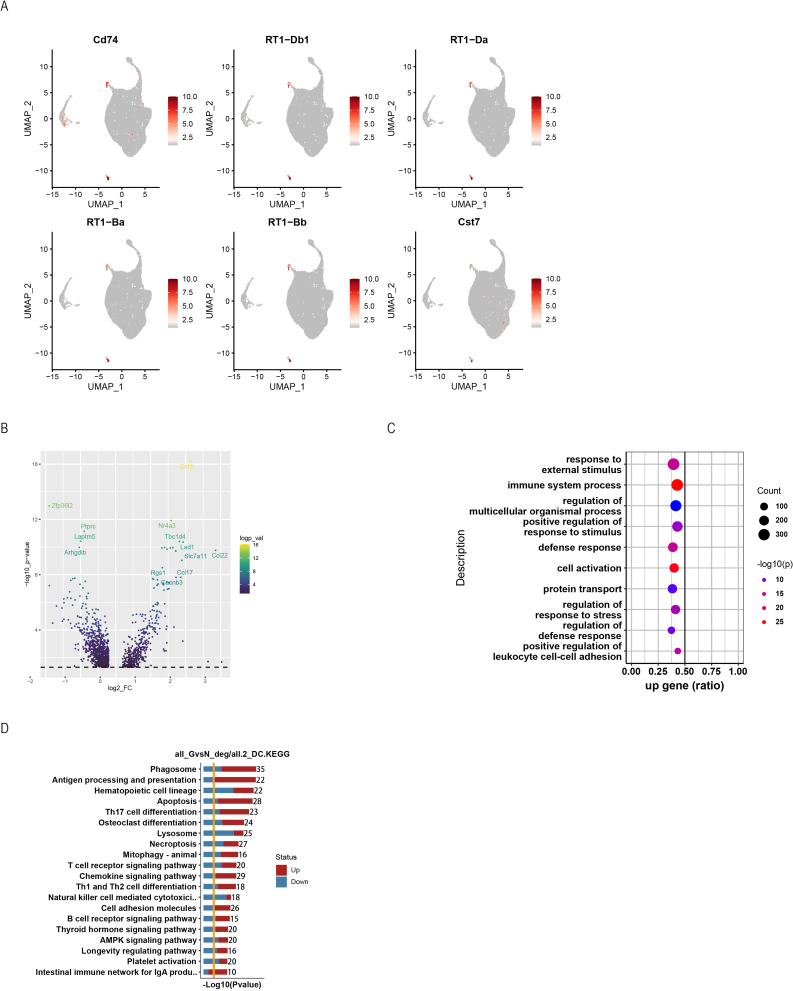
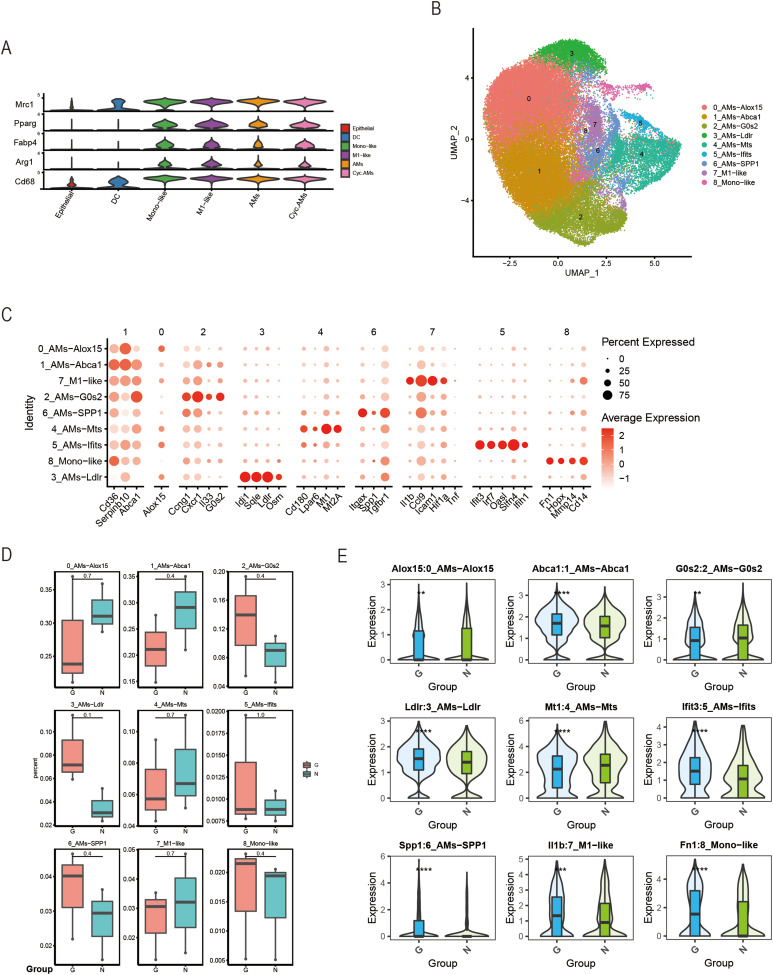
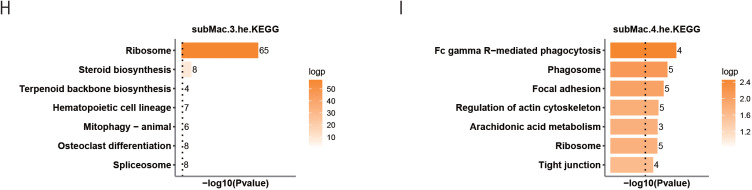
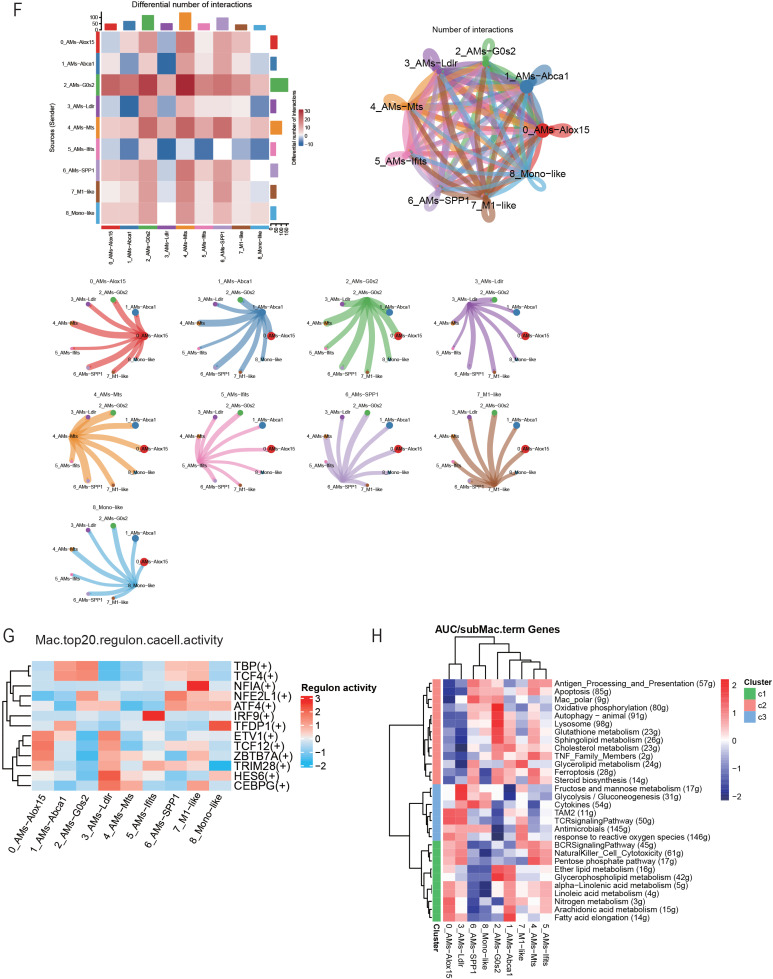
Results: The immune environment of cells, including dendritic cells and specific macrophage subclusters, exhibited increased function during the early stage of pulmonary tissue damage. Nine different subpopulations were identified that perform multiple functional roles, including immune responses, pulmonary tissue repair, cellular metabolic cycle, and cholesterol metabolism. Additionally, we found that individual macrophage subpopulations dominate the cell-cell communication landscape. Moreover, pseudo-time trajectory analysis suggested that proliferating macrophage clusters exerted multiple functional roles.
Conclusion: Our findings demonstrate that the bronchoalveolar immune microenvironment is a fundamental aspect of the immune response dynamics involved in the pathogenesis and recovery of CALI.
Keywords: chemically induced acute lung injury; heterogeneity; immune microenvironment; phenotypes; phosgene-inhalation; single cell RNAseq.
© 2023 Cao et al.
Conflict of interest statement
The authors report no conflicts of interest in this work.
Figures
Similar articles
-
Single-Cell RNA-Sequencing Reveals Epithelial Cell Signature of Multiple Subtypes in Chemically Induced Acute Lung Injury.Int J Mol Sci. 2022 Dec 23;24(1):277. doi: 10.3390/ijms24010277. Int J Mol Sci. 2022. PMID: 36613719 Free PMC article.
-
Characteristics of alveolar macrophages in bronchioalveolar lavage fluids from active tuberculosis patients identified by single-cell RNA sequencing.J Biomed Res. 2022 May 28;36(3):167-180. doi: 10.7555/JBR.36.20220007. J Biomed Res. 2022. PMID: 35635159 Free PMC article.
-
Metabolic Landscape of Bronchoalveolar Lavage Fluid in Coronavirus Disease 2019 at Single Cell Resolution.Front Immunol. 2022 Mar 8;13:829760. doi: 10.3389/fimmu.2022.829760. eCollection 2022. Front Immunol. 2022. PMID: 35350779 Free PMC article.
-
[Deep lung--cellular reaction to HIV].Rev Port Pneumol. 2007 Mar-Apr;13(2):175-212. Rev Port Pneumol. 2007. PMID: 17492233 Review. Portuguese.
-
The role of exosomes from BALF in lung disease.J Cell Physiol. 2022 Jan;237(1):161-168. doi: 10.1002/jcp.30553. Epub 2021 Aug 13. J Cell Physiol. 2022. PMID: 34388259 Free PMC article. Review.
Cited by
-
Characteristics of phosgene aspiration lung injury analyzed based on transcriptomics and proteomics.Front Genet. 2024 May 17;15:1393665. doi: 10.3389/fgene.2024.1393665. eCollection 2024. Front Genet. 2024. PMID: 38826806 Free PMC article.
-
Identification of mitochondria-related biomarkers for acute respiratory distress syndrome.Sci Rep. 2025 Aug 2;15(1):28221. doi: 10.1038/s41598-025-13448-8. Sci Rep. 2025. PMID: 40753320 Free PMC article.
References
-
- Summerhill EM, Hoyle GW, Jordt SE, et al. An Official American Thoracic Society Workshop Report: chemical inhalational disasters. Biology of lung injury, development of novel therapeutics, and medical preparedness. Ann Am Thorac Soc. 2017;14:1060–1072. doi:10.1513/AnnalsATS.201704-297WS - DOI - PMC - PubMed
-
- Boor PJ, Gotlieb AI, Joseph EC, Kerns WD, Roth RA, Tomaszewski KE. Chemical-induced vasculature injury. Summary of the symposium presented at the 32nd annual meeting of the Society of Toxicology, New Orleans, Louisiana, March 1993. Toxicol Appl Pharmacol. 1995;132:177–195. doi:10.1006/taap.1995.1098 - DOI - PubMed
LinkOut - more resources
Full Text Sources
