Chromatin accessibility landscapes revealed the subgenome-divergent regulation networks during wheat grain development
- PMID: 37220536
- PMCID: PMC10199822
- DOI: 10.1007/s42994-023-00095-8
Chromatin accessibility landscapes revealed the subgenome-divergent regulation networks during wheat grain development
Abstract
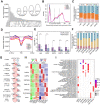
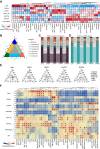
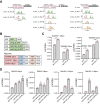
Development of wheat (Triticum aestivum L.) grain mainly depends on the processes of starch synthesis and storage protein accumulation, which are critical for grain yield and quality. However, the regulatory network underlying the transcriptional and physiological changes of grain development is still not clear. Here, we combined ATAC-seq and RNA-seq to discover the chromatin accessibility and gene expression dynamics during these processes. We found that the chromatin accessibility changes are tightly associated with differential transcriptomic expressions, and the proportion of distal ACRs was increased gradually during grain development. Specific transcription factor (TF) binding sites were enriched at different stages and were diversified among the 3 subgenomes. We further predicted the potential interactions between key TFs and genes related with starch and storage protein biosynthesis and found different copies of some key TFs played diversified roles. Overall, our findings have provided numerous resources and illustrated the regulatory network during wheat grain development, which would shed light on the improvement of wheat yields and qualities.
Supplementary information: The online version contains supplementary material available at 10.1007/s42994-023-00095-8.
Keywords: Chromatin accessibility; Grain development; Regulatory network; Subgenome-divergence; Wheat.
© The Author(s) 2023.
Conflict of interest statement
Conflict of interestThe authors declare that they have no conflict of interest.
Figures


Similar articles
-
Low-affinity SPL binding sites contribute to subgenome expression divergence in allohexaploid wheat.Sci China Life Sci. 2023 Apr;66(4):819-834. doi: 10.1007/s11427-022-2202-3. Epub 2022 Nov 18. Sci China Life Sci. 2023. PMID: 36417050
-
Differential representation of albumins and globulins during grain development in durum wheat and its possible functional consequences.J Proteomics. 2017 Jun 6;162:86-98. doi: 10.1016/j.jprot.2017.05.004. Epub 2017 May 3. J Proteomics. 2017. PMID: 28478307
-
N6-Methyladenosine dynamic changes and differential methylation in wheat grain development.Planta. 2022 May 14;255(6):125. doi: 10.1007/s00425-022-03893-4. Planta. 2022. PMID: 35567638
-
Uncovering the transcriptional regulatory network involved in boosting wheat regeneration and transformation.Nat Plants. 2023 Jun;9(6):908-925. doi: 10.1038/s41477-023-01406-z. Epub 2023 May 4. Nat Plants. 2023. PMID: 37142750
-
Molecular prospective on the wheat grain development.Crit Rev Biotechnol. 2023 Feb;43(1):38-49. doi: 10.1080/07388551.2021.2001784. Epub 2021 Dec 29. Crit Rev Biotechnol. 2023. PMID: 34965821 Review.
Cited by
-
Comparative Analysis Reveals Different Evolutionary Fates and Biological Functions in Wheat Duplicated Genes (Triticum aestivum L.).Plants (Basel). 2023 Aug 22;12(17):3021. doi: 10.3390/plants12173021. Plants (Basel). 2023. PMID: 37687268 Free PMC article.
-
Epigenetic Regulation of Nitrogen Signaling and Adaptation in Plants.Plants (Basel). 2023 Jul 21;12(14):2725. doi: 10.3390/plants12142725. Plants (Basel). 2023. PMID: 37514337 Free PMC article. Review.
-
LOGOWheat: deep learning-based prediction of regulatory effects for noncoding variants in wheats.Brief Bioinform. 2024 Nov 22;26(1):bbae705. doi: 10.1093/bib/bbae705. Brief Bioinform. 2024. PMID: 39789857 Free PMC article.
-
Epigenomic and 3D genomic mapping reveals developmental dynamics and subgenomic asymmetry of transcriptional regulatory architecture in allotetraploid cotton.Nat Commun. 2024 Dec 27;15(1):10721. doi: 10.1038/s41467-024-55309-4. Nat Commun. 2024. PMID: 39730363 Free PMC article.
-
Dynamic Chromatin Accessibility and Gene Expression Regulation During Maize Leaf Development.Genes (Basel). 2024 Dec 20;15(12):1630. doi: 10.3390/genes15121630. Genes (Basel). 2024. PMID: 39766899 Free PMC article.
References
-
- Adamski NM, Simmonds J, Brinton JF, Backhaus AE, Chen Y, Smedley M, Hayta S, Florio T, Crane P, Scott P, et al. Ectopic expression of Triticum polonicum VRT-A2 underlies elongated glumes and grains in hexaploid wheat in a dosage-dependent manner. Plant Cell. 2021;33:2296–2319. doi: 10.1093/plcell/koab119. - DOI - PMC - PubMed
-
- Castro-Mondragon JA, Riudavets-Puig R, Rauluseviciute I, Lemma RB, Turchi L, Blanc-Mathieu R, Lucas J, Boddie P, Khan A, Manosalva Perez N, et al. JASPAR 2022: the 9th release of the open-access database of transcription factor binding profiles. Nucl Acids Res. 2022;50:D165–D173. doi: 10.1093/nar/gkab1113. - DOI - PMC - PubMed
LinkOut - more resources
Full Text Sources
Molecular Biology Databases
Miscellaneous
