. 2023 Jun 22;186(13):2802-2822.e22.
doi: 10.1016/j.cell.2023.04.031. Epub 2023 May 22.

C5a-licensed phagocytes drive sterilizing immunity during systemic fungal infection

Affiliations

C5a-licensed phagocytes drive sterilizing immunity during systemic fungal infection

Jigar V Desai et al. Cell. .

Abstract

Systemic candidiasis is a common, high-mortality, nosocomial fungal infection. Unexpectedly, it has emerged as a complication of anti-complement C5-targeted monoclonal antibody treatment, indicating a critical niche for C5 in antifungal immunity. We identified transcription of complement system genes as the top biological pathway induced in candidemic patients and as predictive of candidemia. Mechanistically, C5a-C5aR1 promoted fungal clearance and host survival in a mouse model of systemic candidiasis by stimulating phagocyte effector function and ERK- and AKT-dependent survival in infected tissues. C5ar1 ablation rewired macrophage metabolism downstream of mTOR, promoting their apoptosis and enhancing mortality through kidney injury. Besides hepatocyte-derived C5, local C5 produced intrinsically by phagocytes provided a key substrate for antifungal protection. Lower serum C5a concentrations or a C5 polymorphism that decreases leukocyte C5 expression correlated independently with poor patient outcomes. Thus, local, phagocyte-derived C5 production licenses phagocyte antimicrobial function and confers innate protection during systemic fungal infection.

Keywords: C5; C5aR1; Candida; avacopan; candidemia; candidiasis; complement; eculizumab; kidney.


Conflict of interest statement

Declaration of interests The authors declare no competing interests.

Figures
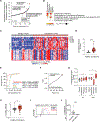
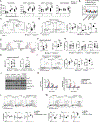
Figure 1.
Figure 1.. Induced transcription of complement genes in human whole blood is predictive of candidemia. See also Table S1.
(A) Enriched Hallmark and Canonical MSigDB pathways in blood transcriptomes of candidemic patients compared to healthy controls, ranked by normalized enrichment score (NES). Red denotes complement pathways. Data sourced from GSE176262. (B) Dot plot comparing enrichment of complement pathways in patients with candidemia, bacterial or viral infection or systemic inflammatory response syndrome (SIRS) compared to healthy controls. Shown are NES and FDR p-values. (C) Heatmap showing the 79-gene complement module enriched in candidemic patients compared to healthy donors, defined as the leading edge genes of the pathways indicated in red in A. Select genes are labeled. (D) Mean expression of the complement module in candidemic patients compared to healthy donors. (E) Receiver operating characteristic curve showing the performance of the complement module to distinguish candidemic patients, or patients with viral or bacterial infection or SIRS, from healthy donors. Area-under-the-curve (AUC) statistics and P values are shown. (F) Plot depicting all 2545 pathways annotated in MSigDB to distinguish candidemic patients from healthy donors, ranked by AUC. Indicated is the position of the complement module identified. (G) Mean expression of the complement module in RNA-seq of healthy donor PBMCs challenged ex vivo with the indicated fungi. Data sourced from GSE162746. (H) Mean expression of C5 mRNA in whole blood leukocytes in candidemic patients compared to healthy donors. (I) Representative FACS histogram showing intracellular C5 protein levels in healthy donor monocytes post-stimulation with heat-killed Candida. (J) Quantification of intracellular C5 protein in healthy donor monocytes post-stimulation with the indicated fungi (n=6), shown as mean fluorescence intensity difference between stimulated and unstimulated samples. *P<0.05, **P<0.01, ****p<0.0001; unpaired t-test (D), one-way ANOVA Brown-Forsythe corrected for multiple comparisons (G), Mann-Whitney U-test (H), Wilcoxon signed-rank test (J).
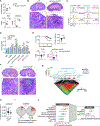
Figure 2.
Figure 2.. C5a-C5aR1 signaling on phagocytes mediates fungal clearance and host survival during systemic candidiasis. See also Figures S1–S2 and Table S2.
(A) Normalized enrichment scores (NES) for MSigDB pathways enriched in Candida-infected kidneys. Red denotes complement pathways. Top panel shows ranks of highest-enriched complement pathways among all pathways. Data sourced from GSE56092. (B) Enrichment plot for the “KEGG Complement and coagulation cascades” pathway. (C) Heatmap showing expression of transcripts, in RPKM, at the leading edge in “B”. (D) Survival of vehicle or C5a-treated WT mice post-infection (n=10–11). (E) Survival of WT and C5ar1−/− mice post-infection (n=15). (F) Renal fungal burden (n=8). (G) Serum blood urea nitrogen (BUN) and creatinine (day 3; n=4). (H) Histopathology. Representative PAS-stained kidney sections (day 3). (I-J) Survival (I, left; n=16–32), renal fungal burden (I, middle; day 3 for Lyz2-CretgC5ar1fl/fl, Cx3cr1-CretgC5ar1fl/fl; day 6 for S100a8-CretgC5ar1fl/fl; n=8–14), serum creatinine (I, right; n=4–7) and renal histopathology (J); representative PAS-stained kidney sections. Scale-bars (for H,J): 1 mm (upper), 50 μm (lower). *P<0.05, **P<0.01, ***P<0.005, ****P<0.0001; log-rank test (D-E; I), 2-way ANOVA with Sidak’s multiple comparisons (F), unpaired t-test (G; I, creatinine), Mann-Whitney U-test (I, fungal burden).
Figure 3.
Figure 3.. C5aR1 is dispensable for phagocyte trafficking into the kidney but mediates macrophage accumulation and survival. See also Figures S3–S4.
(A) Numbers of renal phagocytes post-infection (n=6–11). (B) Relative accumulation of CD45.1+WT and CD45.2+C5ar1−/− neutrophils and monocytes in blood and kidneys of mixed BM radiation chimeras (day 3; n=5). (C-D) Representative FACS plots (left) and summary data (right) of (C) Indo-1+ dead renal macrophages (day 1; n=12), and (D) annexin V+PI apoptotic, PI+ dead, and annexin VPI viable renal macrophages (day 1; n=7). (E-F) Representative histograms (E) and mean fluorescence intensity (MFI) summary data (F) for cleaved caspase-3 and Bax in renal macrophages (day 1; n=8). (G-H) Summary data of apoptotic, dead, and viable renal macrophages (G) and MFI summary data for cleaved caspase-3 and Bax in mixed BM radiation chimeras (H) (day 3). (I) Representative FACS plots (left) and summary data (right) of apoptotic, dead, and viable BM-derived macrophages after Candida co-culture (n=6). (J-K) Immunoblot analysis of indicated proteins in WT BM-derived macrophages post-stimulation with indicated stimuli. Representative immunoblot images (J) and quantified pixel density values (K) are shown. (L-M) Representative FACS plots (top) and summary data (bottom) of apoptotic, dead, and viable WT BM-derived macrophages (n=6), following indicated treatments (U0126, ERK1/2 inhibitor; AS252424, PI3K/AKT inhibitor). *P<0.05, **P<0.01, ***P<0.005, ****P<0.0001; Mann-Whitney U-test (A, neutrophils and Ly6Clo monocytes at days 1 and 3; Ly6Chi monocytes at day 1; macrophages; F, Bax), Welch’s t-test (A, Ly6Chi monocytes at day 3), unpaired t-test (F, cleaved caspase-3; I), paired t-test (G, H), 2-way ANOVA with Dunnette’s multiple comparisons (K), one-way ANOVA with Dunnette’s multiple comparisons (L-M).
Figure 4.
Figure 4.. C5aR1 mediates fungal uptake by neutrophils and killing by macrophages. See also Figures S4–S5.
(A-C) Left, representative FACS plots for neutrophils (A), Ly6Chi monocytes (B), and macrophages (C) in association with AF633+dTomato dead or AF633+dTomato+ viable Candida in WT and C5ar1−/− kidneys. Right, summary data of % of cells associating with Candida (live+dead Candida) and % of dead Candida within phagocytes (n=8–10). (D) Candida killing by FACS-sorted renal macrophages (n=6–8). (E and H) Snapshots of kidney intravital imaging at the indicated timepoints post-infection. Yellow arrowheads mark Candida associated with neutrophils/macrophages; White arrowheads mark Candida in the C5ar1−/− kidney unassociated with neutrophils/macrophages (see also Movie S1). Scale-bars: 50 μm (E), 15 μm (H). (F) Pooled data from WT and C5ar1−/− mice depicting % of Candida stably associated with renal neutrophils/macrophages between 30 and 60 min post-infection (n=6–8). (G) Individual fungal cells associated with macrophages (as quantified under “F”), were enumerated to indicate whether they exhibited growth or not. (I) Growth rate for filamentous hyphae/hour for individual fungal cells associated with neutrophils/macrophages. (J) Pooled data from WT and C5ar1−/− mice depicting % of Candida germinating into hyphae between 30 and 60 min post-infection (n=6–8). (K-L) Candida uptake by BM neutrophils and killing by BM-derived macrophages (n=6–8). (M) Candida uptake by human neutrophils and killing by human macrophages (n=5–6). *P<0.05, **P<0.01, ***P<0.005, ****P<0.0001; unpaired t-test (A, %Ca killing; B; K, BM-derived macrophages), Welch’s t-test (A, %Ca association; K, BM neutrophils), paired t-test (L, M), Mann-Whitney U-test (D, J), Fisher’s exact test (G) one-way ANOVA with Tukey’s multiple comparisons (F, I).
Figure 5.
Figure 5.. Enhanced mTORC1-associated metabolic rewiring in C5ar1−/− macrophages correlates with susceptibility to systemic candidiasis. See also Figure S6 and Table S3.
(A) Enriched MSigDB Hallmark pathways, based on GSEA of RNA-seq data from renal macrophages (day 2; n=4/group). (B) Representative histograms and mean fluorescence intensity (MFI) summary data for phospho-S6 and Glut1 in renal macrophages (day 2; n=7–8). (C) Extracellular flux analysis of renal macrophages (day 1). Left, extracellular acidification rate (ECAR) and oxygen consumption rate (OCR) at baseline and after injection of opsonized heat-killed Candida (HK-Ca), depicted by the solid line. Right, area under the curve for ECAR and OCR. Data are pooled from two experiments. (D-J) Rapamycin or vehicle were administered in C5ar1−/− mice starting at day 1 post-infection. For (H-J), mice were infected with the rapamycin-resistant Candida rbp1Δ/Δ. (D, I) MFI summary data of the indicated proteins in C5ar1−/− renal macrophages (day 2). (E, H) Representative FACS plots and summary data of annexin V+PI apoptotic, PI+ dead, and annexin VPI viable renal macrophages from vehicle or rapamycin-treated C5ar1−/− mice (day 2; n=3–5). (F, J) Survival of C5ar1−/− mice post-infection (n=10). (G, J) Serum BUN and creatinine (day 2; n=3–4). (K) Representative FACS plots (left) and summary data (right) of apoptotic, dead, and viable BM-derived macrophages after ex vivo co-culturing with Candida rbp1Δ/Δ (n=6). Quantitative data are means ±SEM. *P<0.05, **P<0.01, ***P<0.005, ****P<0.0001; unpaired t-test (B; E; D; G; I; J, BUN/creatinine), 2-way ANOVA with Bonferroni’s’ multiple comparisons (C), log-rank test (F; J).
Figure 6:
Figure 6:. Local C5 production by phagocytes is critical for renal antifungal defense. See also Figure S6.
(A-B) Albumin-Cretg/C5fl/fl and C5fl/fl mice were evaluated at day 2 post-infection. (A) Renal fungal burden, serum BUN and creatinine concentrations (n=3–4). Data are from one of two experiments with similar patterns of results. (B) Histopathology. Representative PAS-stained kidney sections. (C-D) C5 expression in renal leukocytes. (C) Representative FACS. “Red” and “Blue” histograms indicate C5 expression in infected (day 1) and uninfected YFP-C5fl/fl reporter mice, respectively; shaded histograms represent infected non-YFP control mice (n=6–7). (D) Summary data of C5-YFP mean fluorescence intensity, normalized to non-YFP controls of each leukocyte subset. (E-F) Lyz2-Cretg/C5fl/fl and C5fl/fl mice were evaluated at day 2 post-infection. (E) Survival, renal fungal burden, and serum BUN and creatinine concentrations (n=7–18). (F) Histopathology. Representative PAS-stained kidney sections. (G) Manhattan plot depicting significant cis expression quantitative loci (eQTL). x-axis marks chromosome 9 location, where select genes including C5 are labeled. y-axis displays −log10 bonferroni P values. The dots represent eQTL, blue denotes eQTL with P<10, and red denotes C5 SNP rs2269067. The bottom linkage diseqillibrium (LD) plot shows LD analysis of highly-significant eQTL (P<10) and depicts C5 SNP rs2269067 to be in strong LD with other top-enriched eQTL affecting C5 expression. Data sourced from eQTLgen. (H) C5 transcripts in PBMCs of healthy donors with or without C5 SNP rs2269067. (I) Pie chart depicting % of candidemic patients with or without C5 SNP rs2269067 that exhibited persistent fungemia. (J) Forest plots showing odds ratios in univariate and multivariate analyses; horizontal bars, 95% CI. Scale-bars (for B,F): 1 mm (upper), 50 μm (lower). Quantitative data are means ±SEM. *P<0.05, **P<0.01, ***P<0.005, ****P<0.0001; unpaired t-test (A, BUN/creatinine; E, creatinine), Mann-Whitney U-test (A,E, fungal burden; E, BUN; H), 2-way ANOVA with Holm-Sidak’s multiple comparisons (D), Fisher’s exact test (I).
Figure 7.
Figure 7.. Lower serum C5a concentrations independently correlate with mortality in candidemic patients. See also Tables S4–S7.
(A) Serum C5a concentrations from healthy donors (n=33), candidemic patients (n=174), and non-candidemic hospitalized patients (n=103). (B) Forest plots showing hazard ratios in univariate and multivariate analyses; horizontal bars, 95% CI. (C) Survival of candidemic patients with C5alo (<34.7 ng/mL) or C5ahi (≥34.7 ng/mL) status. ****P<0.0001; Kruskal-Wallis test with Dunn’s test for multiple comparisons (A), Log-rank test (C).

References

    1. Bongomin F, Gago S, Oladele R, and Denning D (2017). Global and Multi-National Prevalence of Fungal Diseases—Estimate Precision. Journal of Fungi 3, 57. - PMC - PubMed
    1. Pappas PG, Lionakis MS, Arendrup MC, Ostrosky-Zeichner L, and Kullberg BJ (2018). Invasive candidiasis. Nat Rev Dis Primers 4, 18026. 10.1038/nrdp.2018.26. - DOI - PubMed
    1. Socié G, Caby-Tosi M-P, Marantz JL, Cole A, Bedrosian CL, Gasteyger C, Mujeebuddin A, Hillmen P, Vande Walle J, and Haller H (2019). Eculizumab in paroxysmal nocturnal haemoglobinuria and atypical haemolytic uraemic syndrome: 10-year pharmacovigilance analysis. British Journal of Haematology 185, 297–310. 10.1111/bjh.15790. - DOI - PMC - PubMed
    1. Jodele S, Dandoy CE, Lane A, Laskin BL, Teusink-Cross A, Myers KC, Wallace G, Nelson A, Bleesing J, Chima RS, et al. (2020). Complement blockade for TA-TMA: lessons learned from a large pediatric cohort treated with eculizumab. Blood 135, 1049–1057. 10.1182/blood.2019004218. - DOI - PMC - PubMed
    1. Federal-Drug-Administration. Eculizumab FDA label (https://www.accessdata.fda.gov/spl/data/68907414-19b7-43c7-be48-9768bb97...).

Publication types

Supplementary concepts