. 2023 Jun 21;14(6):447-463.e8.
doi: 10.1016/j.cels.2023.04.007. Epub 2023 May 22.

A multi-scale map of protein assemblies in the DNA damage response

Affiliations

A multi-scale map of protein assemblies in the DNA damage response

Anton Kratz et al. Cell Syst. .

Abstract

The DNA damage response (DDR) ensures error-free DNA replication and transcription and is disrupted in numerous diseases. An ongoing challenge is to determine the proteins orchestrating DDR and their organization into complexes, including constitutive interactions and those responding to genomic insult. Here, we use multi-conditional network analysis to systematically map DDR assemblies at multiple scales. Affinity purifications of 21 DDR proteins, with/without genotoxin exposure, are combined with multi-omics data to reveal a hierarchical organization of 605 proteins into 109 assemblies. The map captures canonical repair mechanisms and proposes new DDR-associated proteins extending to stress, transport, and chromatin functions. We find that protein assemblies closely align with genetic dependencies in processing specific genotoxins and that proteins in multiple assemblies typically act in multiple genotoxin responses. Follow-up by DDR functional readouts newly implicates 12 assembly members in double-strand-break repair. The DNA damage response assemblies map is available for interactive visualization and query (ccmi.org/ddram/).

Keywords: DNA damage response; double-strand break repair; multi-omics; protein assemblies; protein networks; single-strand break repair; systems biology; visualization.


Conflict of interest statement

Declaration of interests T.I. is co-founder of Data4Cure, Inc., is on the Scientific Advisory Board, and has an equity interest. T.I. is on the Scientific Advisory Board of Ideaya BioSciences, Inc. and has an equity interest. The terms of these arrangements have been reviewed and approved by the University of California San Diego in accordance with its conflict of interest policies. R.W.S. is co-founder of Canal House Biosciences, LLC, is on the Scientific Advisory Board, and has an equity interest. N.J.K. is a shareholder of Tenaya Therapeutics and has received stocks from Maze Therapeutics and Interline Therapeutics; has consulting agreements with the Icahn School of Medicine at Mount Sinai, New York, Maze Therapeutics and Interline Therapeutics. The laboratory of N.J.K. has received research support from Vir Biotechnology and F. Hoffmann-La Roche.

Figures

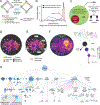
Figure 1.
Figure 1.. Overview.
(A) AP-MS screen for protein interactions with DDR proteins in different cell lines and before/after DNA damage induction. (B) Collection of data sets representing four classes of interaction evidence (columns), each consisting of specific data resources. Number of datasets contributed by each resource given in parentheses. BioGRID: Biological General Repository for Interaction Datasets, BioPlex: Biophysical Interactions of ORFeome-derived complexes, HuRI: Human Reference Interactome, huMap: Census of Human Soluble Protein Complexes, CCLE: Cancer Cell Line Encyclopedia, GDSC: Genomics of Drug Sensitivity in Cancer, TCGA: The Cancer Genome Atlas, GTEx: Genotype-Tissue Expression project, CPTAC: Clinical Proteomic Tumor Analysis Consortium, DepMap: Cancer Dependency Map. (C) Input feature networks are integrated into a proteome-wide weighted network of protein-protein association scores (DAS, see text). (D) Identification of hierarchically organized assemblies in the DAS network. Colors matched between network regions in panel C and corresponding assemblies in panel D.
Figure 2.
Figure 2.. Systematic measurement of DNA damage-induced protein networks.
(A) DDR-centric protein interaction network generated by AP-MS. Baits (black nodes) refer to affinity-tagged proteins, while preys (light blue nodes) refer to interacting protein partners identified when targeting these baits. Green, magenta or dashed edges represent interactions detected in untreated, etoposide-treated or both conditions, respectively. (B) Pie chart summarizing numbers of constitutive versus differential protein interactions detected. (C) Comparison of AP-MS network to interactions previously reported in public databases. (D) Top pie shows proportion of differential interactions that are not previously reported in databases. Bottom pie shows this proportion for constitutive interactions. (E) Enriched functions (Gene Ontology Biological Process) of prey proteins identified in the differential (black) versus constitutive (gray) interaction networks. Text in bold italics indicates GO terms found only in the respective group (differential or constitutive).
Figure 3.
Figure 3.. DNA Damage Response Assemblies Map (DDRAM).
(A) All previously collected published data sets as well as the new AP-MS data are integrated to create a unified DAS score using supervised machine learning. Following learning, the most important data types supporting an interaction can be revealed by the SHAP score. (B) For each human protein, a “DDR proximity” is computed as the mean DAS score against a set of canonical DDR proteins (see main text). Blue: distribution of DDR proximity scores for all proteins. Red: Distribution for canonical DDR proteins only. (C) Workflow to determine the number and annotation status of proteins in the DDRAM map. (D) DAS network for mismatch repair proteins. (E) Community detection reveals the hierarchical structure of protein assemblies, leveraging quantitative DAS information. (F) LEFT: Kaleidoscopic nested circle layout. Circles represent proteins (smallest) or protein assemblies (all other sizes). Assembly labels are assigned by alignment to DDR reference databases. RIGHT: Same nested structure of protein assemblies visualized as a multi-scale hierarchy. (G) Multi-scale hierarchical layout of DDRAM. Names shown for selected assemblies only. The full set of named assemblies is available at ccmi.org/ddram/.
Figure 4.
Figure 4.. Comparison to DDR reference pathways and analysis of contributing data types.
(A) Alignment (Jaccard fraction, blue-to-red colorbar) between DDRAM assemblies (rows) and reference DDR pathways documented by (columns). Area with highest agreement magnified at right. (B) Four DDRAM miniatures showing importance of each data type (grayscale intensity) to protein assemblies (nodes). Assemblies discussed in text are labeled. (C) DDRAM miniature with node color showing the fraction of interactions contributed to each assembly by the DDR-centered AP-MS data from this study. (D,E) Protein interaction networks for selected assemblies with high level of AP-MS support. (F) DDRAM miniature showing correspondence of DDRAM assemblies with independent protein-protein interactions from the OpenCell project. Bold ring: significant enrichment by hypergeometric test, Benjamini Hochberg FDR ≤ 0.1.
Figure 5.
Figure 5.. Association of protein assemblies with genotoxin functional dependencies.
(A) Dependence of genotoxin responses on DDRAM protein assemblies. Proteins for which genetic knockout causes sensitivity or resistance to each agent (rows) were measured previously by genome-wide CRISPR/Cas9. Significant aggregation of these dependencies in DDRAM assemblies (columns) is shown by hypergeometric enrichment (p-value, heatmap color). Two-dimensional clustering reveals six major groups of agents (left border colors). (B) DDRAM miniature showing assembly-to-agent mappings. Agent clusters from panel A. (C) Detailed genotoxin dependency profiles for selected gene knockouts impacting the Fanconi Anemia core assembly (FA, left columns) or chromatin regulator assembly (right columns). For each knockout, the relative sensitivity (positive z-scores, purple shades) or resistance (negative z-scores, orange shades) across agents (rows) is shown. (D) Relationship between a protein’s number of assemblies and the number of dependent agent responses. Contingency table (left) shows that proteins in multiple assemblies have ~4X higher odds of conferring a requirement for processing multiple genotoxic agents. Box-and-whiskers plots (right) provide a complementary view of the same data. The middle line shows the median. The lower and upper hinges correspond to the 25th and 75th percentiles. Upper and lower whiskers extend from the hinge to the largest and lowest value no further than 1.5 time the interquartile range, respectively. Analysis excludes DDRAM proteins that are essential and thus not covered by the chemogenetic screens. (E) DDRAM miniature showing locations of NBN and PCNA, two multi-assembly / multi-agent proteins.
Figure 6.
Figure 6.. Function in single- and double-strand DNA breaks.
(A) DDRAM map highlighting assemblies from which proteins were sampled for functional testing. (B) Recruitment analysis of fluorescently tagged proteins after induction of single-stranded DNA breaks by 405nm laser-induced microirradiation. Selected proteins tagged with enhanced green fluorescent protein (EGFP). (C) Confocal fluorescent microscopy images showing EGFP intensity dynamics following laser microirradiation. Scale bar 10μm. (D) Peak recruitment intensity for EGFP-tagged proteins. Positive signals were observed for BER-related proteins (orange); *p ≤ 0.05, **p ≤ 0.001, NS=not significant. (E) Assay for Homology Directed Repair (HDR) activity in repair of DNA double-strand breaks. As HDR works to restore a functional GFP, fluorescence intensity correlates with relative HDR efficiency. I-SceI: cut site for Intron-encoded restriction endonuclease from Saccharomyces cerevisiae mitochondria. SceGFP: GFP gene cassette interrupted by I-SceI site. iGFP: internal fragment of GFP gene. (F) Assay for single-strand annealing (SSA) activity in repair of DNA double-strand breaks. ΔI-SceI: deletion of I-SceI site. Panels E-F adapted from . (G) Scoring of HDR and SSA reporters using fluorescence microscopy and image analysis. The scale bar for “Collection of imaging data” is 1mm; the scale bar for “Isolate non-reporter channel” is 25μm. (H) HDR activity after indicated siRNA knockdowns. Knockdown of BRCA1 is expected to decrease activity (control −), whereas knockdown of RIF1, an NHEJ factor, increases reliance on HDR (control +); NTC, non-targeting control (control 0). *p ≤ 0.05, **p ≤ 0.01, ***p ≤ 0.001 versus NTC by Mann-Whitney U Test. (I) SSA activity for gene siRNA knockdowns. Knockdown of BRCA2 is expected to direct resected DNA to the SSA pathway, increasing SSA activity (control +). Other controls and notation as for panel I. (J) Genes selected for HDR/SSA analysis and summary of results.
Figure 7.
Figure 7.. Interactive visualization of DDRAM.
(A) Visualization of the hierarchical multi-scale structure of DDRAM as a circle packing layout. Protein assemblies appear as circles. Containment of one circle by another represents containment of one assembly by another. Blue shading indicates depth of nesting (lighter, deeper nesting). (B) Data view shows the network underlying the currently selected assembly (FA cluster, orange circle outline in panel A). Protein color denotes sub-assembly structure (shown) or other properties such as curation status in literature-curated DDR databases. (C) Panel with advanced search functions for proteins and assemblies. Following a search for specific protein IDs, the matching proteins are highlighted in bright colors (red, green, orange in panel A). (D) Control panel for inspection and analysis of the selected assembly. Selecting the interaction between any given two proteins in panel B will display the respective SHAP analysis in panel D.

References

    1. Jackson SP, and Bartek J (2009). The DNA-damage response in human biology and disease. Nature 461, 1071–1078. 10.1038/nature08467. - DOI - PMC - PubMed
    1. Ciccia A, and Elledge SJ (2010). The DNA damage response: making it safe to play with knives. Mol. Cell 40, 179–204. 10.1016/j.molcel.2010.09.019. - DOI - PMC - PubMed
    1. Blackford AN, and Jackson SP (2017). ATM, ATR, and DNA-PK: The Trinity at the Heart of the DNA Damage Response. Mol. Cell 66, 801–817. 10.1016/j.molcel.2017.05.015. - DOI - PubMed
    1. Lowndes NF, and Murguia JR (2000). Sensing and responding to DNA damage. Curr. Opin. Genet. Dev 10, 17–25. 10.1016/s0959-437x(99)00050-7. - DOI - PubMed
    1. Stracker TH, Usui T, and Petrini JHJ (2009). Taking the time to make important decisions: the checkpoint effector kinases Chk1 and Chk2 and the DNA damage response. DNA Repair 8, 1047–1054. 10.1016/j.dnarep.2009.04.012. - DOI - PMC - PubMed

Publication types