. 2023 Aug 9;13(8):jkad112.
doi: 10.1093/g3journal/jkad112.

Beyond the reference: gene expression variation and transcriptional response to RNA interference in Caenorhabditis elegans

Affiliations

Beyond the reference: gene expression variation and transcriptional response to RNA interference in Caenorhabditis elegans

Avery Davis Bell et al. G3 (Bethesda). .

Abstract

Though natural systems harbor genetic and phenotypic variation, research in model organisms is often restricted to a reference strain. Focusing on a reference strain yields a great depth of knowledge but potentially at the cost of breadth of understanding. Furthermore, tools developed in the reference context may introduce bias when applied to other strains, posing challenges to defining the scope of variation within model systems. Here, we evaluate how genetic differences among 5 wild Caenorhabditis elegans strains affect gene expression and its quantification, in general and after induction of the RNA interference (RNAi) response. Across strains, 34% of genes were differentially expressed in the control condition, including 411 genes that were not expressed at all in at least 1 strain; 49 of these were unexpressed in reference strain N2. Reference genome mapping bias caused limited concern: despite hyperdiverse hotspots throughout the genome, 92% of variably expressed genes were robust to mapping issues. The transcriptional response to RNAi was highly strain- and target-gene-specific and did not correlate with RNAi efficiency, as the 2 RNAi-insensitive strains showed more differentially expressed genes following RNAi treatment than the RNAi-sensitive reference strain. We conclude that gene expression, generally and in response to RNAi, differs across C. elegans strains such that the choice of strain may meaningfully influence scientific inferences. Finally, we introduce a resource for querying gene expression variation in this dataset at https://wildworm.biosci.gatech.edu/rnai/.

Keywords: Caenorhabditis elegans; RNA interference; RNA-seq; expression variation; natural genetic diversity.


Conflict of interest statement

Conflicts of interest statement The authors declare no conflict of interest.

Figures

Fig. 1.
Fig. 1.
Genotype (strain) dominates expression variation across 5 C. elegans strains treated with RNAi targeting the genes par-1 and pos-1 or the empty vector control (n = 3 biological replicates in each condition in each strain). a) PCA of gene expression. PCs 1 vs 2 (left) and 2 vs 3 (right) of PCA of the 500 most variably expressed genes are plotted; the proportion of variance explained is noted on the axes. b) In the control condition, 34.2% of 15,654 nominally expressed genes are differentially expressed across strains (genome-wide adjusted P < 0.1 in a likelihood ratio test between models including and excluding the strain term); a subset of these (approximately 2.6% overall) are not expressed at all in at least 1 strain (in any condition, see text for details). Related Supplementary Material: Supplementary File 1 contains the genes differentially expressed based on strain. Supplementary File 2 contains the “off” genes identified as potentially unexpressed in 1 strain but expressed in others.
Fig. 2.
Fig. 2.
Improving confidence in differential expression calls by integrating DNA alignment data. a) The number of genes with low (<25% of the median) and missing (0 raw coverage) DNA alignment coverage (from CeNDR sequencing (Cook et al. 2017)) in each strain of the 18,589 genes included in the expression analysis. Strain note: CeNDR assessed DNA coverage in EG4349, the genetically identical isotype to EG4348. b) The total number of genes differentially expressed based on strain (likelihood ratio test of models including and excluding the strain term, genome-wide adjusted P < 0.1) and their overlap with genes classified as missing or low DNA coverage in any strain (417 are both differentially expressed across strains and low DNA coverage, hypergeometric enrichment test P = 9.8 × 10−46). Areas are proportional to the number of observations. c) The number of unexpressed “off” genes per strain, subset into 3 categories: called as turned off at the RNA level with high confidence; missing in the strain genome (0 raw coverage); and called with uncertainty, given low DNA sequence coverage (<25% but >0 median DNA coverage). Related Supplementary Material: Supplementary Fig. 2 shows DNA coverage distributions and cutoffs. Supplementary File 2 contains details on each “off” gene. Supplementary File 3 contains raw per-gene DNA sequence coverage estimates. Supplementary File 4 contains median-normalized per-gene DNA sequence coverage estimates. Supplementary File 5 contains the list of genes flagged as low DNA coverage. Supplementary Files 6 and 7 provide numerical summaries of “off” genes.
Fig. 3.
Fig. 3.
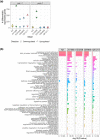
The transcriptional response to dsRNA is highly strain- and target-specific. a) The number of genes up- and downregulated in each strain upon par-1 and pos-1 dsRNA ingestion/RNAi induction. Genes were called differentially expressed if their shrunken absolute fold change was >1.5 and genome-wide adjusted P-value/FDR < 0.1. b) Gene set enrichment analysis results for genes upregulated on par-1 dsRNA in each strain. GO categories that were significantly enriched (false discovery rate Q < 0.1) in any strain are included. GO terms are ranked and colored by median significance across strains. Related Supplementary Material: Supplementary Fig. 6 shows volcano plots for RNAi treatments for each strain. Supplementary Fig. 7 contains Venn diagrams of overlap among strains in specific differentially expressed genes. Supplementary Fig. 8 shows results from the same gene set enrichment analysis of genes downregulated under par-1 RNAi and up- and downregulated under pos-1 RNAi. Supplementary Table 1 gives the number of up- and downregulated genes in each strain and included in each analysis. Supplementary File 8 contains the genes differentially expressed based on strain–treatment interaction. Supplementary File 9a–9j contains the genes differentially expressed in each strain in each RNAi treatment vs control. Supplementary File 10 gives all enriched GO categories.

Update of

References

    1. Aalto AP, Nicastro IA, Broughton JP, Chipman LB, Schreiner WP, Chen JS, Pasquinelli AE. Opposing roles of microRNA Argonautes during Caenorhabditis elegans aging. PLoS Genet. 2018;14(6):e1007379. doi: 10.1371/journal.pgen.1007379. - DOI - PMC - PubMed
    1. Ahringer J. Reverse genetics. WormBook. http://www.wormbook.org. doi:doi/10.1895/wormbook.1.47.1. 2006.
    1. Andersen EC, Gerke JP, Shapiro JA, Crissman JR, Ghosh R, Bloom JS, Felix MA, Kruglyak L. Chromosome-scale selective sweeps shape Caenorhabditis elegans genomic diversity. Nat Genet. 2012;44(3):285–290. doi: 10.1038/ng.1050. - DOI - PMC - PubMed
    1. Andersen EC, Rockman MV. Natural genetic variation as a tool for discovery in Caenorhabditis nematodes. Genetics. 2022;220(1):1. doi: 10.1093/genetics/iyab156. - DOI - PMC - PubMed
    1. Angeles-Albores D, Lee RYNL, Chan J, Sternberg PW. Tissue enrichment analysis for C. elegans genomics. BMC Bioinformatics. 2016;17(1):366. doi: 10.1186/s12859-016-1229-9. - DOI - PMC - PubMed

Publication types

Substances