

Impaired Speaking-Induced Suppression in Alzheimer's Disease
- PMID: 37221089
- PMCID: PMC10249944
- DOI: 10.1523/ENEURO.0056-23.2023
Impaired Speaking-Induced Suppression in Alzheimer's Disease
Abstract
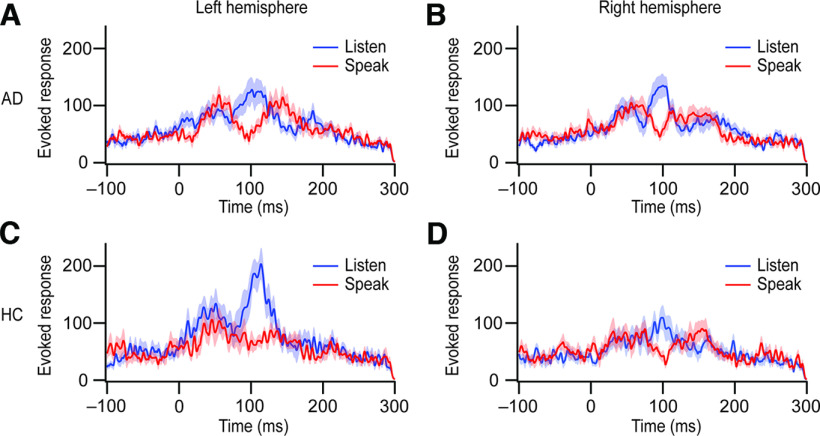
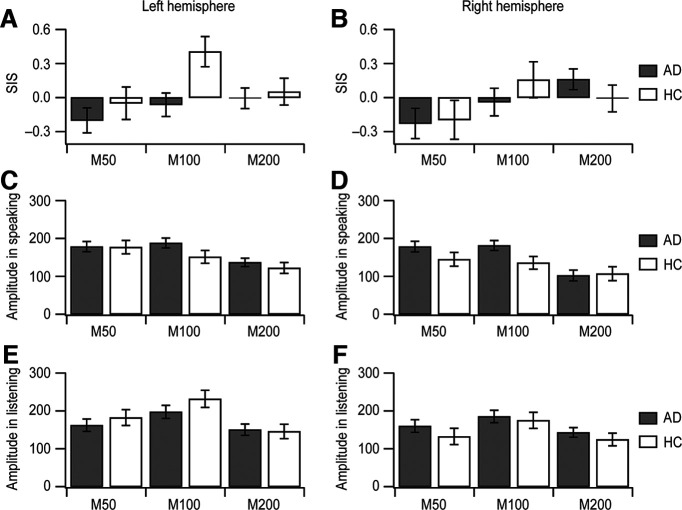
Alzheimer's disease (AD) is a neurodegenerative disease involving cognitive impairment and abnormalities in speech and language. Here, we examine how AD affects the fidelity of auditory feedback predictions during speaking. We focus on the phenomenon of speaking-induced suppression (SIS), the auditory cortical responses' suppression during auditory feedback processing. SIS is determined by subtracting the magnitude of auditory cortical responses during speaking from listening to playback of the same speech. Our state feedback control (SFC) model of speech motor control explains SIS as arising from the onset of auditory feedback matching a prediction of that feedback onset during speaking, a prediction that is absent during passive listening to playback of the auditory feedback. Our model hypothesizes that the auditory cortical response to auditory feedback reflects the mismatch with the prediction: small during speaking, large during listening, with the difference being SIS. Normally, during speaking, auditory feedback matches its predictions, then SIS will be large. Any reductions in SIS will indicate inaccuracy in auditory feedback prediction not matching the actual feedback. We investigated SIS in AD patients [n = 20; mean (SD) age, 60.77 (10.04); female (%), 55.00] and healthy controls [n = 12; mean (SD) age, 63.68 (6.07); female (%), 83.33] through magnetoencephalography (MEG)-based functional imaging. We found a significant reduction in SIS at ∼100 ms in AD patients compared with healthy controls (linear mixed effects model, F (1,57.5) = 6.849, p = 0.011). The results suggest that AD patients generate inaccurate auditory feedback predictions, contributing to abnormalities in AD speech.
Keywords: Alzheimer’s disease; efference copy; magnetoencephalography; speaking-induced suppression; state feedback control model.
Copyright © 2023 Kim et al.
Conflict of interest statement
The authors declare no competing financial interests.
Figures
References
Publication types
MeSH terms
Grants and funding
- F32 AG050434/AG/NIA NIH HHS/United States
- P01 AG019724/AG/NIA NIH HHS/United States
- K08 AG058749/AG/NIA NIH HHS/United States
- R01 DC010145/DC/NIDCD NIH HHS/United States
- K24 DC015544/DC/NIDCD NIH HHS/United States
- R21 NS076171/NS/NINDS NIH HHS/United States
- R01 DC017696/DC/NIDCD NIH HHS/United States
- R01 EB022717/EB/NIBIB NIH HHS/United States
- R01 NS100440/NS/NINDS NIH HHS/United States
- K23 AG038357/AG/NIA NIH HHS/United States
- RF1 NS050915/NS/NINDS NIH HHS/United States
- P50 DC019900/DC/NIDCD NIH HHS/United States