

Deconvolution of Plasma Pharmacokinetics from Dynamic Heart Imaging Data Obtained by Single Positron Emission Computed Tomography/Computed Tomography Imaging
- PMID: 37221092
- PMCID: PMC10289239
- DOI: 10.1124/jpet.122.001545
Deconvolution of Plasma Pharmacokinetics from Dynamic Heart Imaging Data Obtained by Single Positron Emission Computed Tomography/Computed Tomography Imaging
Abstract
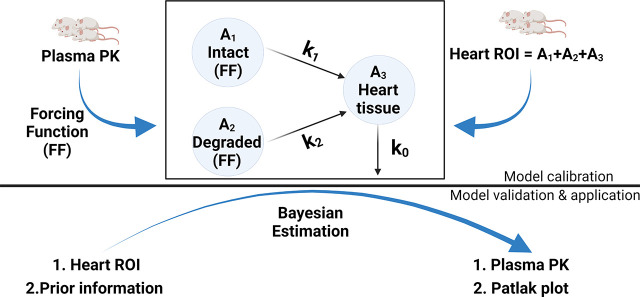
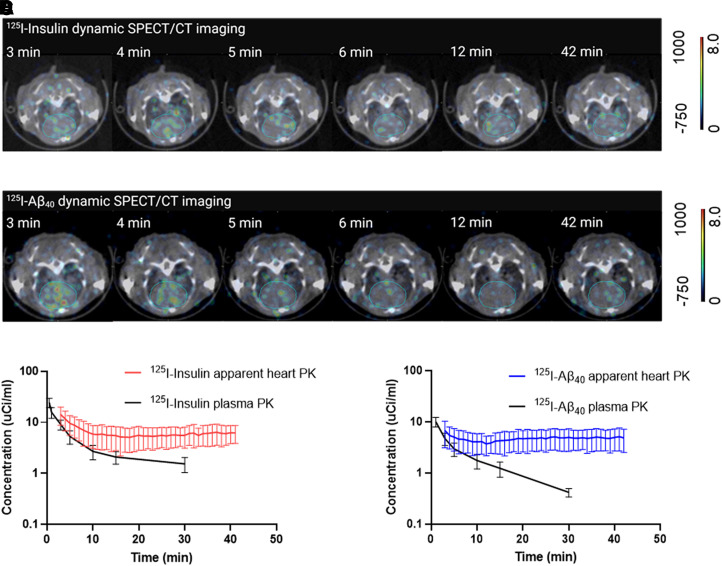
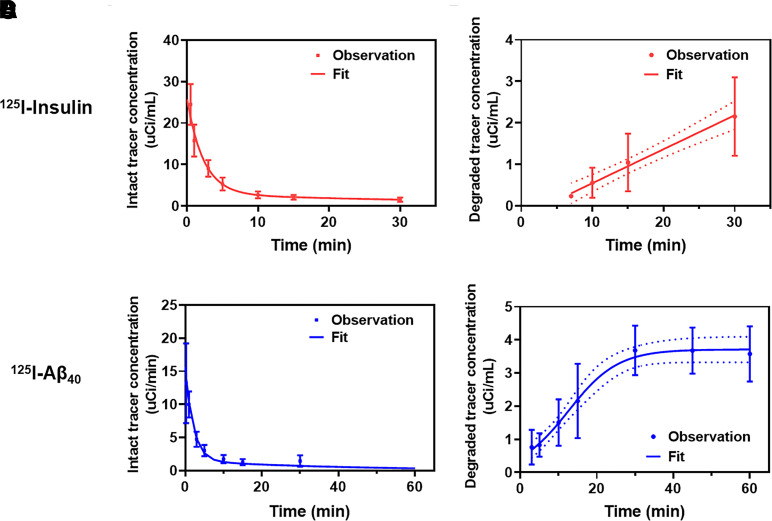
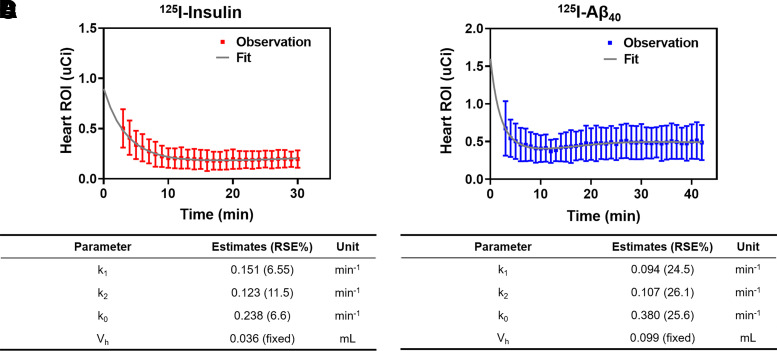
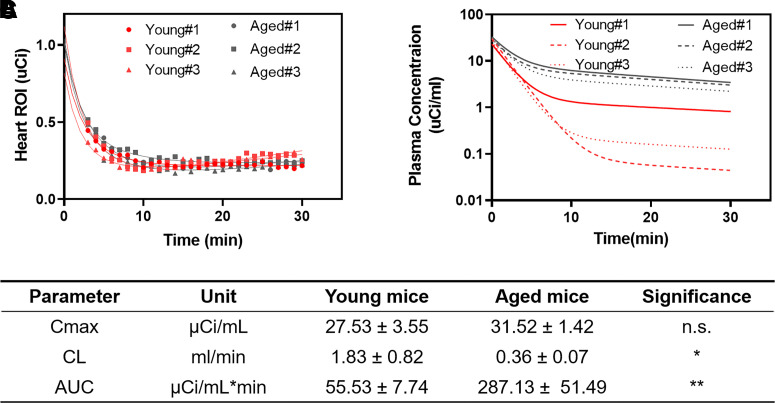
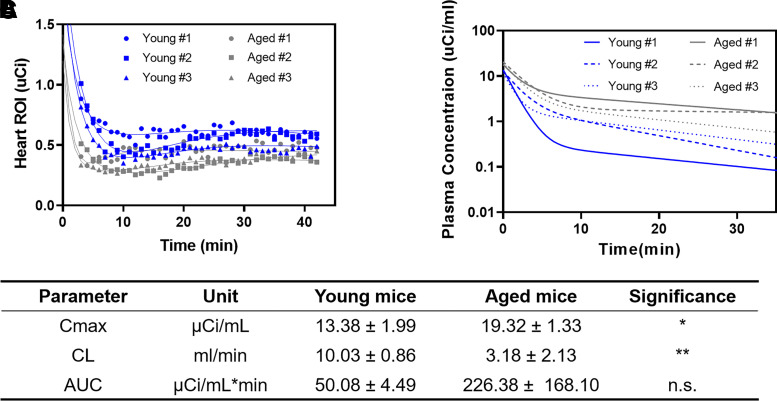
Plasma pharmacokinetic (PK) data are required as an input function for graphical analysis of single positron emission computed tomography/computed tomography (SPECT/CT) and positron emission tomography/CT (PET/CT) data to evaluate tissue influx rate of radiotracers. Dynamic heart imaging data are often used as a surrogate of plasma PK. However, accumulation of radiolabel in the heart tissue may cause overprediction of plasma PK. Therefore, we developed a compartmental model, which involves forcing functions to describe intact and degraded radiolabeled proteins in plasma and their accumulation in heart tissue, to deconvolve plasma PK of 125I-amyloid beta 40 (125I-Aβ 40) and 125I-insulin from their dynamic heart imaging data. The three-compartment model was shown to adequately describe the plasma concentration-time profile of intact/degraded proteins and the heart radioactivity time data obtained from SPECT/CT imaging for both tracers. The model was successfully applied to deconvolve the plasma PK of both tracers from their naïve datasets of dynamic heart imaging. In agreement with our previous observations made by conventional serial plasma sampling, the deconvolved plasma PK of 125I-Aβ 40 and 125I-insulin in young mice exhibited lower area under the curve than aged mice. Further, Patlak plot parameters extracted using deconvolved plasma PK as input function successfully recapitulated age-dependent plasma-to-brain influx kinetics changes. Therefore, the compartment model developed in this study provides a novel approach to deconvolve plasma PK of radiotracers from their noninvasive dynamic heart imaging. This method facilitates the application of preclinical SPECT/PET imaging data to characterize distribution kinetics of tracers where simultaneous plasma sampling is not feasible. SIGNIFICANCE STATEMENT: Knowledge of plasma pharmacokinetics (PK) of a radiotracer is necessary to accurately estimate its plasma-to-brain influx. However, simultaneous plasma sampling during dynamic imaging procedures is not always feasible. In the current study, we developed approaches to deconvolve plasma PK from dynamic heart imaging data of two model radiotracers, 125I-amyloid beta 40 (125I-Aβ 40) and 125I-insulin. This novel method is expected to minimize the need for conducting additional plasma PK studies and allow for accurate estimation of the brain influx rate.
Copyright © 2023 by The American Society for Pharmacology and Experimental Therapeutics.
Figures


Similar articles
-
Positron Emission Tomography (PET) and Pharmacokinetics: Classical Blood Sampling Versus Image-Derived Analysis of [18F]FAZA and [18F]FDG in a Murine Tumor Bearing Model.J Pharm Pharm Sci. 2018;21(1s):32s-47s. doi: 10.18433/jpps29788. J Pharm Pharm Sci. 2018. PMID: 29702045
-
[124I]IBETA: A New Aβ Plaque Positron Emission Tomography Imaging Agent for Alzheimer's Disease.Molecules. 2022 Jul 17;27(14):4552. doi: 10.3390/molecules27144552. Molecules. 2022. PMID: 35889425 Free PMC article.
-
First in Human Evaluation and Dosimetry Calculations for Peptide 124I-p5+14-a Novel Radiotracer for the Detection of Systemic Amyloidosis Using PET/CT Imaging.Mol Imaging Biol. 2022 Jun;24(3):479-488. doi: 10.1007/s11307-021-01681-2. Epub 2021 Nov 16. Mol Imaging Biol. 2022. PMID: 34786667
-
[Molecular imaging of beta-amyloid plaques in the brain].Brain Nerve. 2007 Mar;59(3):233-40. Brain Nerve. 2007. PMID: 17370649 Review. Japanese.
-
Development of positron-emission tomography/single-photon emission computed tomography imaging probes for in vivo detection of beta-amyloid plaques in Alzheimer's brains.Chem Pharm Bull (Tokyo). 2009 Oct;57(10):1029-39. doi: 10.1248/cpb.57.1029. Chem Pharm Bull (Tokyo). 2009. PMID: 19801854 Review.
References
-
- Bao B, Vasquez KO, Ho G, Zhang J, Delaney J, Rajopadhye M, Peterson JD (2019) Blood pharmacokinetics imaging by noninvasive heart fluorescence tomography and application to kidney glomerular filtration rate assessment. J Pharmacol Exp Ther 370:288–298. - PubMed
-
- Barbee RW, Perry BD, Ré RN, Murgo JP (1992) Microsphere and dilution techniques for the determination of blood flows and volumes in conscious mice. Am J Physiol 263:R728–R733. - PubMed
-
- Bland CM, Pai MP, Lodise TP (2018) Reappraisal of contemporary pharmacokinetic and pharmacodynamic principles for informing aminoglycoside dosing. Pharmacotherapy 38:1229–1238. - PubMed
-
- Callegari T, Caumo A, Cobelli C (2002) Generalization of map estimation in SAAM II: validation against ADAPT II in a glucose model case study. Ann Biomed Eng 30:961–968. - PubMed
Publication types
MeSH terms
Substances
Grants and funding
LinkOut - more resources
Full Text Sources
Medical
