. 2023 May 23;13(1):8350.
doi: 10.1038/s41598-023-35518-5.

An automated image-based workflow for detecting megabenthic fauna in optical images with examples from the Clarion-Clipperton Zone

Affiliations

An automated image-based workflow for detecting megabenthic fauna in optical images with examples from the Clarion-Clipperton Zone

Benson Mbani et al. Sci Rep. .

Abstract

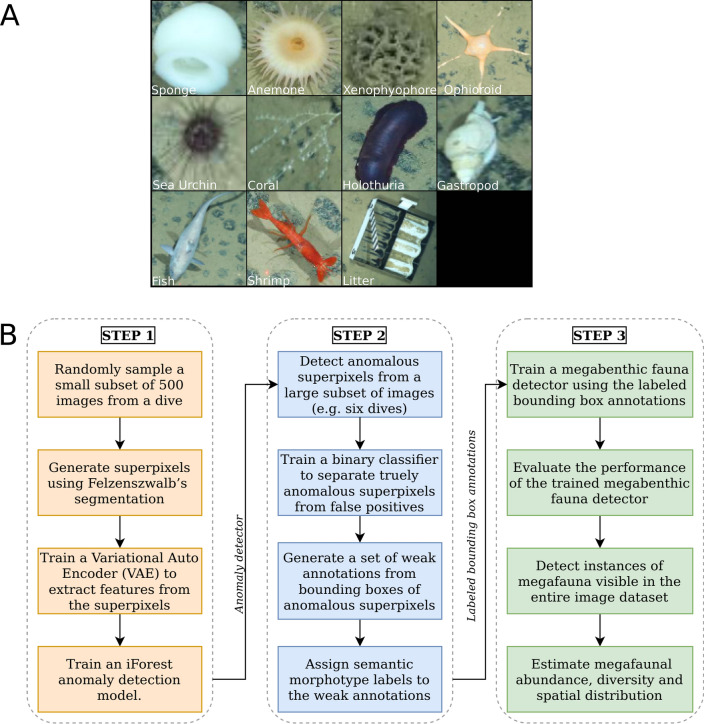
Recent advances in optical underwater imaging technologies enable the acquisition of huge numbers of high-resolution seafloor images during scientific expeditions. While these images contain valuable information for non-invasive monitoring of megabenthic fauna, flora and the marine ecosystem, traditional labor-intensive manual approaches for analyzing them are neither feasible nor scalable. Therefore, machine learning has been proposed as a solution, but training the respective models still requires substantial manual annotation. Here, we present an automated image-based workflow for Megabenthic Fauna Detection with Faster R-CNN (FaunD-Fast). The workflow significantly reduces the required annotation effort by automating the detection of anomalous superpixels, which are regions in underwater images that have unusual properties relative to the background seafloor. The bounding box coordinates of the detected anomalous superpixels are proposed as a set of weak annotations, which are then assigned semantic morphotype labels and used to train a Faster R-CNN object detection model. We applied this workflow to example underwater images recorded during cruise SO268 to the German and Belgian contract areas for Manganese-nodule exploration, within the Clarion-Clipperton Zone (CCZ). A performance assessment of our FaunD-Fast model showed a mean average precision of 78.1% at an intersection-over-union threshold of 0.5, which is on a par with competing models that use costly-to-acquire annotations. In more detail, the analysis of the megafauna detection results revealed that ophiuroids and xenophyophores were among the most abundant morphotypes, accounting for 62% of all the detections within the surveyed area. Investigating the regional differences between the two contract areas further revealed that both megafaunal abundance and diversity was higher in the shallower German area, which might be explainable by the higher food availability in form of sinking organic material that decreases from east-to-west across the CCZ. Since these findings are consistent with studies based on conventional image-based methods, we conclude that our automated workflow significantly reduces the required human effort, while still providing accurate estimates of megafaunal abundance and their spatial distribution. The workflow is thus useful for a quick but objective generation of baseline information to enable monitoring of remote benthic ecosystems.


Conflict of interest statement

The authors declare no competing interests.

Figures

Figure 1
Figure 1
Overview of our optical image-based megabenthic fauna detection framework. (A) Examples of target morphotypes, including litter, that were detected on the seafloor. (B) Schematic diagram of our three-step workflow: The first step (automatically) generates superpixels from a small subset of sampled images, and (automatically) extracts their features for training an anomaly detection model. The second step detects anomalous superpixels (automatically) from a larger subset of images, and (semi-automatically) proposes them as weak annotations ready to be post-processed and assigned semantic morphotype labels (manually). The final step uses the semantic annotations to (automatically) train a Faster R-CNN object detection model, which then detects instances of benthic megafauna visible in the entire underwater image dataset (automatically), allowing for the estimation of megafaunal abundance, diversity and spatial distribution (manually).
Figure 2
Figure 2
Feature space projection of superpixels whose features were used to train the anomaly detection model. Those representing the background seafloor are densely distributed around the origin of the feature space, whereas few anomalous superpixels are sparsely distributed further away towards the periphery of the feature space.
Figure 3
Figure 3
Feature space projection of the anomalous superpixels detected from images in dive 126. While some false positives such as red lasers and dark pixels of the water column were also detected, the rest of the anomalous detections represent potential instances of megafauna whose bounding boxes can be proposed as a set of weak annotations.
Figure 4
Figure 4
Grids of image patches showing truly anomalous superpixels obtained by (A) Thresholding the anomaly scores, and (B) Binary classifier trained with examples of both true and false positives. Thresholding produces undesired results e.g., the red laser points and the dark patches from the water column. On the other hand, the binary classifier results in a set of truly anomalous superpixels that are clearly instances of megabenthic fauna. These were proposed as weak annotations.
Figure 5
Figure 5
Distribution of the annotated morphotypes after exporting from the annotation software. Ophiuroids, sponges and xenophyophores were among the dominant morphotypes in the annotated dataset.
Figure 6
Figure 6
Examples images showing correctly detected instances of megabenthic fauna, as well as instances of both false positives (FP) and false negatives (FN). Morphotypes whose visual characteristics is similar to the seafloor substrate (e.g. xenophyophores and partially burrowed ophioroids) resulted in a higher proportion of false negatives. Also, incorrect detection/localization was observed in instances where morphotypes formed associations with each other e.g. between ophiuroids and sponges.
Figure 7
Figure 7
(A) Qualitative examples of detected instances of megabenthic fauna (B) Distribution of morphotypes that were detected by our FaunD-Fast model. This distribution is similar in shape to that of annotations (see Fig. 5), except the FaunD-Fast detected a lot more instances of megafauna. (C) Grid view showing megafauna examples grouped by morphotypes in every row of the grid; the morphotype label for each row follows the same order as in panel (B).
Figure 8
Figure 8
Map view showing spatial distribution of detected megabenthic fauna along camera deployment tracks in both the German and Belgian contract areas. The German seabed contained higher abundance of megafauna, probably because of availability of food in form of sinking organic material since it is on average shallower than the Belgian seabed. The map was generated using the open source QGIS software v3.2 (https://www.qgis.org/).
Figure 9
Figure 9
Superpixel generation process. (A) Examples of segmented images highlighting boundaries of generated superpixels in yellow, and (B) a grid view of a subset of cropped superpixels. Small sized Mn-nodules are not captured by the segmentation because the image was first smoothed with a Gaussian filter to reduce the effect of noisy pixels.

References

    1. Purser A, et al. Ocean floor observation and bathymetry system (OFOBS): A new towed camera/sonar system for deep-sea habitat surveys. IEEE J. Ocean. Eng. 2019;44:87–99. doi: 10.1109/JOE.2018.2794095. - DOI
    1. Wynn RB, et al. Autonomous underwater vehicles (AUVs): Their past, present and future contributions to the advancement of marine geoscience. Mar. Geol. 2014;352:451–468. doi: 10.1016/j.margeo.2014.03.012. - DOI
    1. Bicknell AW, Godley BJ, Sheehan EV, Votier SC, Witt MJ. Camera technology for monitoring marine biodiversity and human impact. Front. Ecol. Environ. 2016;14:424–432. doi: 10.1002/fee.1322. - DOI
    1. Desa E, Madhan R, Maurya P. Potential of autonomous underwater vehicles as new generation ocean data platforms. Curr. Sci. 2006;90:1202–1209.
    1. Durden JM, et al. Perspectives in visual imaging for marine biology and ecology: From acquisition to understanding. Oceanogr. Mar. Biol. Annu. Rev. 2016;54:1–72.

Publication types