. 2023 May 23;13(1):8354.
doi: 10.1038/s41598-023-35610-w.

Extensive cytokine biomarker analysis in serum of Guillain-Barré syndrome patients

Affiliations

Extensive cytokine biomarker analysis in serum of Guillain-Barré syndrome patients

Xiaocong Li et al. Sci Rep. .

Abstract

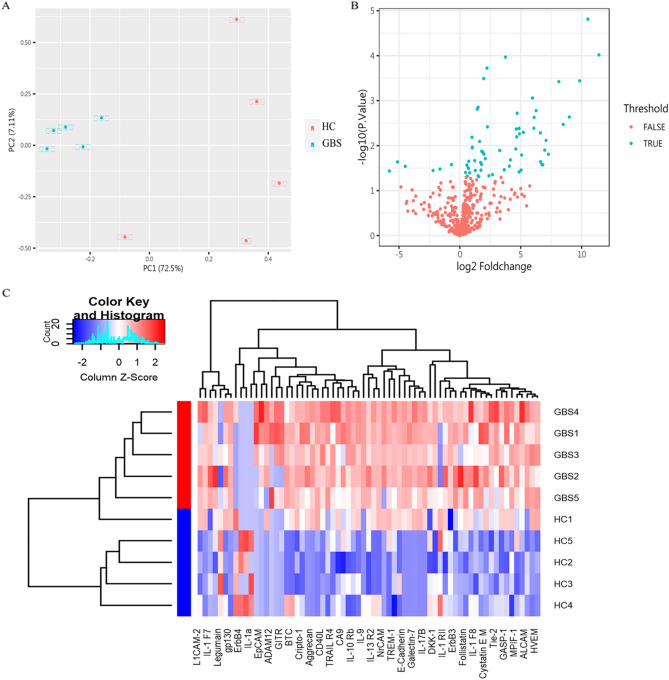
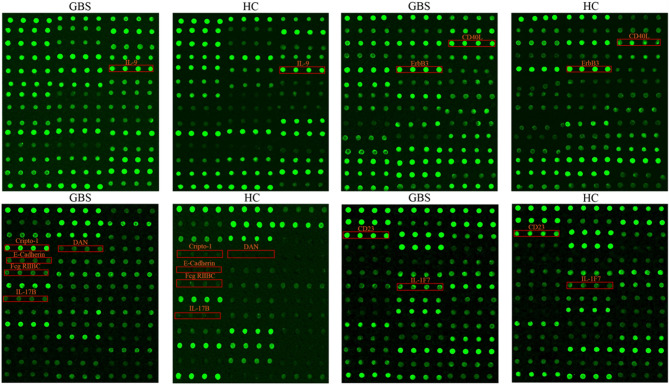
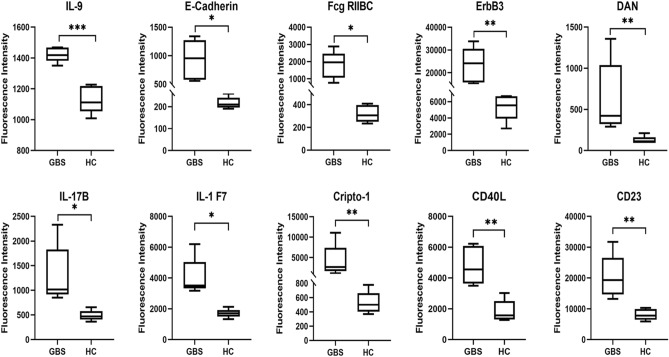
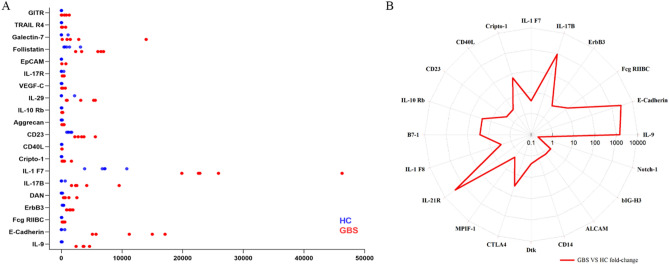
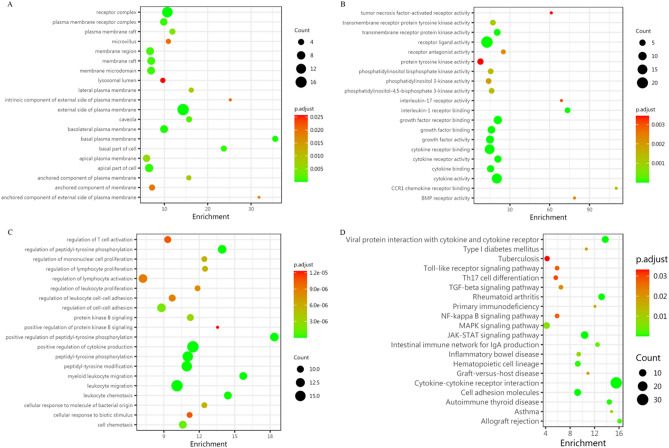
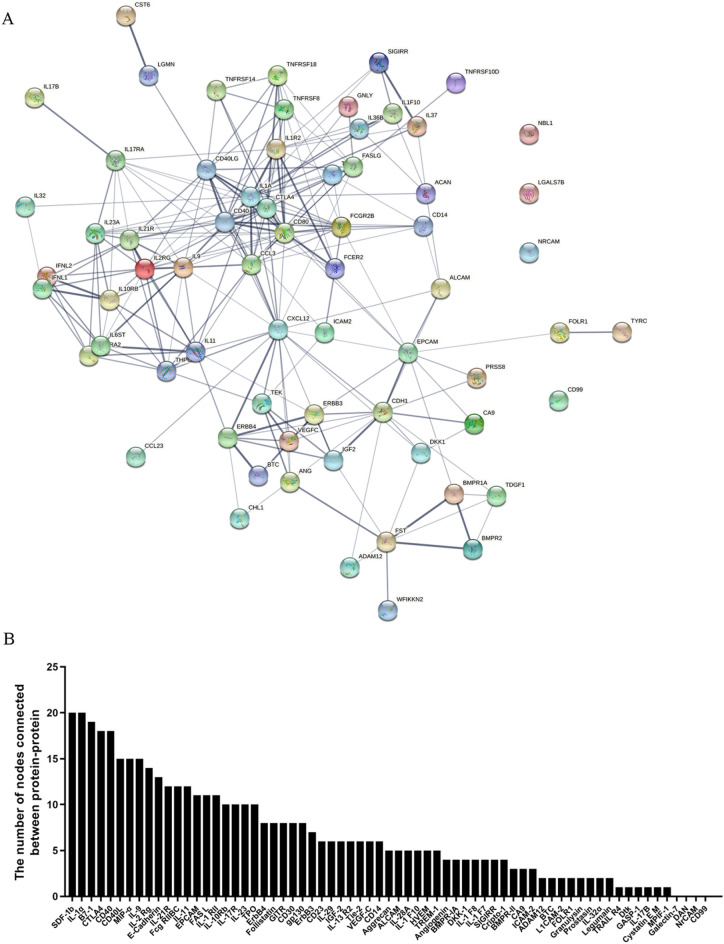
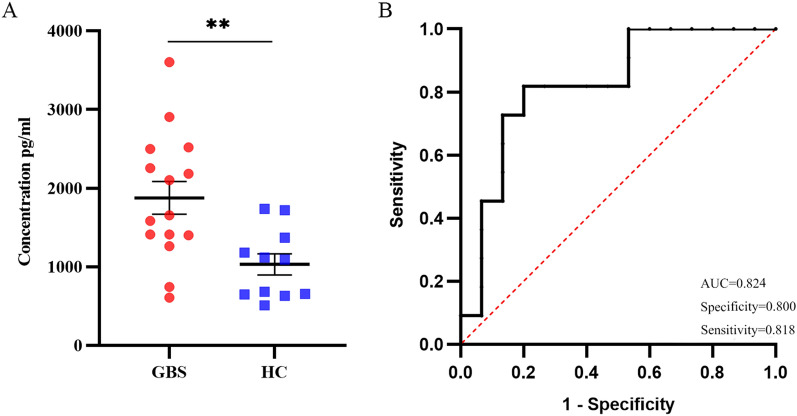
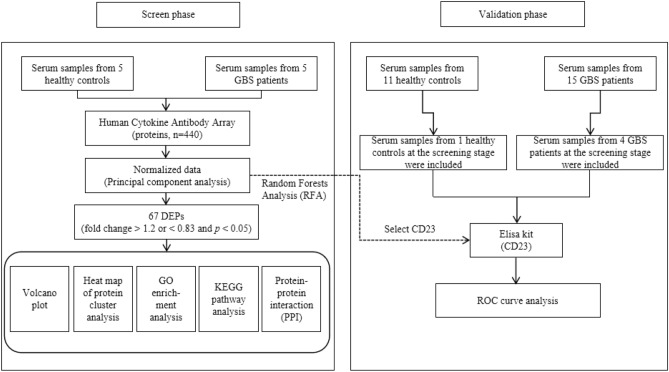
Guillain-Barré syndrome (GBS) is an acute idiopathic polyneuropathy which is related to infection and immune mechanism. The exact pathogenesis of the disease is unknown and treatment is limited. Thus, the purpose of the study is to identify biomarkers of GBS serum and elucidate their involvement in the underlying pathogenesis of GBS that could help to treat GBS more accurately. Antibody array technology was used to detect the expression levels of 440 proteins in serum of 5 GBS group and 5 healthy control group. Sixty-seven differentially expressed proteins (DEPs) were identified by antibody array, among which FoLR1, Legumain, ErbB4, IL-1α, MIP-1α and IGF-2 were down-regulated, while 61 proteins were up-regulated. Bioinformatics analysis indicated that most DEPs were associated with leukocytes, among which IL-1α, SDF-1b, B7-1, CD40, CTLA4, IL-9, MIP-1α and CD40L were in the center of protein-protein interaction (PPI) network. Subsequently, the ability of these DEPs to distinguish GBS from healthy control was further evaluated. CD23 was identified by means of Random Forests Analysis (RFA) and verified by enzyme-linked immunosorbent assay (ELISA). The ROC curve result of CD23 respectively displayed that its sensitivity, specificity and AUC were 0.818, 0.800 and 0.824. We speculate that activation of leukocyte proliferation and migration in circulating blood might be associated with inflammatory recruitment of peripheral nerves, leading to the occurrence and development of GBS, but this conclusion still requires deeper confirmation. More importantly, central proteins may play a pivotal role in the pathogenesis of GBS. In addition, we detected IL-1α, IL-9, and CD23 in the serum of GBS patients for the first time, which may be promising biomarkers for the treatment of GBS.


Conflict of interest statement

The authors declare no competing interests.

Figures

Figure 1
Figure 1
DEPs specificity analysis of GBS. (A) Principal component analysis of GBS and HC. A principal component map was drawn to show the differences between the GBS and HC groups (blue for GBS, red for HC). (B) Volcano plot of GBS and HC group DEPs screened by Human Antibody Array QAH-CAA-440. DEPs in the GBS and HC groups were obtained based on their log2 FC (x-axis, FC: fold change) and significance (y-axis: − log10 p.value). Data set with DEPs with p < 0.05 and fold change > 1.2 or < 0.83 are highlighted in blue. (C) Heat map of unsupervised hierarchical clustering analysis of DEPs in GBS and HC groups. Based on the average of each protein, low levels are shown in blue, medium levels in white and high levels in red, representing the level of each protein (red for GBS, blue for HC). The heatmap was created using R4.2.3 software (https://cloud.r-project.org/).
Figure 2
Figure 2
The top 10 DEPs profiles in GBS patients. The top 10 DEPs are marked with red boxes in the QAH-CAA-440 antibody array, each cytokine was repeated four times, and the relationship between fluorescence intensity and cytokine level was shown to be directly proportional.
Figure 3
Figure 3
Boxplots were used to analyze the fluorescence intensity of the top 10 DEPs. Every group's midline indicates its average value. *p < 0.05, **p < 0.01.
Figure 4
Figure 4
Characteristics of DEPs in GBS. (A) Based on the QAH-CAA-440 antibody array screening, the concentration levels of the top 20 DEPs were plotted using horizontal dot plots. The DEPs levels in HC are indicated by blue dots, and those in the GBS patients group are denoted by red dots. (B) Based on random forest analysis, the radar plot depicts the fold change of the top 20 serum proteins.
Figure 5
Figure 5
Bioinformatic analysis of differential proteins. (AC) Enrichment analysis based on the top 20 cellular components, molecular functions, and biological processes of the GO term. (D) Enrichment analysis of the top 20 KEGG pathways. Fisher exact test was used to determine the significance of statistical differences, and p < 0.05 was considered to be statistically significant.
Figure 6
Figure 6
PPI network analysis of DEPs. (A) All DEPs were analyzed by the PPI network. The protein–protein line represents the biological function of the correlation, the thickness of the line is strength for protein interactions. (B) The number of nodes connected to the DEPs.
Figure 7
Figure 7
ELISA validation results and statistical analysis. (A) Scatter plot of CD23 concentration in GBS and HC groups. ** p < 0.01 when compared to HC group. (B) The ROC curve analysis of CD23 protein in GBS and HC groups.
Figure 8
Figure 8
Flowchart of this study.

Similar articles

Cited by

References

    1. Ansar V, Valadi N. Guillain-Barre syndrome. Prim. Care. 2015;42:189–193. doi: 10.1016/j.pop.2015.01.001. - DOI - PubMed
    1. van den Berg B, et al. Guillain-Barre syndrome: Pathogenesis, diagnosis treatment and prognosis. Nat. Rev. Neurol. 2014;10:469–482. doi: 10.1038/nrneurol.2014.121. - DOI - PubMed
    1. Leonhard SE, et al. Diagnosis and management of Guillain-Barre syndrome in ten steps. Nat. Rev. Neurol. 2019;15:671–683. doi: 10.1038/s41582-019-0250-9. - DOI - PMC - PubMed
    1. Yuki N, Hartung HP. Guillain-Barre syndrome. N. Engl. J. Med. 2012;366:2294–2304. doi: 10.1056/NEJMra1114525. - DOI - PubMed
    1. Jacobs BC, et al. The spectrum of antecedent infections in Guillain-Barre syndrome: A case-control study. Neurology. 1998;51:1110–1115. doi: 10.1212/wnl.51.4.1110. - DOI - PubMed

Publication types