. 2023 May 23;14(1):34.
doi: 10.1186/s13293-023-00518-7.

Menopause causes metabolic and cognitive impairments in a chronic cerebral hypoperfusion model of vascular contributions to cognitive impairment and dementia

Affiliations

Menopause causes metabolic and cognitive impairments in a chronic cerebral hypoperfusion model of vascular contributions to cognitive impairment and dementia

Olivia J Gannon et al. Biol Sex Differ. .

Abstract

Background: The vast majority of women with dementia are post-menopausal. Despite clinical relevance, menopause is underrepresented in rodent models of dementia. Before menopause, women are less likely than men to experience strokes, obesity, and diabetes-known risk factors for vascular contributions to cognitive impairment and dementia (VCID). During menopause, ovarian estrogen production stops and the risk of developing these dementia risk factors spikes. Here, we aimed to determine if menopause worsens cognitive impairment in VCID. We hypothesized that menopause would cause metabolic dysfunction and increase cognitive impairment in a mouse model of VCID.

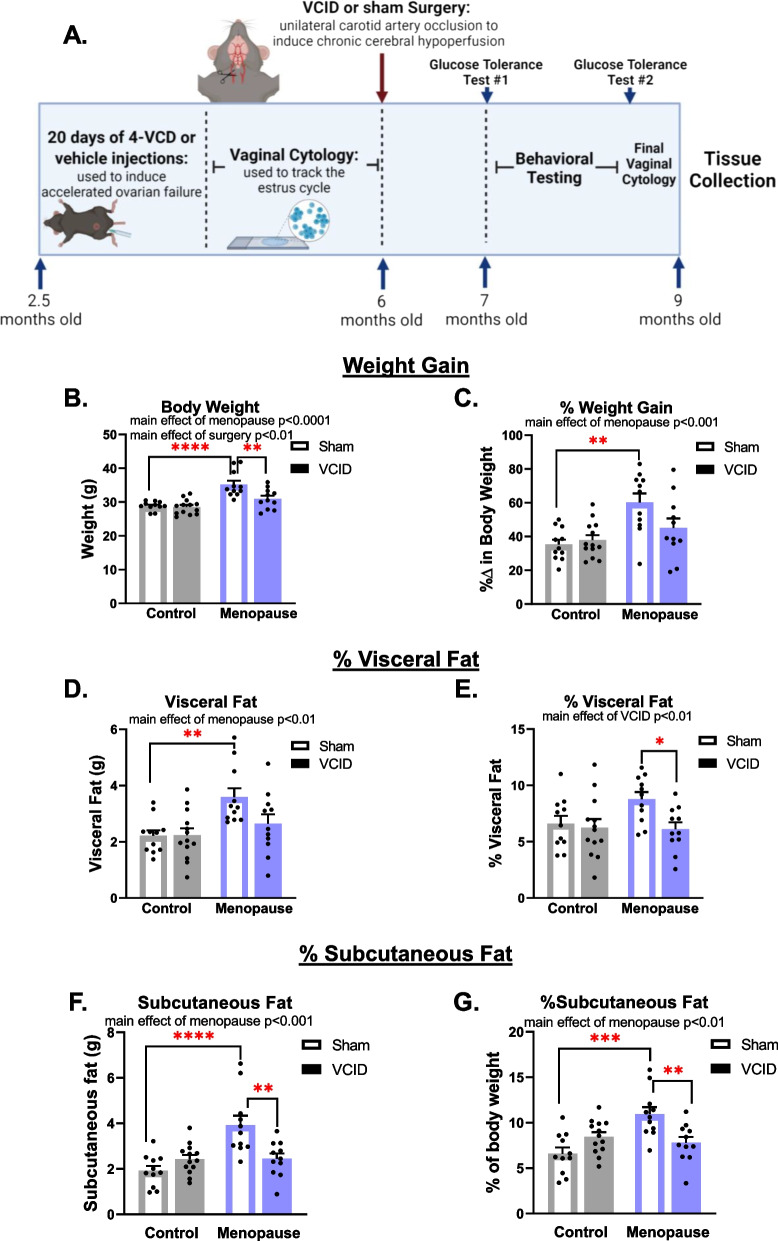
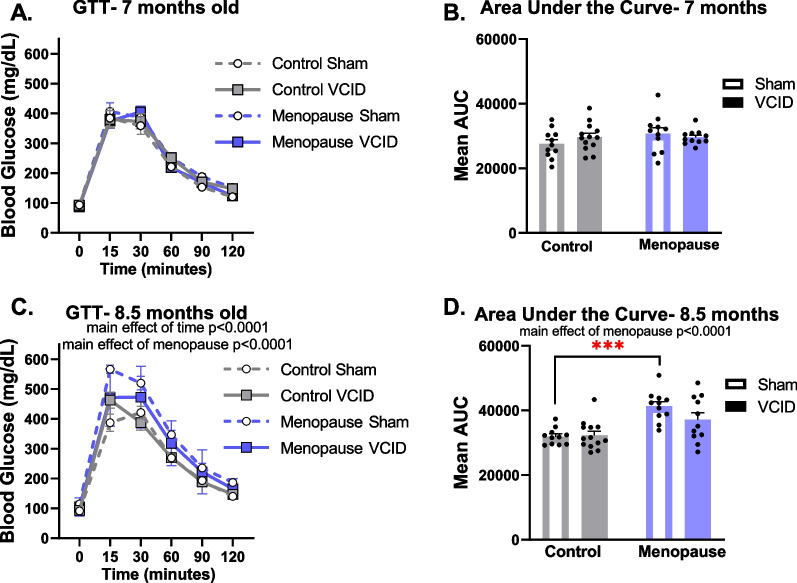
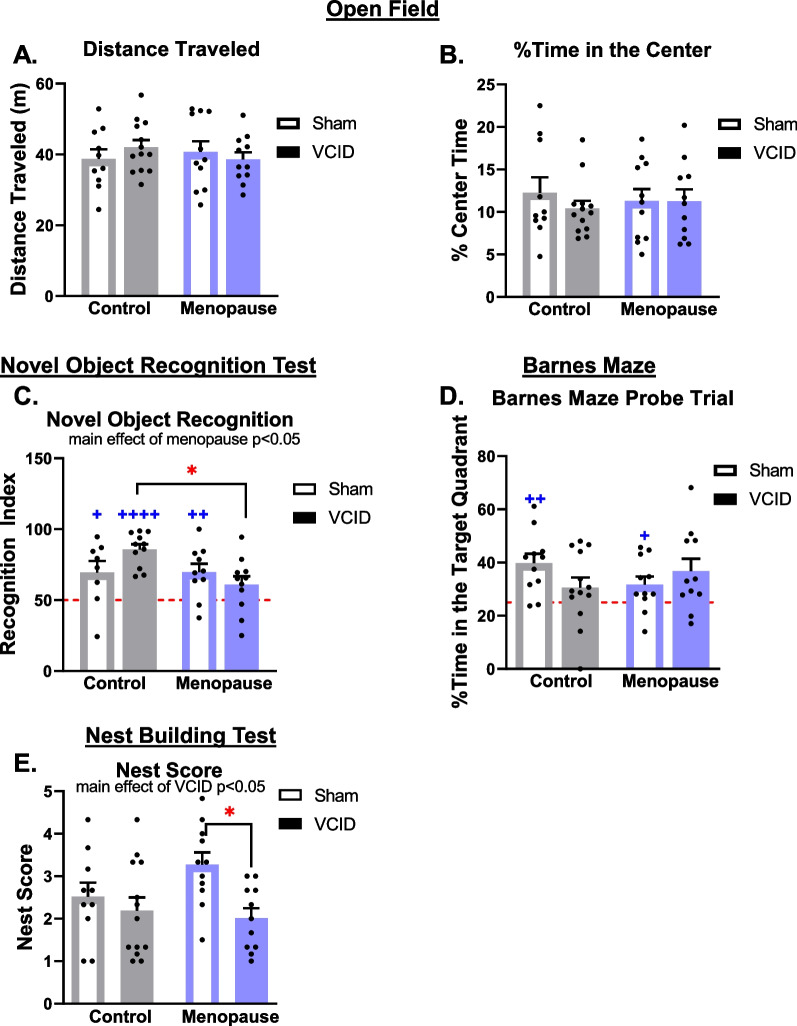
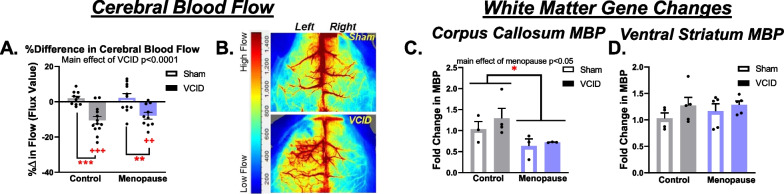
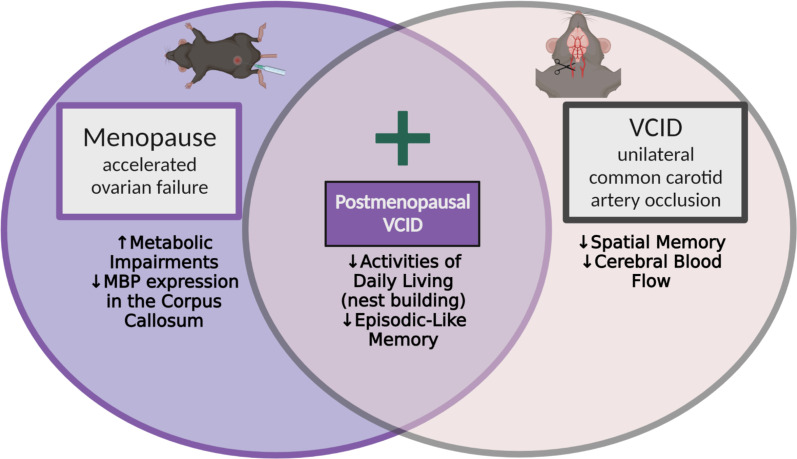
Methods: We performed a unilateral common carotid artery occlusion surgery to produce chronic cerebral hypoperfusion and model VCID in mice. We used 4-vinylcyclohexene diepoxide to induce accelerated ovarian failure and model menopause. We evaluated cognitive impairment using behavioral tests including novel object recognition, Barnes maze, and nest building. To assess metabolic changes, we measured weight, adiposity, and glucose tolerance. We explored multiple aspects of brain pathology including cerebral hypoperfusion and white matter changes (commonly observed in VCID) as well as changes to estrogen receptor expression (which may mediate altered sensitivity to VCID pathology post-menopause).

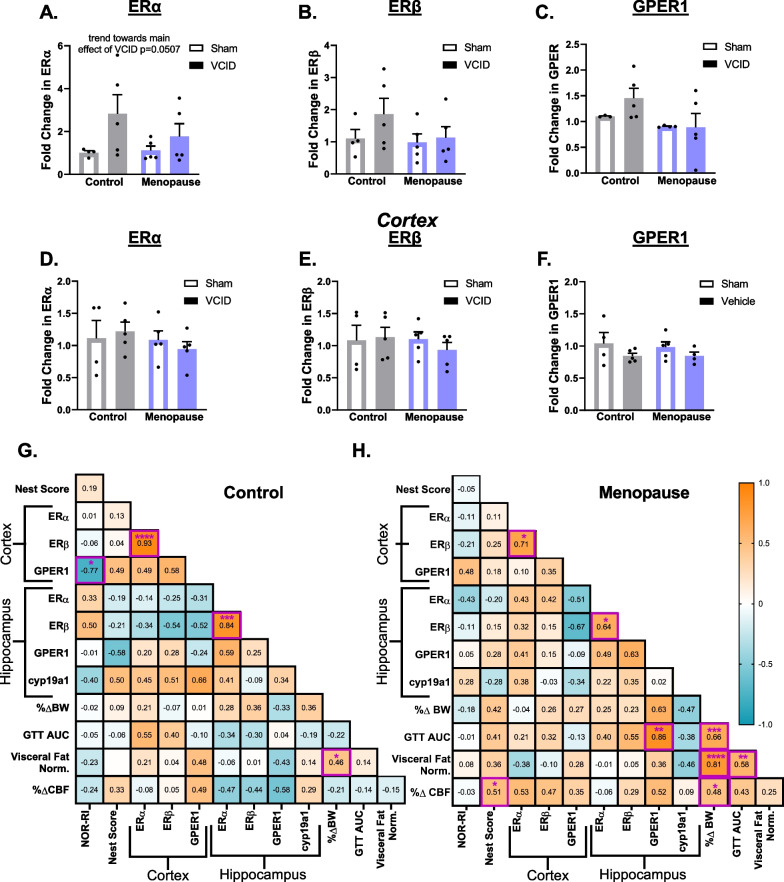
Results: Menopause increased weight gain, glucose intolerance, and visceral adiposity. VCID caused deficits in spatial memory regardless of menopausal status. Post-menopausal VCID specifically led to additional deficits in episodic-like memory and activities of daily living. Menopause did not alter resting cerebral blood flow on the cortical surface (assessed by laser speckle contrast imaging). In the white matter, menopause decreased myelin basic protein gene expression in the corpus callosum but did not lead to overt white matter damage (assessed by Luxol fast blue). Menopause did not significantly alter estrogen receptor expression (ERα, ERβ, or GPER1) in the cortex or hippocampus.

Conclusions: Overall, we have found that the accelerated ovarian failure model of menopause caused metabolic impairment and cognitive deficits in a mouse model of VCID. Further studies are needed to identify the underlying mechanism. Importantly, the post-menopausal brain still expressed estrogen receptors at normal (pre-menopausal) levels. This is encouraging for any future studies attempting to reverse the effects of estrogen loss by activating brain estrogen receptors.

Keywords: Cognitive impairment; Dementia; Estrogen; Hypoperfusion; Menopause; Metabolic; Myelin; Neuroinflammation; Neuroscience; Vascular.

Plain language summary

Nearly all women with dementia are menopausal. Reduced blood flow to the brain, resulting from damaged blood vessels, can lead to vascular dementia. Vascular dementia is the second most common cause of dementia. Before menopause, women are less likely than men to experience strokes, obesity, and diabetes—known risk factors for vascular dementia. During menopause, estrogen levels drop and the risk of developing these dementia risk factors increases. The goal of this study was to determine how menopause impacts risk factors (obesity, diabetes), memory and brain pathology in vascular dementia. This study used mouse models of vascular dementia and menopause. Menopause increased weight gain and other indicators of poor metabolic health. In mice with vascular dementia, menopausal mice had worse memory than pre-menopausal mice. After menopause, the brain still expressed estrogen receptors at normal (pre-menopausal) levels. This is encouraging for any future studies attempting to reverse the effects of estrogen loss by activating brain estrogen receptors.


Conflict of interest statement

The authors declare that they have no competing interests.

Figures

Fig. 1
Fig. 1
Experimental timeline and menopause-induced weight gain. A Experimental timeline made using Biorender.com. Body weight was taken at the end of the study (B) and was normalized to body weight at the beginning of the study (C). Visceral adiposity was determined by isolating and weighing the visceral fat pads (D) and normalizing to body weight (E). Subcutaneous adiposity was determined by isolating and weighing the subcutaneous fat pads (F) and normalizing (G) to body weight. Data are presented as mean + SEM, *p < 0.05, **p < 0.01, ***p < 0.001, ****p < 0.0001, 2-way ANOVA with Tukey’s multiple comparison test, (n = 10–13/group)
Fig. 2
Fig. 2
The accelerated ovarian failure model of menopause induced glucose intolerance over time. At 7 months old (4.5 months post first 4-VCD or vehicle injection), glucose intolerance was assessed with a GTT following a 16 h fast (A). Glucose clearance was gauged by concentrations of glucose in the blood measured over time (time 0 = fasting blood glucose). B Blood glucose concentration over time was used to calculate area under the curve (AUC). Glucose clearance (C) and intolerance (D, AUC) was also assessed at 8.5 months old (6 months post first 4-VCD or vehicle injection). Data are presented as mean + SEM, *p < 0.05, **p < 0.01, ***p < 0.001, ****p < 0.0001, 2-way ANOVA with Tukey’s multiple comparison test, (n = 10–13/group)
Fig. 3
Fig. 3
Post-menopausal VCID caused a wider array of cognitive deficits than VCID alone. General activity levels were gauged using the total distance traveled in the open field test (A). Anxiety-like behavior was measured as the % of the time that the animal spent in the center of the testing arena during the open field test (more time in the center = less anxiety-like behavior) (B). Episodic-like memory was assessed in the novel object recognition test (NORT) (C). Recognition index (% time spent with the novel object) was calculated. Performance not significantly greater than chance (red line = 50%) indicates impaired memory. Spatial memory was assessed in the probe trial of the Barnes maze (D), as % time spent in the target quadrant vs. chance. Performance not significantly greater than chance (red line = 25%) indicates impaired memory. The nest building task was used to assess activities of daily living (E). Nests were graded on 1–5 scale (average of scores by 3 experimenters blinded to treatment). Lower scores are indicative of impairment. Data are presented as mean + SEM, +p < 0.05, ++p < 0.01, +++p < 0.001, ++++p < 0.0001 t-test vs chance, and *p < 0.05, **p < 0.01, 2-way ANOVA with Tukey’s multiple comparison test (n = 8–13/group)
Fig. 4
Fig. 4
Neuropathology indicators associated with VCID and menopause. Cortical blood flow was measured using laser speckle contrast imaging at 9 months of age (3 months post-surgery) and a T-test performed against no difference in blood flow (A). The % difference in blood flow between the ischemic and non-ischemic hemispheres with a value closer to 0 indicating no difference in blood flow and a negative % difference indicating lower blood flow in the hemisphere ipsilateral to the occlusion (n = 11–13/group). Representative images are shown in B. White matter changes were also assessed by examining the expression of MBP, a marker of myelination. MBP expression normalized to RPL13a was measured in the corpus callosum (C) and in the ventral striatum (D). Data are presented as mean + SEM, +p < 0.05, ++++p < 0.0001 T-test vs chance and *p < 0.05, **p < 0.01, ***p < 0.001, 2-way ANOVA with Tukey’s multiple comparison test (n = 3–5/group)
Fig. 5
Fig. 5
Estrogen receptor expression in the hippocampus and the cortex persists following menopause. The expression of estrogen receptor alpha (ERα) was assessed in the hippocampus (A) and the cortex (D). The expression of estrogen receptor beta (ERβ) was assessed in the hippocampus (B) and the cortex (E). The expression of G-coupled protein estrogen receptor (GPER1) was assessed in the hippocampus (C) and the cortex (F). Data are presented as mean + SEM, (n = 3–5/group). Using a correlation matrix, we compared relationships between cognitive, metabolic, and pathological factors including the expression of estrogen receptors for control (G) and menopause (H) groups separately. NOR-RI: novel object recognition test recognition index, a measurement of episodic-like memory; Nest Score: a measurement of activities of daily living; Cortex ERα: expression of ERα in the right (ischemic for VCID groups) cortex; Cortex ERβ: expression of ERβ in the right (ischemic for VCID groups) cortex; Cortex GPER1:expression of GPER1 in the right (ischemic for VCID groups) cortex; Hippocampus ERα: expression of Erα in the right (ischemic for VCID groups) hippocampus; Hippocampus Erβ: expression of ERβ in the right (ischemic for VCID groups) hippocampus; Hippocampus GPER1: expression of GPER1 in the right (ischemic for VCID groups) Hippocampus; Hippocampus cyp19a1: expression of aromatase in the right (ischemic for VCID groups) hippocampus; %ΔBW: % change in body weight from the beginning of the study; GTT AUC: area under the curve from the glucose tolerance test, high AUC indicates greater glucose intolerance; Visceral Fat Norm.: Visceral fat pad weight normalized to body weight; %ΔCBF: % difference in blood flow between the left and right ZOA; (n = 8–10/group for gene expression and n = 19–24 for behavior, metabolic, and blood flow measures). *p < 0.05, **p < 0.01, ***p < 0.001, ****p < 0.0001, significant correlation; Pearson r values are presented. Orange: positive correlation, Blue: negative correlation. Significant correlations are outlined in purple
Fig. 6
Fig. 6
Summary of major findings. MBP myelin basic protein, a marker of myelination; Made using biorender.com

Similar articles

Cited by

References

    1. Ruitenberg A, Ott A, van Swieten JC, Hofman A, Breteler MM. Incidence of dementia: does gender make a difference? Neurobiol Aging. 2001;22(4):575–580. doi: 10.1016/S0197-4580(01)00231-7. - DOI - PubMed
    1. Gannon OJ, Robison LS, Custozzo AJ, Zuloaga KL. Sex differences in risk factors for vascular contributions to cognitive impairment & dementia. Neurochem Int. 2018;127:38. doi: 10.1016/j.neuint.2018.11.014. - DOI - PubMed
    1. Chatterjee S, Peters SA, Woodward M, Mejia Arango S, Batty GD, Beckett N, et al. Type 2 diabetes as a risk factor for dementia in women compared with men: a pooled analysis of 2.3 million people comprising more than 100,000 cases of dementia. Diabetes Care. 2016;39(2):300–307. doi: 10.2337/dc15-1588. - DOI - PMC - PubMed
    1. Fujishima M, Kiyohara Y. Incidence and risk factors of dementia in a defined elderly Japanese population: the Hisayama study. Ann N Y Acad Sci. 2002;977:1–8. doi: 10.1111/j.1749-6632.2002.tb04793.x. - DOI - PubMed
    1. Whitmer RA, Gunderson EP, Quesenberry CP, Jr, Zhou J, Yaffe K. Body mass index in midlife and risk of Alzheimer disease and vascular dementia. Curr Alzheimer Res. 2007;4(2):103–109. doi: 10.2174/156720507780362047. - DOI - PubMed

Publication types