

Integrated analysis of robust sex-biased gene signatures in human brain
- PMID: 37221602
- PMCID: PMC10207743
- DOI: 10.1186/s13293-023-00515-w
Integrated analysis of robust sex-biased gene signatures in human brain
Abstract
Background: Sexual dimorphism is highly prominent in mammals with many physiological and behavioral differences between male and female form of the species. Accordingly, the fundamental social and cultural stratification factors for humans is sex. The sex differences are thought to emerge from a combination of genetic and environmental factors. It distinguishes individuals most prominently on the reproductive traits, but also affects many of the other related traits and manifest in different disease susceptibilities and treatment responses across sexes. Sex differences in brain have raised a lot of controversy due to small and sometimes contradictory sex-specific effects. Many studies have been published to identify sex-biased genes in one or several brain regions, but the assessment of the robustness of these studies is missing. We therefore collected huge amount of publicly available transcriptomic data to first estimate whether consistent sex differences exist and further explore their likely origin and functional significance.
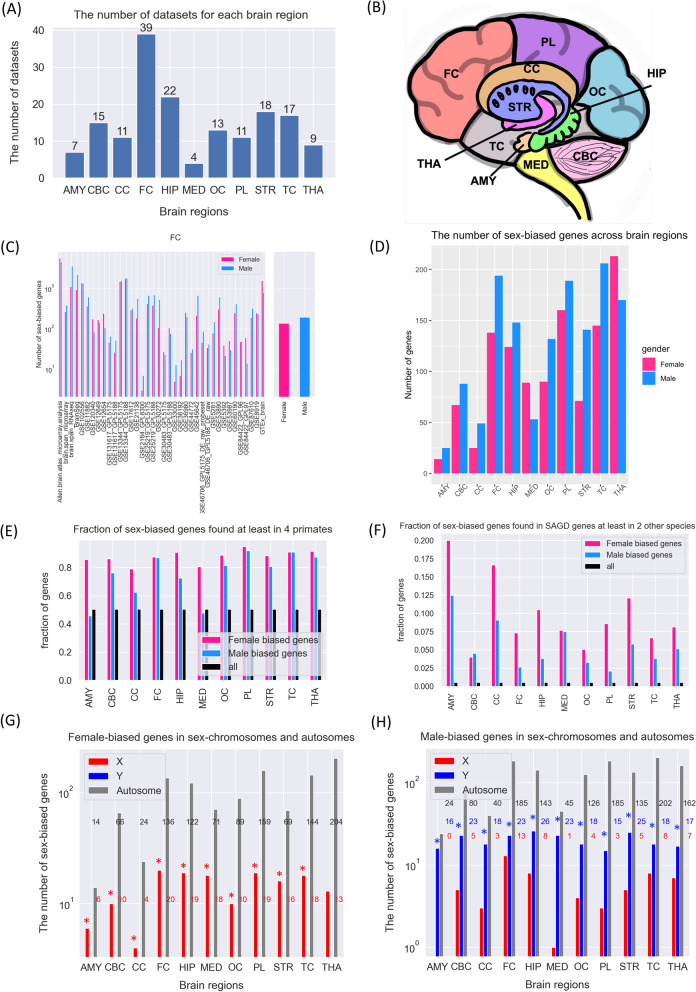
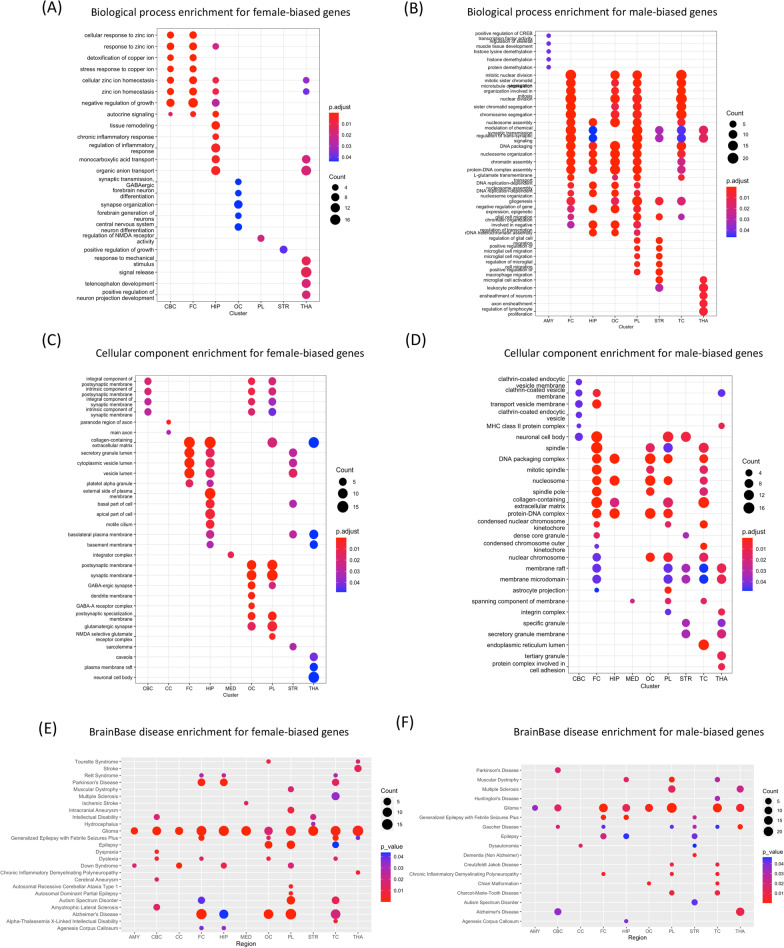
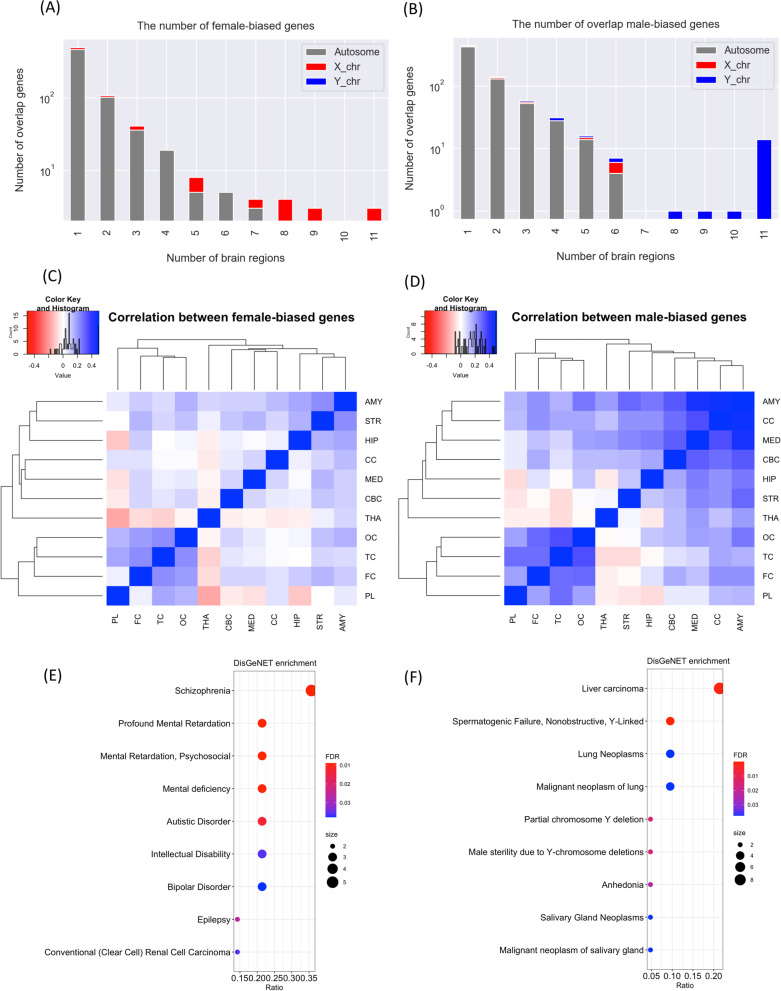
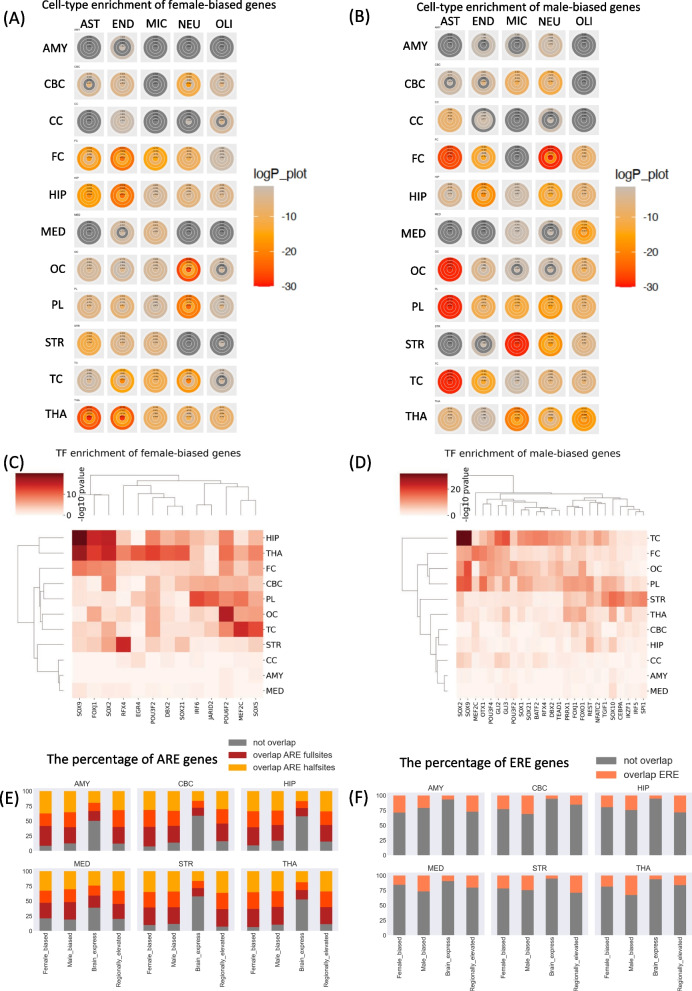
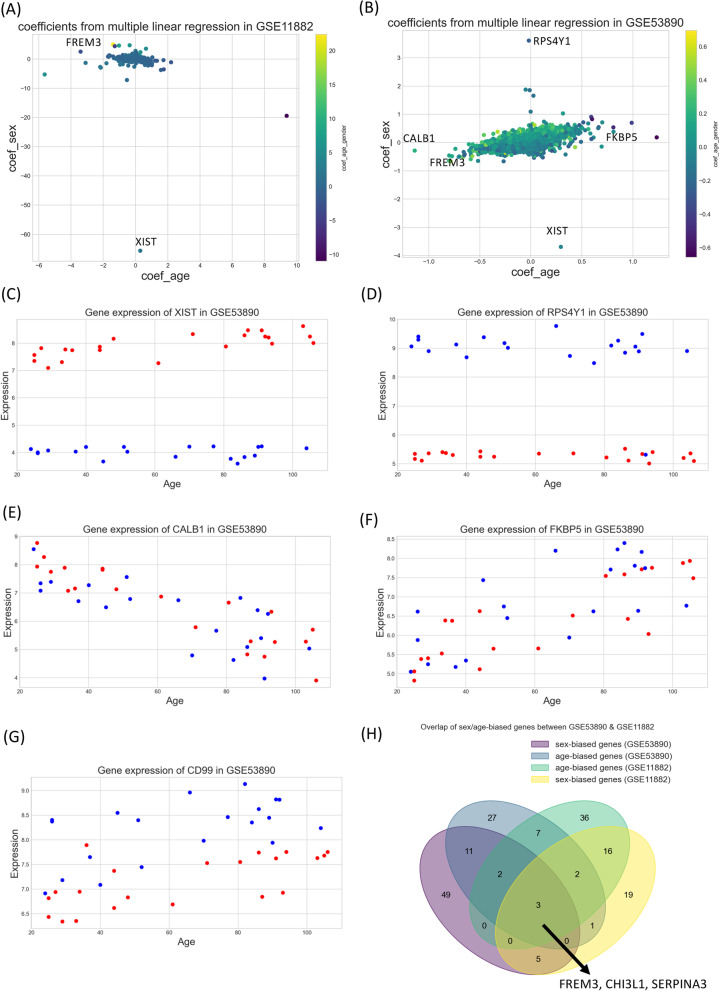
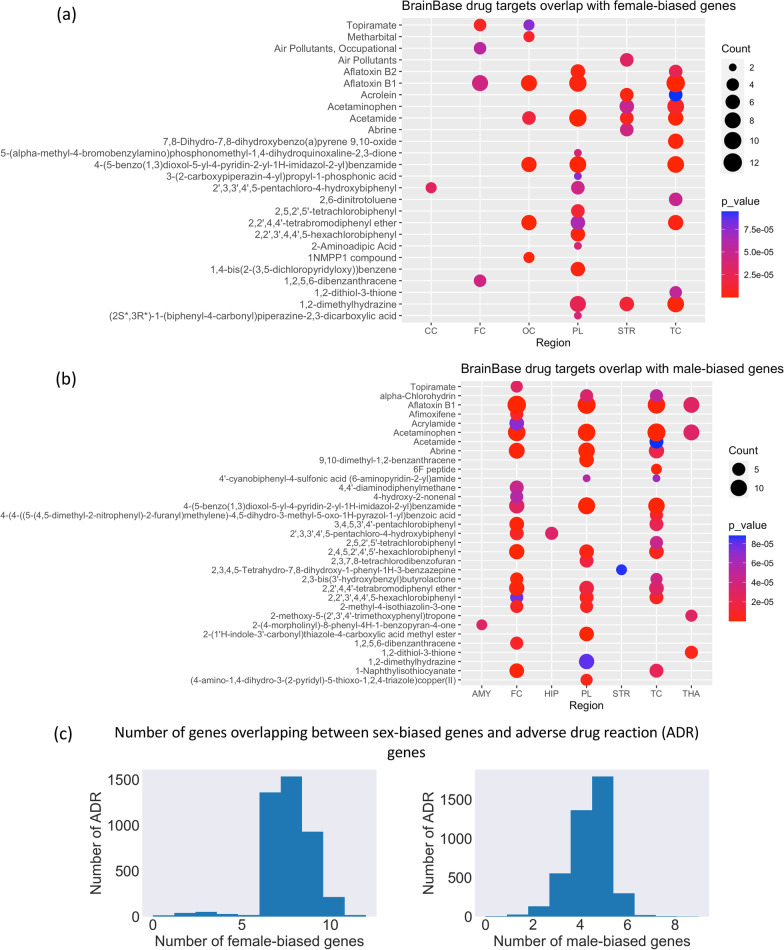
Results and conclusion: In order to systematically characterise sex-specific differences across human brain regions, we collected transcription profiles for more than 16,000 samples from 46 datasets across 11 brain regions. By systematic integration of the data from multiple studies, we identified robust transcription level differences in human brain across to identify male-biased and female-biased genes in each brain region. Firstly, both male and female-biased genes were highly conserved across primates and showed a high overlap with sex-biased genes in other species. Female-biased genes were enriched for neuron-associated processes while male-biased genes were enriched for membranes and nuclear structures. Male-biased genes were enriched on the Y chromosome while female-biased genes were enriched on the X chromosome, which included X chromosome inactivation escapees explaining the origins of some sex differences. Male-biased genes were enriched for mitotic processes while female-biased genes were enriched for synaptic membrane and lumen. Finally, sex-biased genes were enriched for drug-targets and more female-biased genes were affected by adverse drug reactions than male-biased genes. In summary, by building a comprehensive resource of sex differences across human brain regions at gene expression level, we explored their likely origin and functional significance. We have also developed a web resource to make the entire analysis available for the scientific community for further exploration, available at https://joshiapps.cbu.uib.no/SRB_app/.
Keywords: Brain disorders; Conservation; Data integration; Drug response; Gene regulation; Hormones; Human brain; Sex difference.
Plain language summary
Sex and gender differences are present across many organs in humans and have biological and social origins. The differences in brain raise a lot controversy due to small and sometimes contradictory results and its societal implications. In this study, we set out to discern the consistency of sex differences in brain by collecting a huge amount of publicly available transcriptomic data and further explore their likely origin and functional significance. We identified robust sex-biased genes in human brain with female-biased genes enriched for X chromosome genes. We also noted that male- and female-biased genes were enriched for distinct biological processes. Finally, sex-biased genes were enriched for androgen response elements. In summary, our analysis suggests sex-chromosomes and androgens as likely sources of sex differences in brain. Finally, we noted that age affects gene expression in brain more than sex.
© 2023. The Author(s).
Conflict of interest statement
The authors declare that they have no competing interests.
Figures
References
-
- Kamitaki N, Sekar A, Handsaker RE, de Rivera H, Tooley K, Morris DL, Taylor KE, Whelan CW, Tombleson P, Loohuis LMO, ofthe Psychiatric GenomicsConsortium SWG, Boehnke M, Kimberly RP, Kaufman KM, Harley JB, Langefeld CD, Seidman CE, Pato MT, Pato CN, Ophoff RA, Graham RR, Criswell LA, Vyse TJ, McCarroll SA. Complement genes contribute sex-biased vulnerability in diverse disorders. Nature 2020;582 577–581. 10.1038/s41586-020-2277-x - PMC - PubMed
Publication types
MeSH terms
LinkOut - more resources
Full Text Sources
Medical
