. 2023 May 23;9(1):23.
doi: 10.1186/s40813-023-00316-y.

Acetate and propionate effects in response to LPS in a porcine intestinal co-culture model

Affiliations

Acetate and propionate effects in response to LPS in a porcine intestinal co-culture model

Melania Andrani et al. Porcine Health Manag. .

Abstract

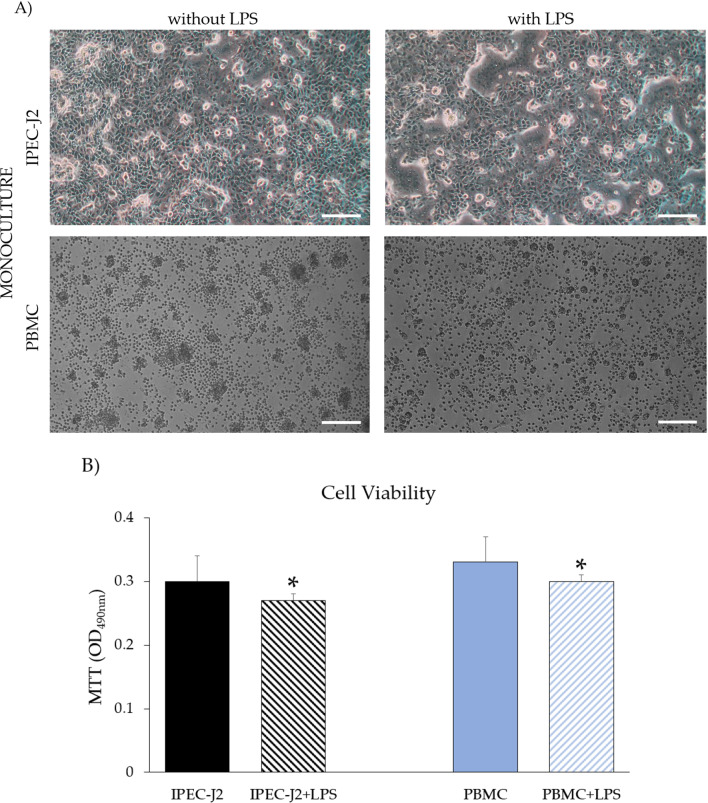
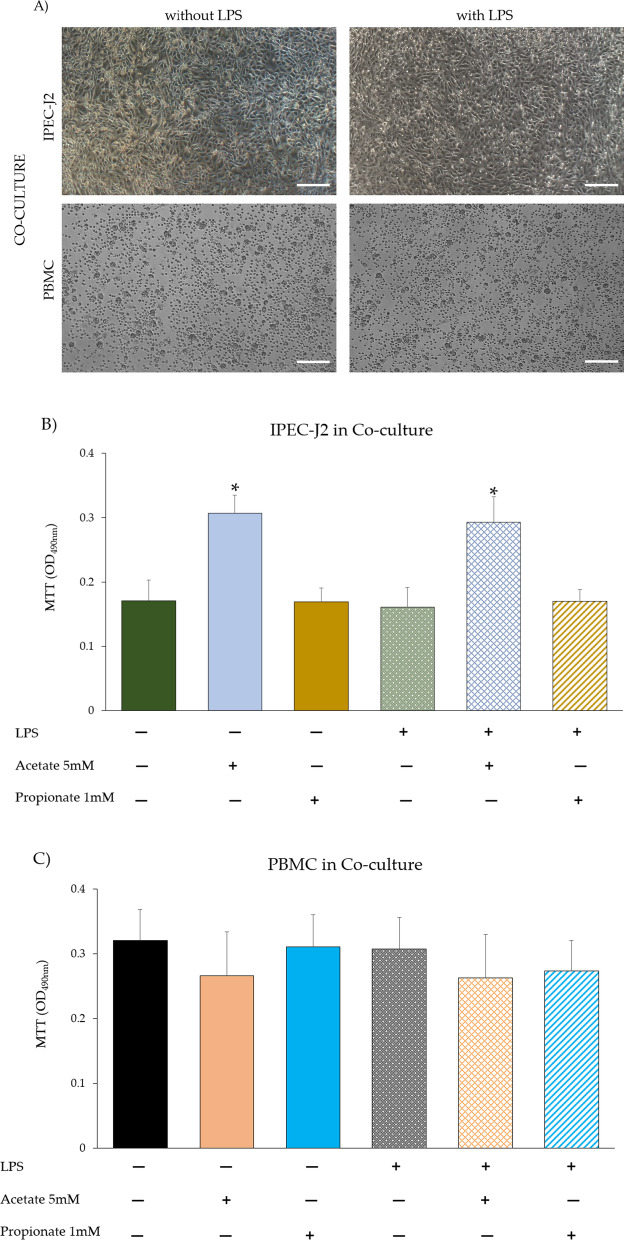
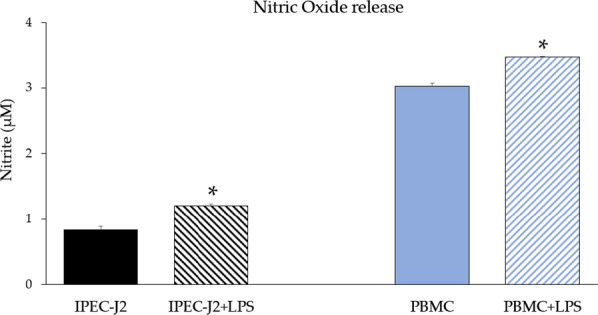
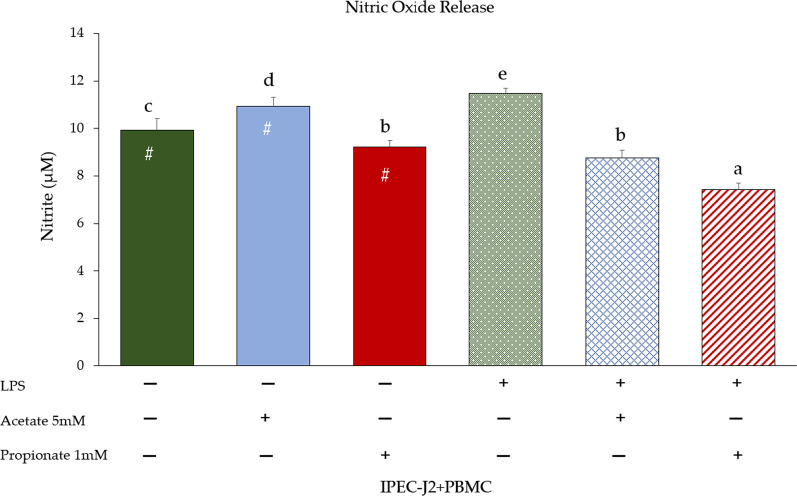
Background: The interest in acetate and propionate as short chain fatty acids (SCFA) derives from research on alternative strategies to the utilization of antibiotics in pig farms. SCFA have a protective role on the intestinal epithelial barrier and improve intestinal immunity by regulating the inflammatory and immune response. This regulation is associated with an increase in intestinal barrier integrity, mediated by the enhancement of tight junction protein (TJp) functions, which prevent the passage of pathogens through the paracellular space. The purpose of this study was to evaluate the effect of in vitro supplementation with SCFA (5 mM acetate and 1 mM propionate) on viability, nitric oxide (NO) release (oxidative stress), NF-κB gene expression, and gene and protein expression of major TJp (occludin [OCLN], zonula occludens-1 [ZO-1], and claudin-4 [CLDN4]) in a porcine intestinal epithelial cell (IPEC-J2) and peripheral blood mononuclear cell (PBMC) co-culture model upon LPS stimulation, through which an acute inflammatory state was simulated.

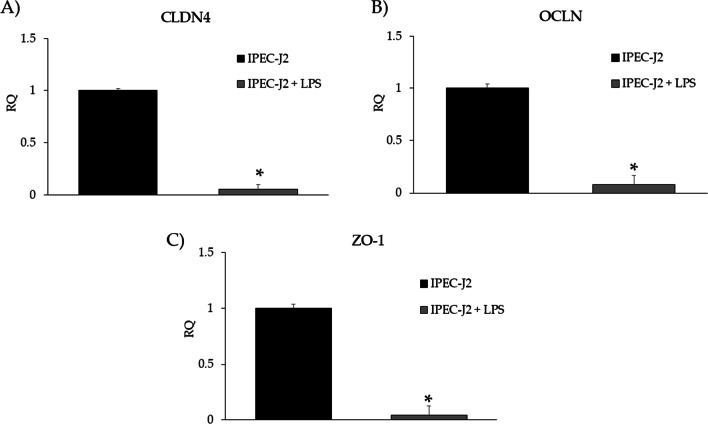
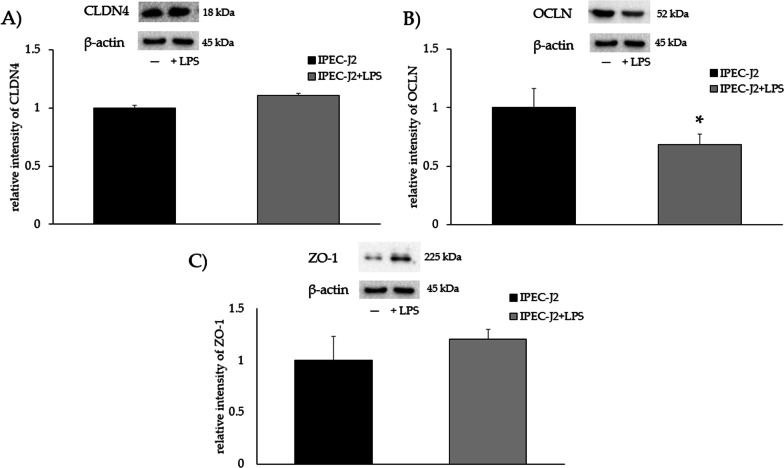
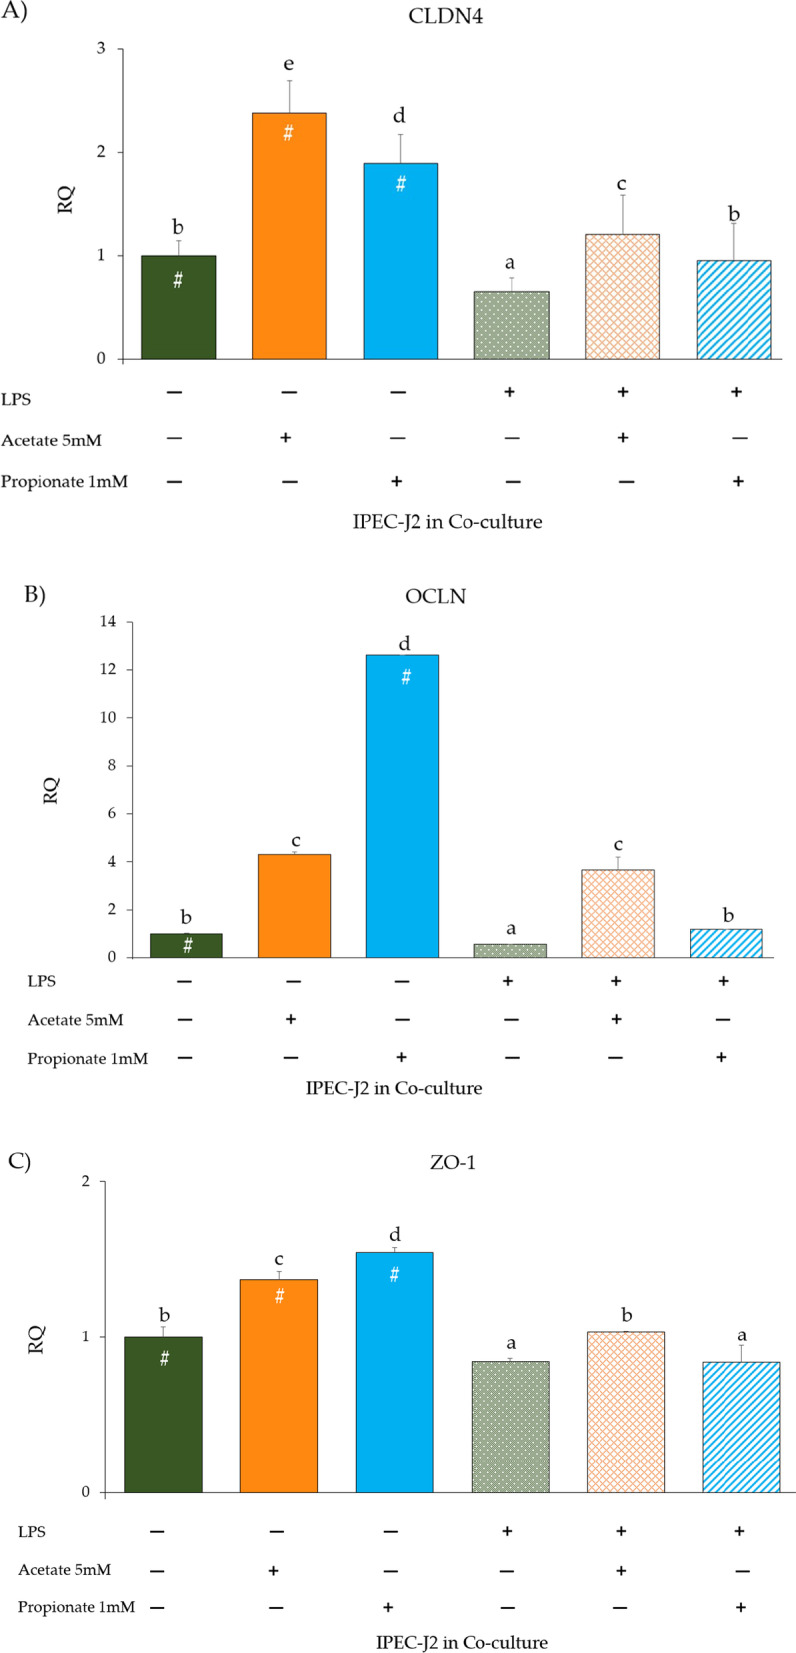
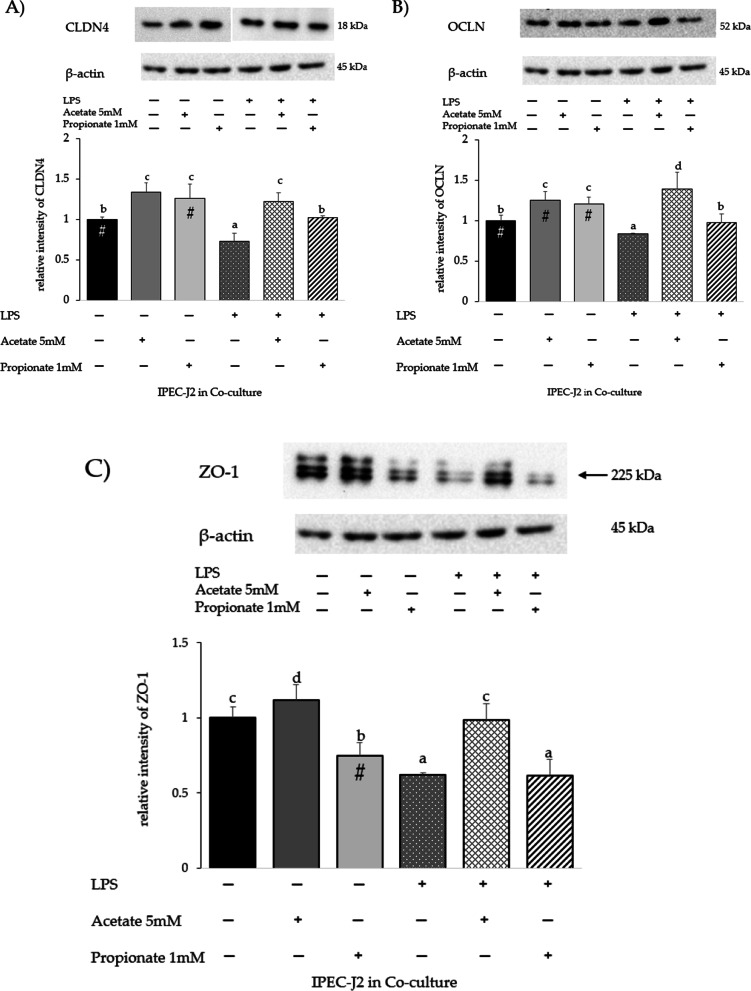
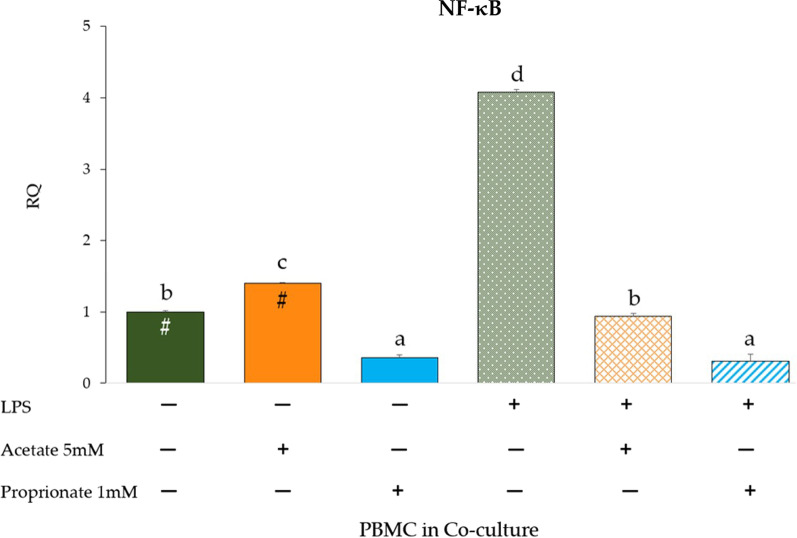
Results: Firstly, the inflammatory stimulus induced by LPS evaluated in the IPEC-J2 monoculture was characterized by a reduction of viability, gene expression of TJp and OCLN protein synthesis, and an increase of NO release. The response evaluated in the co-culture showed that acetate positively stimulated the viability of both untreated and LPS-stimulated IPEC-J2 and reduced the release of NO in LPS-stimulated cells. Acetate also promoted an increase of gene expression of CLDN4, ZO-1, and OCLN, and protein synthesis of CLDN4, OCLN and ZO-1 in untreated and LPS-stimulated cells. Propionate induced a reduction of NO release in both untreated and LPS-stimulated IPEC-J2. In untreated cells, propionate induced an increase of TJp gene expression and of CLDN4 and OCLN protein synthesis. Contrarily, propionate in LPS-stimulated cells induced an increase of CLDN4 and OCLN gene expression and protein synthesis. PBMC were influenced by acetate and propionate supplementation, in that NF-κB expression was strongly downregulated in LPS-stimulated cells.

Conclusions: The present study demonstrates the protective effect of acetate and propionate upon acute inflammation by regulating epithelial tight junction expression and protein synthesis in a co-culture model, which simulates the in vivo interaction between epithelial intestinal cells and local immune cells.

Keywords: Co-culture system; IPEC-J2; Intestinal epithelial barrier function; PBMC; SCFA; Tight junctions.


Conflict of interest statement

The authors declare there are no competing interests.

Figures

Fig. 1
Fig. 1
A Light microscopy of monocultures: IPEC-J2 and PBMC with or without LPS; 4 × original magnification, scale bar = 50 μm. B Viability of IPEC-J2 and PBMC monocultures upon LPS stimulation. Each value represents the mean ± SD of 8 replicates of 6 independent experiments. Asterisks indicate significant differences (p < 0.05) upon comparison with the respective control (IPEC-J2 or PBMC) without LPS
Fig. 2
Fig. 2
A Light microscopy of co-cultures: IPEC-J2 (transwell) and PBMC (well) with or without LPS; 4 × original magnification, scale bar = 50 μm. B Cell viability of IPEC-J2 and C PBMC in co-culture with or without LPS and medium supplementation with acetate (5 mM) or propionate (1 mM) at 24 h of incubation was determined using an MTT assay. Each value represents the mean ± SD of 8 wells of 6 independent experiments. Significant differences (p < 0.05) among groups are indicated by asterisks
Fig. 3
Fig. 3
Nitric oxide release (quantified as nitrite) in supernatants of IPEC-J2 and PBMC monocultures upon LPS stimulation. Each value represents the mean ± SD of 8 replicates of 6 independent experiments. Asterisks indicate significant differences (p < 0.05) upon comparison with the respective control (IPEC-J2 or PBMC) without LPS
Fig. 4
Fig. 4
Effect of co-culture conditions (acetate or propionate treatment) with or without LPS on NO release after 24 h of incubation. Each value represents the mean ± SD of 8 wells of 6 independent experiments. Significant differences (p < 0.05) between each LPS-untreated group and the corresponding LPS-treated group are indicated with a hashtag (#). Different letters indicate significant differences among groups (p < 0.05)
Fig. 5
Fig. 5
A CLDN4, B OCLN, and C ZO-1 gene expression in IPEC-J2 monoculture upon LPS stimulation. Each value represents the mean ± SD of 8 replicates of 6 independent experiments. Asterisks indicate significant differences between groups (p < 0.05). Data were analyzed using the 2−ΔΔCt method, in which the expression levels of the gene, normalized to the expression of the reference gene HPRT1, were expressed as relative quantities (RQ). The analysis was performed by defining IPEC-J2 as reference group
Fig. 6
Fig. 6
A CLDN4, B OCLN, and C ZO-1 protein levels in IPEC-J2 monoculture upon LPS stimulation. Each value represents the mean ± SD of 8 replicates of 6 independent experiments. Asterisks indicate significant differences between groups (p < 0.05). Data were normalized to the reference protein β-actin as relative intensity. The analysis was performed by defining IPEC-J2 as reference group. The samples derived from the same experiment and the gels/blots were processed in parallel. The original blots are presented in Additional file 1: Figure S6A, B, C
Fig. 7
Fig. 7
A CLDN4, B OCLN, and C ZO-1 gene expression in IPEC-J2 co-cultured with PBMC with or without LPS and/or acetate or propionate treatment. Each value represents the mean ± SD of 8 replicates of 6 independent experiments. Significant differences (p < 0.05) between each LPS-untreated group and the corresponding LPS-treated group are indicated with a hashtag (#). Different letters indicate significant differences among groups (p < 0.05). Data were analyzed using the 2−ΔΔCt method, in which the expression levels of the gene, normalized to the expression of the reference gene HPRT1, were expressed as relative quantities (RQ). The analysis was performed by defining untreated IPEC-J2 + PBMC as reference group (first histogram of each graph)
Fig. 8
Fig. 8
A CLDN4, B OCLN, and C ZO-1 proteins in IPEC-J2 co-culture with PBMC with/without LPS and/or acetate or propionate treatment. Each value represents the mean ± SD of 8 replicates of 6 independent experiments. Letters indicate significant differences among groups (p < 0.05). Significant differences (p < 0.05) between each LPS-untreated group and the corresponding LPS-treated group are indicated with a hashtag (#). Data were normalized to the synthesis of the reference protein β-actin as relative intensity. The analysis was performed by defining untreated IPEC-J2 + PBMC as reference group (first histogram of each graph). The samples derived from the same experiment and the gels/blots were processed in parallel. The original blots are presented in Additional file 1: Figures S8 A, B, C
Fig. 9
Fig. 9
NF-κB gene expression in PBMC co-cultured with IPEC-J2 with or without LPS and/or acetate or propionate treatment. Each value represents the mean ± SD of 8 replicates of 6 independent experiments. Significant differences (p < 0.05) between each LPS-untreated group and the corresponding LPS-treated group are indicated with a hashtag (#). Different letters indicate significant differences among groups (p < 0.05). Data were analyzed using the 2−ΔΔCt method, in which the expression levels of the gene, normalized to the expression of the reference gene HPRT1, were expressed as relative quantities (RQ). The analysis was performed by defining untreated IPEC-J2 + PBMC as reference group (first histogram of the graph)

Similar articles

Cited by

References

    1. Flint HJ, Scott KP, Duncan SH, Louis P, Forano E. Microbial degradation of complex carbohydrates in the gut. Gut Microbes. 2012 doi: 10.4161/gmic.19897. - DOI - PMC - PubMed
    1. Jiao A, Yu B, He J, Yu J, Zheng P, Luo Y, et al. Short chain fatty acids could prevent fat deposition in pigs via regulating related hormones and genes. Food Funct. 2020 doi: 10.1039/C9FO02585E. - DOI - PubMed
    1. Portincasa P, Bonfrate L, Vacca M, De Angelis M, Farella I, Lanza E, et al. Gut microbiota and short chain fatty acids: implications in glucose homeostasis. Int J Mol Sci. 2022 doi: 10.3390/ijms23031105. - DOI - PMC - PubMed
    1. Zhang G, Zhao JB, Dong WX, Song XM, Lin G, Li DF, et al. Yeast-derived mannan-rich fraction as an alternative for zinc oxide to alleviate diarrhea incidence and improve growth performance in weaned pigs. Anim Feed Sci Technol. 2021 doi: 10.1016/j.anifeedsci.2021.115111. - DOI
    1. Zhang Z, Zhang H, Chen T, Shi L, Wang D, Tang D. Regulatory role of short—chain fatty acids in inflammatory bowel disease. Cell Commun Signal. 2022 doi: 10.1186/s12964-022-00869-5. - DOI - PMC - PubMed

LinkOut - more resources