. 2023 May 23;24(1):128.
doi: 10.1186/s13059-023-02963-4.

Genomic hallmarks and therapeutic implications of G0 cell cycle arrest in cancer

Affiliations

Genomic hallmarks and therapeutic implications of G0 cell cycle arrest in cancer

Anna J Wiecek et al. Genome Biol. .

Abstract

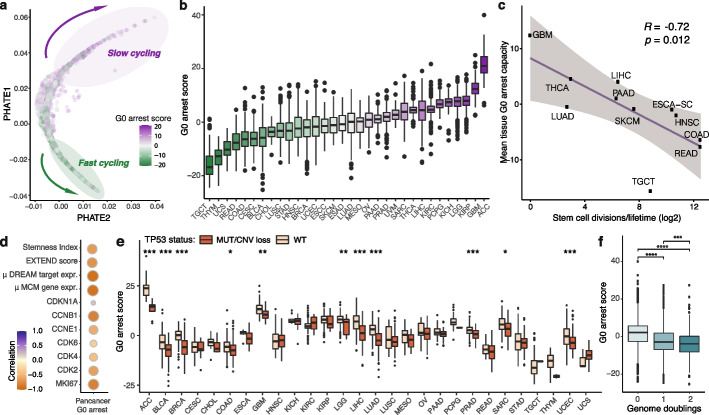
Background: Therapy resistance in cancer is often driven by a subpopulation of cells that are temporarily arrested in a non-proliferative G0 state, which is difficult to capture and whose mutational drivers remain largely unknown.

Results: We develop methodology to robustly identify this state from transcriptomic signals and characterise its prevalence and genomic constraints in solid primary tumours. We show that G0 arrest preferentially emerges in the context of more stable, less mutated genomes which maintain TP53 integrity and lack the hallmarks of DNA damage repair deficiency, while presenting increased APOBEC mutagenesis. We employ machine learning to uncover novel genomic dependencies of this process and validate the role of the centrosomal gene CEP89 as a modulator of proliferation and G0 arrest capacity. Lastly, we demonstrate that G0 arrest underlies unfavourable responses to various therapies exploiting cell cycle, kinase signalling and epigenetic mechanisms in single-cell data.

Conclusions: We propose a G0 arrest transcriptional signature that is linked with therapeutic resistance and can be used to further study and clinically track this state.

Keywords: Bulk/single-cell sequencing; Cancer; Cell cycle arrest; Data integration; G0; Genomic dependencies; Machine learning; Persister cells.


Conflict of interest statement

The authors declare that they have no competing interests.

Figures

Fig. 1
Fig. 1
Methodology for quantifying G0 arrest in cancer. a Workflow for evaluating G0 arrest from RNA-seq data; 139 genes differentially expressed in multiple forms of quiescence were employed to score G0 arrest across cancer tissues. b Receiver operating characteristic (ROC) curves illustrating the performance of the Z-score methodology on separating actively proliferating and G0 arrested cells in seven single-cell (continuous curves) and bulk RNA-seq (dotted curves) datasets. AUC area under the curve. c Compared classification accuracies of the G0 arrest Z-score approach and classic cell proliferation markers across the seven single-cell/bulk RNA-seq validation datasets. d G0 arrest levels of embryonic fibroblast cells under serum starvation for various amounts of time. Replicates are depicted in the same colour. e Representative images of lung cancer cell lines immunostained and analysed to detect the G0 arrest fraction. Hoechst (labels all nuclei) is in blue, phospho-Rb in green and EdU in red in the merged image. White dashed circles highlight G0 arrested cells that are negative for both phospho-Rb and EdU signals. Scale bar: 100 µm. f Graphs show single-cell quantification of phospho-Rb and EdU intensities taken from images and used to define the cut-off to calculate the G0 arrest fraction (green boxes). Images in e and graphs in f are taken from the A549 cell line. gh Correlation between theoretical estimates of a G0 or G1 state and the fraction of cells entering G0 arrest in nine lung adenocarcinoma cell lines, as assessed through g phospho-Rb assays and h EdU assays. Mean of n = 3 is shown for the average percentage of G0 arrested cells
Fig. 2
Fig. 2
Pan-cancer evaluation of proliferative heterogeneity and linked tumour hallmarks. a PHATE plot illustrating the wide spectrum of proliferative to slow cycling/arrested states across 8005 primary tumour samples from TCGA. Each sample is coloured according to the relative G0 arrest level. b Variation in tumour G0 arrest levels across different cancer tissues. c Correlation between mean G0 arrest capacity and stem cell division estimates for various tissue types. d Correlating tumour G0 arrest scores with cancer cell stemness (Stemness Index), telomerase activity (EXTEND score), p21 activity (CDKN1A) and the expression of several commonly used proliferation markers. The Pearson correlation coefficient is displayed. RC replication complex. e Consistently higher levels of G0 arrest are detected in samples with functional p53. f Lower G0 arrest scores are observed in tumours with one or two whole-genome duplication events. Wilcoxon rank-sum test p-values are displayed in boxplots, *p < 0.05; **p < 0.01; ***p < 0.001; ****p < 0.0001
Fig. 3
Fig. 3
Genomic landscape of G0 arrest decisions in cancer. a Cancer drivers with mutations or copy number alterations depleted pan-cancer in a G0 arrest context. Features further selected by the pan-cancer model are highlighted. b Schematic of the ensemble elastic net modelling employed to prioritise genomic changes associated with G0 arrest. c Genomic events significantly associated with G0 arrest, ranked according to their importance in the model (highest to lowest). Each point depicts an individual tumour sample, coloured by the value of the respective feature. For discrete variables, purple indicates the presence of the feature and green its absence. The Shapley values indicate the impact of individual feature values on the G0 arrest score prediction. d G0 arrest levels are significantly reduced in microsatellite unstable (MSI) samples in stomach adenocarcinoma (STAD) and uterine corpus endometrial carcinoma (UCEC), with the same trend (albeit not significant) shown in colon adenocarcinoma (COAD). Wilcoxon rank-sum test *p < 0.05; **p < 0.01. e Genomic alterations are depleted across DNA repair pathways during G0 arrest. Odds ratios of mutational load on pathway in G0 arrest are depicted, along with confidence intervals. CS, chromosome segregation; p53, p53 pathway; UR, ubiquitylation response; CPF, checkpoint factors; TM, telomere maintenance; CR, chromatin remodelling; TLS, translesion synthesis; NHEJ, non-homologous end joining; NER, nucleotide excision repair; MMR, mismatch repair; FA, Fanconi Anaemia; BER, base excision repair. f G0 arrest scores are increased in cell lines with slow doubling time across MCF7 strains, which also show lower prevalence of PTEN mutations. g Tissue-specific changes in G0 arrest between samples with/without quiescence-associated deletions (blue), amplifications (red) and SNVs (brown) within the TCGA cohort (top) and external validation datasets (bottom)
Fig. 4
Fig. 4
CEP89 amplification is associated with lower G0 arrest capacity. a Network illustrating CEP89 interactions with cell cycle genes (from GeneMania). The edge colour indicates the interaction type, with green representing genetic interactions, orange representing predicted interactions and purple indicating pathway interactions. The edge width illustrates the interaction weight. b CA20 scores are significantly increased in TCGA primary tumours containing a CEP89 amplification. c Pan-cancer relationship between CA20 and G0 arrest scores across the TCGA cohort. d Cox proportional hazards analysis estimates of the log hazards ratio for the impact of CEP89 expression on patient prognosis within individual cancer studies, after adjusting for tumour stage. Patients with high expression of CEP89 show significantly worse prognosis within ACC, LUSC, LIHC, KIRC and STAD, but significantly better prognosis within HNSC, PAAD and KIRP studies. e Western blot showing depletion of Cep89 protein 48 h after siRNA transfection of NCI-H1299 cells. Mock is lipofectamine only; NTC is non-targeting control siRNA. B-actin is used as a loading control. f Graphs show that Cep89 depletion in NCI-H1299 cells leads to a reduction in nuclear number and an increase in the fraction of G0 arrested cells, measured by an increase in the percentage of EdU negative (24 h EdU pulse) and Phospho-Ser 807/811 Rb negative cells. One-way ANOVA, *p < 0.05, **p < 0.01. Mean of n = 3
Fig. 5
Fig. 5
Pan-cancer characterisation of individual G0 stress response programmes. a-e Comparison of correlation coefficients between stress response programme scores and a mean expression of CDK4 and CDK6, b mean expression of curated contact inhibition genes, c a transcriptional MAPK Pathway Activity Score (MPAS), d mean expression of curated serum starvation genes and e CDKN1A expression (encoding for p21), across TCGA cancers. The correlations expected to be strongest (either negative or positive) are denoted by an asterisk. The generic G0 arrest score refers to scores calculated using the original list of 139 genes differentially expressed across all 5 forms of G0 arrest. f Comparison of stress response programme scores measured in cancer cell lines before (grey) and after (red) palbociclib treatment across three validation studies. Datasets used for validation are denoted by their corresponding GEO series accession number. g Predicted stress response diversity in samples with high levels of G0 arrest across individual cancer types. The same colour legend as in a is applied. Grey bars represent the proportion of samples for which the G0 arrest inducer could not be estimated
Fig. 6
Fig. 6
Impact of G0 arrest on patient prognosis and treatment response. a Disease-specific survival based on proliferation/G0 arrest levels for patients from TCGA within 15 years of follow-up. Patients with increased levels of G0 arrest in primary tumours showed significantly better prognosis than patients with fast proliferating tumours. bc Hazard ratio ranges illustrating the impact of different forms of G0 induction (b) and different tissues (c) on patient prognosis, after taking into account potential confounding factors. Values above 0 indicate significantly better prognosis when tumours contain high proportions of cells arrested in G0. d Change in G0 arrest scores inferred from bulk RNA-seq across breast, pancreatic, colorectal and skin cancer cells in response to treatment with the CDK4/6 inhibitor palbociclib, 5-FU or the BRAF inhibitor vemurafenib. ef UMAP plot illustrating the response of the TP53-proficient RKO colorectal cancer cell line to various 5-FU doses and the corresponding proportions of cells predicted to be arrested/proliferating. Each dot is an individual cell, coloured according to its G0 arrest level. gh The same as previous, but for the TP53-deficient SW480 cell line. ij UMAP plot illustrating the response of individual PC9 NSCLC cells to the EGFR inhibitor erlotinib across several time points and the corresponding proportion of cells predicted to be arrested/proliferating. k Principal component analysis illustrating the superimposition of single-cell RNA-seq profiles (circles) of G0 arrested NSCLC cells before/after EGFR inhibition onto the bulk RNA-seq reference data (triangles) for MCF10A cells occupying various stress response states. l The proportion of NSCLC cells in k predicted to occupy different stress response states across several time points
Fig. 7
Fig. 7
Optimisation of the G0 arrest signature for use in single-cell RNA-seq data. a Methodology for refining the gene signature of G0 arrest: random forest classifiers are trained to distinguish arrested from cycling tumours on three high confidence datasets; Gini index thresholding is optimised to prioritise a final list of 35 genes. b Gini index variation, correlation with experimentally measured quiescence via EdU and phospho-Rb staining assays, and corresponding p-values are plotted as the number of genes considered in the model is increased. The vertical black dashed line indicates the threshold chosen for the final solution of 35 genes. The horizontal grey dotted line indicates the threshold for p-value significance. c Additional external validation of the 35 gene signature acting as a classifier of G0 arrested and proliferating cells in single-cell and bulk datasets. d Dropout in single-cell data by gene signature. The percentage of genes out of the 35 (red) and 139 (grey) gene lists with reported expression across the single-cell RNA-seq datasets analysed in this study. e Proportion of cycling and G0 arrested cells estimated in single-cell datasets of p53 wild-type and mutant lines treated with 5FU, as well as cells treated with EGFR inhibitors. Data as in Fig. 6

References

    1. Hanahan D, Weinberg RA. The hallmarks of cancer. Cell. 2000;100(1):57–70. - PubMed
    1. van Dijk D, Dhar R, Missarova AM, Espinar L, Blevins WR, Lehner B, et al. Slow-growing cells within isogenic populations have increased RNA polymerase error rates and DNA damage. Nat Commun. 2015;6:7972. - PMC - PubMed
    1. Davis JE, Kirk J, Ji Y, Tang DG. Tumor dormancy and slow-cycling cancer cells. Adv Exp Med Biol. 2019;1164:199–206. - PMC - PubMed
    1. Phan TG, Croucher PI. The dormant cancer cell life cycle. Nat Rev Cancer. 2020;20(7):398–411. - PubMed
    1. Rehman SK, Haynes J, Collignon E, Brown KR, Wang Y, Nixon AML, et al. Colorectal cancer cells enter a diapause-like DTP state to survive chemotherapy. Cell. 2021;184(1):226–42.e21. - PMC - PubMed

Publication types