. 2023 May 23;12(1):49.
doi: 10.1186/s40164-023-00407-0.

ScRNA-seq revealed an immunosuppression state and tumor microenvironment heterogeneity related to lymph node metastasis in prostate cancer

Affiliations

ScRNA-seq revealed an immunosuppression state and tumor microenvironment heterogeneity related to lymph node metastasis in prostate cancer

Shiyong Xin et al. Exp Hematol Oncol. .

Erratum in

Abstract

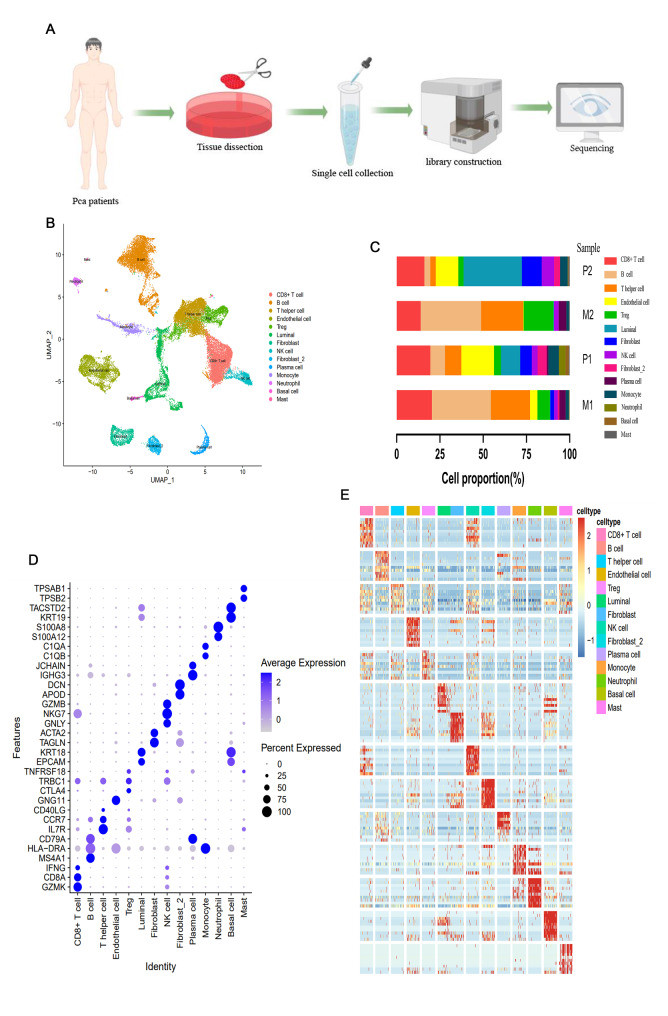
Background: Metastasis is a crucial aspect of disease progression leading to death in patients with prostate cancer (PCa). However, its mechanism remains unclear. We aimed to explore the mechanism of lymph node metastasis (LNM) by analyzing the heterogeneity of tumor microenvironment (TME) in PCa using scRNA-seq.

Methods: A total of 32,766 cells were obtained from four PCa tissue samples for scRNA-seq, annotated, and grouped. InferCNV, GSVA, DEG functional enrichment analysis, trajectory analysis, intercellular network evaluation, and transcription factor analysis were carried out for each cell subgroup. Furthermore, validation experiments targeting luminal cell subgroups and CXCR4 + fibroblast subgroup were performed.

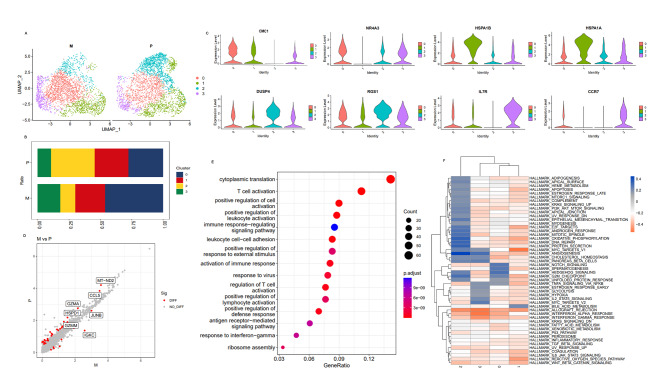
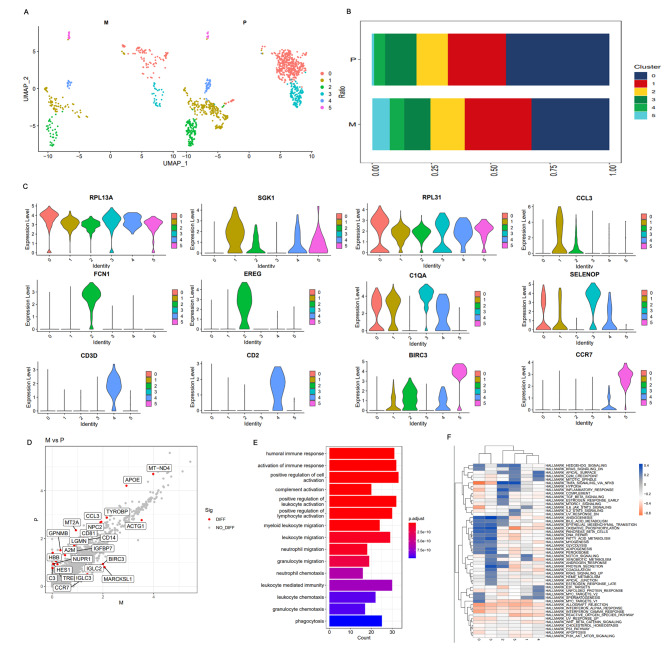
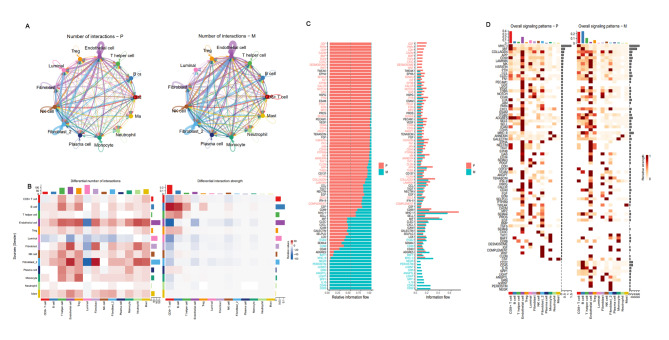
Results: The results showed that only EEF2 + and FOLH1 + luminal subgroups were present in LNM, and they appeared at the initial stage of luminal cell differentiation, which were comfirmed by verification experiments. The MYC pathway was enriched in the EEF2 + and FOLH1 + luminal subgroups, and MYC was associated with PCa LNM. Moreover, MYC did not only promote the progression of PCa, but also led to immunosuppression in TME by regulating PDL1 and CD47. The proportion of CD8 + T cells in TME and among NK cells and monocytes was lower in LNM than in the primary lesion, while the opposite was true for Th and Treg cells. Furthermore, these immune cells in TME underwent transcriptional reprogramming, including CD8 + T subgroups of CCR7 + and IL7R+, as well as M2-like monocyte subgroups expressing tumor-associated signature genes, like CCR7, SGKI, and RPL31. Furthermore, STEAP4+, ADGRF5 + and CXCR4+, and SRGNC + fibroblast subgroups were closely related to tumor progression, tumor metabolism, and immunosuppression, indicating their contributions in PCa metastasis. Meanwhile, The presence of CXCR4 + Fibroblasts in PCa was confirmed by polychromatic immunofluorescence.

Conclusions: The significant heterogeneity of luminal, immune, and interstitial cells in PCa LNM may not only directly contribute to tumor progression, but also indirectly result in TME immunosuppression, which may be the cause of metastasis in PCa and in which MYC played an role.

Keywords: Immunosuppression; Metastasis; Prostate Cancer; Single-cell RNA sequencing; Tumor Microenvironment.


Conflict of interest statement

The authors declare that they have no conflicts of interest.

Figures

Fig. 1
Fig. 1
Fourteen cell types in PCa were identified by scRNA-seq. (A). Study flow chart; (B). Main cell clusters in PCa tissue demonstrated using uniform manifold approximation and projection (UMAP) analysis are colored and labeled according to their featured gene expression profiles. (C). Cell numbers and percentages of each cluster in each sample; (D). Marker gene expression for each cell type, where dot size and color represent percentage of marker gene expression (pct. exp) and averaged scaled expression (avg. exp. scale) value, respectively; (E). Heatmap generated based on expression levels of top ten marker genes in each cluster
Fig. 2
Fig. 2
Heterogeneity and CNV analysis of luminal cells; (A). Seven main luminal subgroups identified using UMAP analysis; (B). Feature plots for marker genes; Color legend shows log1p normalized gene expression levels; (C). Heatmap of average expression for top five DEGs among seven subgroups. Color legend indicates normalized gene expression levels among subgroups; (D). GSEA heatmap for 50 hallmark gene sets in MSigDB database among seven luminal subclusters; (E). Hierarchical heatmap showing large-scale CNVs in seven luminal subgroups; (F). Differential analysis heatmap of transcriptional regulators among seven luminal subgroups; (G). Luminal subgroups in primary and metastatic lesions identified using UMAP analysis; (H). Scatter plot of DEGs between primary lesion and lymphatic metastases. Top 10 DEGs are labeled in red; (I). Functional enrichment DEG analysis in primary lesion and lymphatic metastases. (J). Heatmap of activated transcription factors in lymphatic metastases and primary lesions. Red indicates high activity, and blue shows low activity
Fig. 3
Fig. 3
EEF2 + and FOLH1 + luminal cells existed in PCa. (A). Immunohistochemistry analysis of CCL5 and EEF1A2 through PCa tissue microarray; (B). Immunofluorescence of CCL5 and EEF1A2 in LNCap. (C-D). EDU showed the cell proliferation capacity of LNCaP after CCL5 and EEF1A2 down-regulation. (E–F). Metastatic ability of LNCAP cells was analyzed using transwell assay after down-regulation of CCL5 and EEF1A2
Fig. 4
Fig. 4
MYC drives tumor progression through CD47 and PD-L1. (A). Immunohistochemistry analysis of MYC through PCa tissue microarray; N: Normal prostate tissue, T: Prostate cancer tissue, LM: lymphatic metastases; (B). Immunofluorescence of MYC, PDL1, and CD47 in LNCap; (C). Bioinformatics analysis of binding sites of MYC to PDL1 and CD47; (D). MYCmRNA, PDL1mRNA, and CD47mRNA expression in LNCaP after MYC down-regulation. (E–F). MYC, PDL1, and CD47 western blot protein expression analysis in LNCaP; (G–H). Metastatic ability of LNCAP cells analyzed using transwell assay after down-regulation of MYC.
Fig. 5
Fig. 5
Luminal cell trajectory analysis. (A–C). Monocle 2 trajectory plot showing luminal subcluster and state dynamics; (D). Three representative genes with different expression patterns in the process of luminal cell differentiation: MAZ, POTEN, and SPN; (E). Hierarchical clustering heatmap showing four subclusters of differentially expressed genes along with luminal cell pseudotime. (F). Hierarchical clustering heatmap showing four subclusters of differentially expressed genes along with pseudotime for three cell types (from cell fate1 to cell fate2)
Fig. 6
Fig. 6
Heterogeneity analysis of CD+8 T cells between primary and metastatic lesions; (A). Subcluster of CD+8 T distribution between primary and metastatic lesions using UMAP-2 analysis; (B). Percentage of four CD+8 T subclusters between primary and metastasis lesions; (C). Violin plots showing normalized marker gene expression levels across four subclusters of CD+8 T cells; (D). DEGs in metastasis identified using edgeR package with comparison to primary lesion. Scatter plots showing respective DEG profiles in PCa. Red spots indicate up-regulated genes; green spots indicate no significant gene change; (E). Functional DEG enrichment analysis; (F). GSEA heatmap of 50 hallmark gene sets in MSigDB database among four CD+8 T cell subclusters
Fig. 7
Fig. 7
Heterogeneity analysis of myeloid cells in primary and lymphatic metastatic TME of PCa. (A). Monocyte distribution subcluster between metastatic and primary lesions using UMAP-2 analysis; (B). Mean percentage of monocyte subclusters in primary and metastatic lesions; (C). Violin plots showing normalized expression levels of marker genes across monocyte subclusters; (D). Metastasis DEGs identified using edgeR package with comparison to primary lesion. Scatter plots showing respective DEG profiles in PCa. Red spots indicate up-regulated genes; green spots indicate no significant change in genes; (E). Functional enrichment analysis for monocyte DEGs; (F). GSEA heatmap of 50 hallmark gene sets in MSigDB database among monocyte subclusters
Fig. 8
Fig. 8
Heterogeneity analysis of fibroblasts in primary and lymphatic metastatic PCa TME. (A). Subcluster of fibroblast distribution between metastatic and primary lesions using UMAP-2 analysis; (B). Mean percentage of fibroblast subclusters in primary and metastatic lesions; (C). Violin plots showing normalized expression levels of marker genes across fibroblast subclusters; (D). Tissue immunofluorescence showing CXCR4 + Fibroblasts in normal tissue, primary lesions and lymphatic metastases; red fluorescence representing SMA and green fluorescence representing CXCR4.(E).DEGs in metastasis were identified using edgeR package with comparison to primary lesion. Scatter plots showing respective DEG profiles in PCa. Red spots indicate up-regulated genes; green spots indicate no significant change in genes; (F). Functional enrichment analysis of fibroblast DEGs; (G). GSEA heatmap of 50 hallmark gene sets in MSigDB database among fibroblast subclusters
Fig. 9
Fig. 9
Cell-to-cell communication in primary and lymphatic metastatic PCa TME. (A). Cell communication network in primary and lymphatic metastatic lesions; (B). Heatmap showing cell interaction pathways in primary and lymphatic metastatic lesions identified for each cell type. (C). Bar plots of signaling axes ranking using overall information flow differences in interaction networks between primary and lymphatic metastatic lesions. Top signaling pathways with red-colored labels are more enriched in primary lesion, middle pathways with black-colored labels are equally enriched in lymphatic metastatic and primary lesions, and bottom pathways with green-colored labels are more enriched in lymphatic metastatic lesions. (D). Overall signaling patterns for each cell type in primary and lymphatic metastatic lesions

Similar articles

Cited by

References

    1. Ferlay J, Colombet M, Soerjomataram I, Mathers C, Parkin DM, Piñeros M, et al. Estimating the global cancer incidence and mortality in 2018: GLOBOCAN sources and methods. Int J Cancer. 2019;144:1941–53. doi: 10.1002/ijc.31937. - DOI - PubMed
    1. Zhang X. Interactions between cancer cells and bone microenvironment promote bone metastasis in prostate cancer. Cancer Commun (Lond) 2019;39:76. doi: 10.1186/s40880-019-0425-1. - DOI - PMC - PubMed
    1. Laplane L, Duluc D, Bikfalvi A, Larmonier N, Pradeu T. Beyond the tumour microenvironment. Int J Cancer. 2019;145:2611–8. doi: 10.1002/ijc.32343. - DOI - PMC - PubMed
    1. Hanahan D, Weinberg RA. Hallmarks of cancer: the next generation. Cell. 2011;144:646–74. doi: 10.1016/j.cell.2011.02.013. - DOI - PubMed
    1. Wirtz D, Konstantopoulos K, Searson PC. The physics of cancer: the role of physical interactions and mechanical forces in metastasis. Nat Rev Cancer. 2011;11:512–22. doi: 10.1038/nrc3080. - DOI - PMC - PubMed