

The initial age-associated decline in early T-cell progenitors reflects fewer pre-thymic progenitors and altered signals in the bone marrow and thymus microenvironments
- PMID: 37221658
- PMCID: PMC10410006
- DOI: 10.1111/acel.13870
The initial age-associated decline in early T-cell progenitors reflects fewer pre-thymic progenitors and altered signals in the bone marrow and thymus microenvironments
Abstract
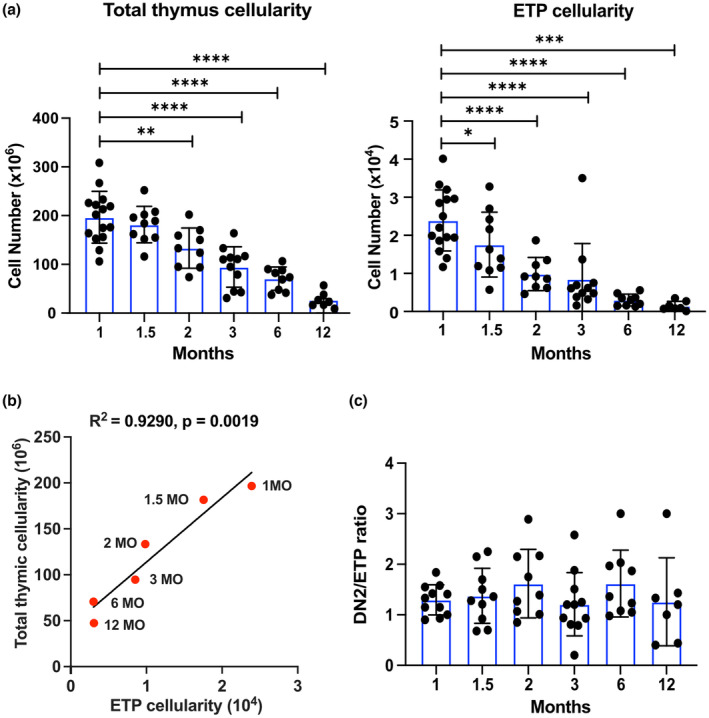
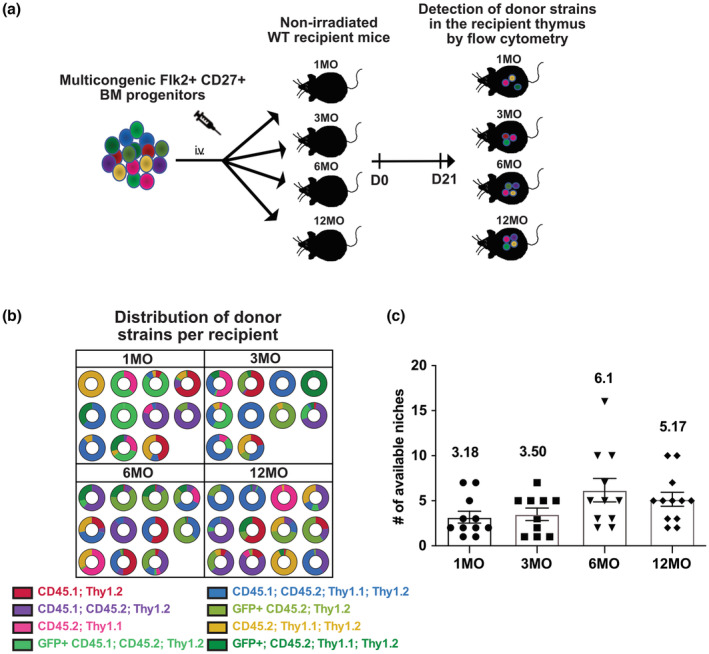
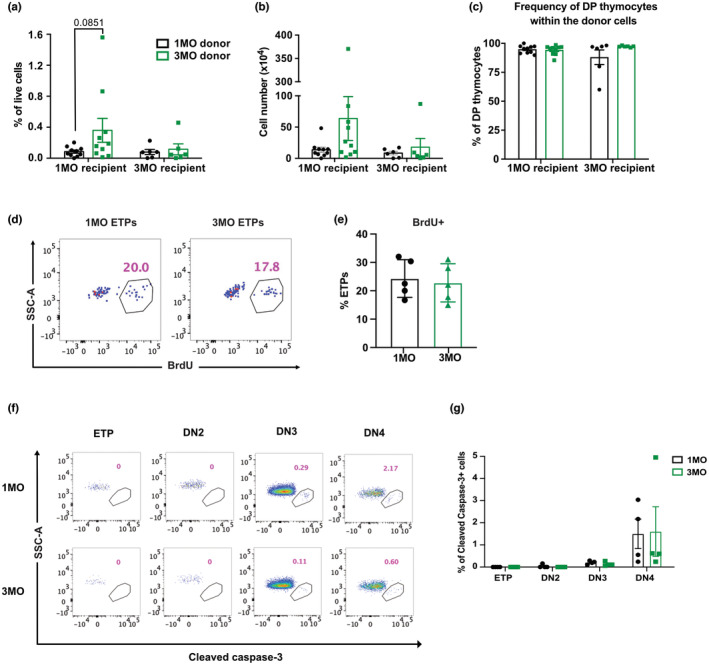
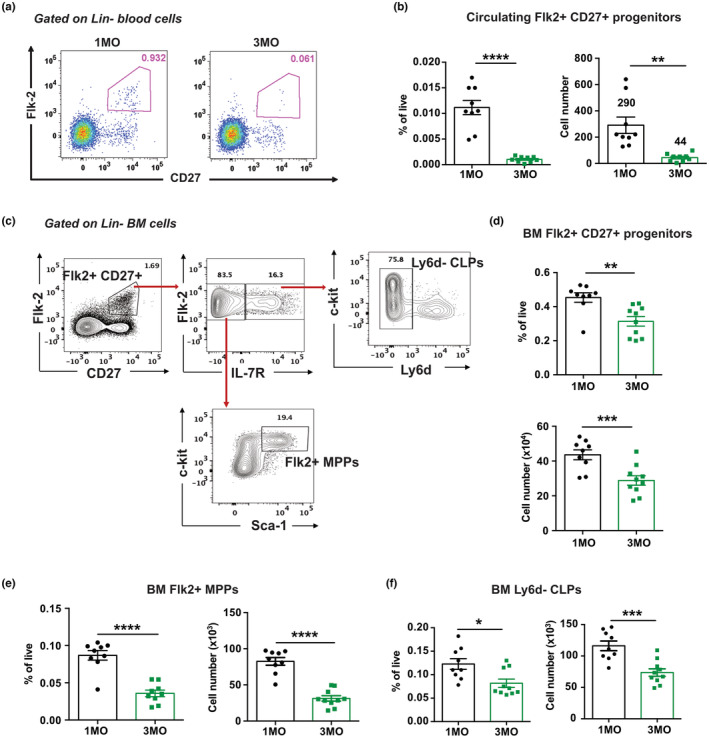
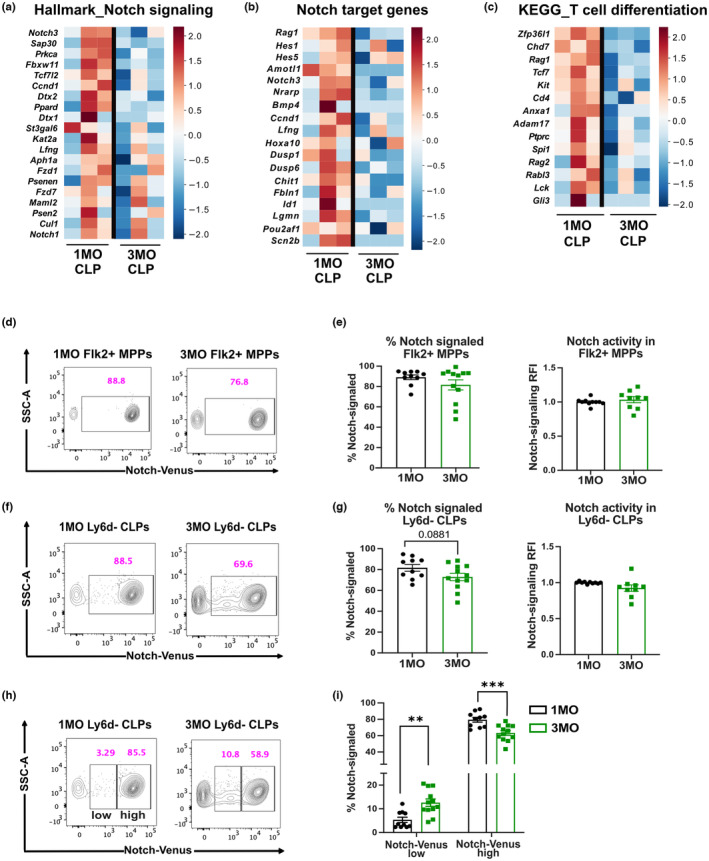
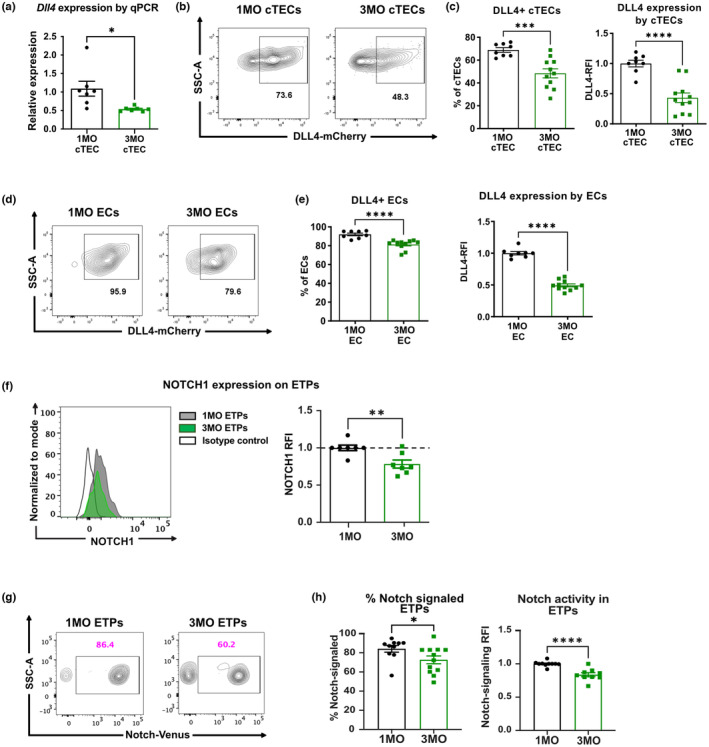
Age-related thymus involution results in decreased T-cell production, contributing to increased susceptibility to pathogens and reduced vaccine responsiveness. Elucidating mechanisms underlying thymus involution will inform strategies to restore thymopoiesis with age. The thymus is colonized by circulating bone marrow (BM)-derived thymus seeding progenitors (TSPs) that differentiate into early T-cell progenitors (ETPs). We find that ETP cellularity declines as early as 3 months (3MO) of age in mice. This initial ETP reduction could reflect changes in thymic stromal niches and/or pre-thymic progenitors. Using a multicongenic progenitor transfer approach, we demonstrate that the number of functional TSP/ETP niches does not diminish with age. Instead, the number of pre-thymic lymphoid progenitors in the BM and blood is substantially reduced by 3MO, although their intrinsic ability to seed and differentiate in the thymus is maintained. Additionally, Notch signaling in BM lymphoid progenitors and in ETPs diminishes by 3MO, suggesting reduced niche quality in the BM and thymus contribute to the early decline in ETPs. Together, these findings indicate that diminished BM lymphopoiesis and thymic stromal support contribute to an initial reduction in ETPs in young adulthood, setting the stage for progressive age-associated thymus involution.
Keywords: aging; early T-cell progenitors; hematopoiesis; thymus involution.
© 2023 The Authors. Aging Cell published by Anatomical Society and John Wiley & Sons Ltd.
Conflict of interest statement
The authors declare no conflicts of interest.
Figures
Similar articles
-
Lymphohematopoietic progenitors do not have a synchronized defect with age-related thymic involution.Aging Cell. 2007 Oct;6(5):663-72. doi: 10.1111/j.1474-9726.2007.00325.x. Epub 2007 Aug 6. Aging Cell. 2007. PMID: 17681038
-
Aging induced decline in T-lymphopoiesis is primarily dependent on status of progenitor niches in the bone marrow and thymus.Aging (Albany NY). 2012 Sep;4(9):606-19. doi: 10.18632/aging.100487. Aging (Albany NY). 2012. PMID: 23047952 Free PMC article.
-
Enhancing T lineage production in aged mice: a novel function of Foxn1 in the bone marrow niche.J Immunol. 2013 Dec 1;191(11):5583-93. doi: 10.4049/jimmunol.1202278. Epub 2013 Nov 1. J Immunol. 2013. PMID: 24184560 Free PMC article.
-
Age- and disease-related decline in immune function: an opportunity for "thymus-boosting" therapies.Tissue Eng. 1999 Dec;5(6):499-514. doi: 10.1089/ten.1999.5.499. Tissue Eng. 1999. PMID: 10611542 Review.
-
Thymic Engraftment by in vitro-Derived Progenitor T Cells in Young and Aged Mice.Front Immunol. 2020 Aug 18;11:1850. doi: 10.3389/fimmu.2020.01850. eCollection 2020. Front Immunol. 2020. PMID: 32973763 Free PMC article. Review.
Cited by
-
Morphological characteristics of microenvironment in the human thymus during fetal development.BMC Res Notes. 2025 Mar 3;18(1):92. doi: 10.1186/s13104-025-07109-2. BMC Res Notes. 2025. PMID: 40033348 Free PMC article.
-
Endogenous thymic regeneration: restoring T cell production following injury.Nat Rev Immunol. 2025 Jun;25(6):407-424. doi: 10.1038/s41577-024-01119-0. Epub 2025 Jan 6. Nat Rev Immunol. 2025. PMID: 39762553 Review.
-
Linking ferroptosis to thymic involution.Nat Aging. 2024 Dec;4(12):1673-1675. doi: 10.1038/s43587-024-00777-y. Nat Aging. 2024. PMID: 39578559 No abstract available.
-
Intrathymic Regulation of Dendritic Cell Subsets and Their Contributions to Central Tolerance.Immunol Rev. 2025 Jul;332(1):e70039. doi: 10.1111/imr.70039. Immunol Rev. 2025. PMID: 40433811 Free PMC article. Review.
-
Kitlo hematopoietic stem cells exhibit distinct lymphoid-primed chromatin landscapes that enhance thymic reconstitution.Nat Commun. 2025 Jul 4;16(1):6170. doi: 10.1038/s41467-025-61125-1. Nat Commun. 2025. PMID: 40615375 Free PMC article.
References
-
- Baran‐Gale, J. , Morgan, M. D. , Maio, S. , Dhalla, F. , Calvo‐Asensio, I. , Deadman, M. E. , Handel, A. E. , Maynard, A. , Chen, S. , Green, F. , Sit, R. V. , Neff, N. F. , Darmanis, S. , Tan, W. , May, A. P. , Marioni, J. C. , Ponting, C. P. , & Holländer, G. A. (2020). Ageing compromises mouse thymus function and remodels epithelial cell differentiation. BioRxiv, 9, e56221. 10.1101/2020.03.02.973008 - DOI - PMC - PubMed
-
- Beaudin, A. E. , Boyer, S. W. , Perez‐Cunningham, J. , Hernandez, G. E. , Derderian, S. C. , Jujjavarapu, C. , Aaserude, E. , MacKenzie, T. , & Forsberg, E. C. (2016). A transient developmental hematopoietic stem cell gives rise to innate‐like B and T cells. Cell Stem Cell, 19(6), 768–783. 10.1016/j.stem.2016.08.013 - DOI - PMC - PubMed
-
- Beerman, I. , Bhattacharya, D. , Zandi, S. , Sigvardsson, M. , Weissman, I. L. , Brydere, D. , & Rossia, D. J. (2010). Functionally distinct hematopoietic stem cells modulate hematopoietic lineage potential during aging by a mechanism of clonal expansion. Proceedings of the National Academy of Sciences of the United States of America, 107(12), 5465–5470. 10.1073/pnas.1000834107 - DOI - PMC - PubMed
-
- Buono, M. , Facchini, R. , Matsuoka, S. , Thongjuea, S. , Waithe, D. , Luis, T. C. , Giustacchini, A. , Besmer, P. , Mead, A. J. , Jacobsen, S. E. W. , & Nerlov, C. (2016). A dynamic niche provides kit ligand in a stage‐specific manner to the earliest thymocyte progenitors. Nature Cell Biology, 18(2), 157–167. 10.1038/ncb3299 - DOI - PMC - PubMed
Publication types
MeSH terms
Associated data
- Actions
Grants and funding
LinkOut - more resources
Full Text Sources
Molecular Biology Databases
Miscellaneous
