

Temporal complexity measure of reaction time series: Operational versus event time
- PMID: 37221980
- PMCID: PMC10338792
- DOI: 10.1002/brb3.3069
Temporal complexity measure of reaction time series: Operational versus event time
Abstract
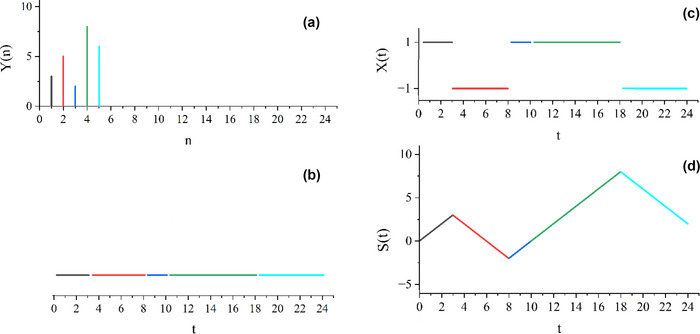
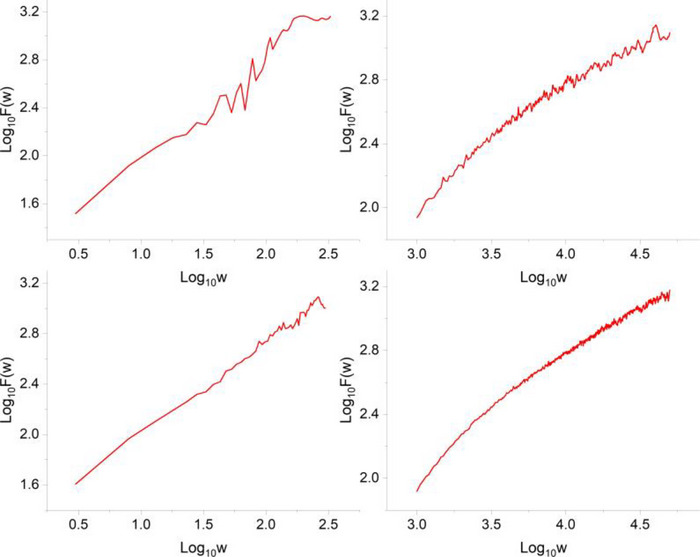
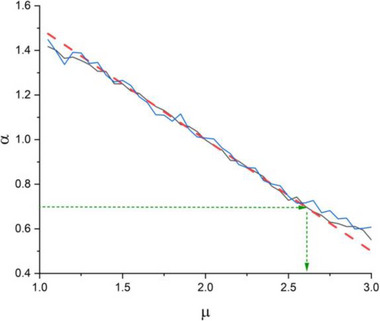
Introduction: Detrended fluctuation analysis (DFA) is a well-established method to evaluate scaling indices of time series, which categorize the dynamics of complex systems. In the literature, DFA has been used to study the fluctuations of reaction time Y(n) time series, where n is the trial number.
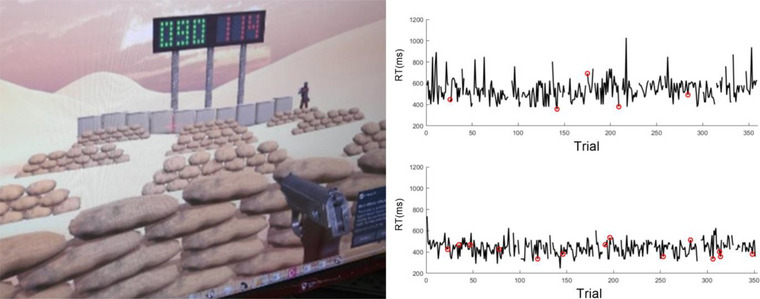
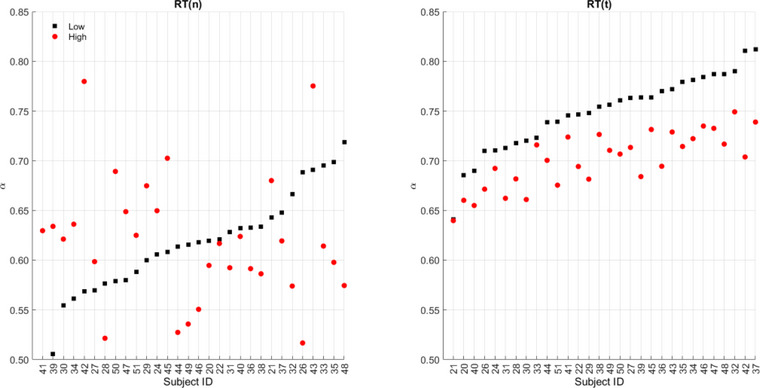
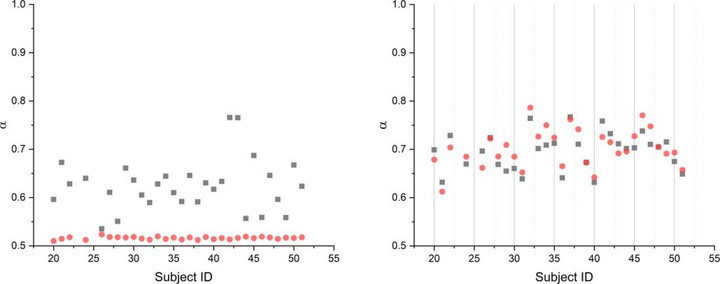
Methods: Herein we propose treating each reaction time as a duration time that changes the representation from operational (trial number) time n to event (temporal) time t, or X(t). The DFA algorithm was then applied to the X(t) time series to evaluate scaling indices. The dataset analyzed is based on a Go-NoGo shooting task that was performed by 30 participants under low and high time-stress conditions in each of six repeated sessions over a 3-week period.
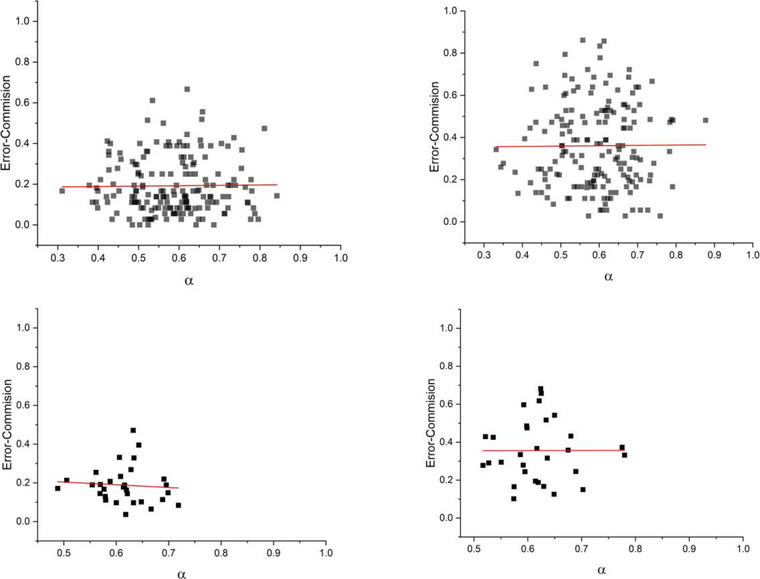
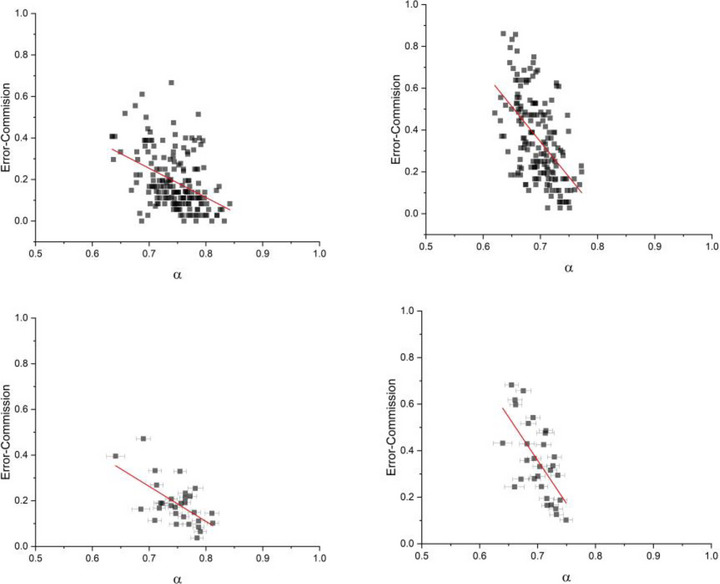
Results: This new perspective leads to quantitatively better results in (1) differentiating scaling indices between low versus high time-stress conditions and (2) predicting task performance outcomes.
Conclusion: We show that by changing from operational time to event time, the DFA allows discrimination of time-stress conditions and predicts performance outcomes.
Keywords: detrended fluctuation analysis; reaction time series; temporal complexity; time-stress.
© 2023 The Authors. Brain and Behavior published by Wiley Periodicals LLC.
Conflict of interest statement
The authors declare no conflict of interests.
Figures
Similar articles
-
DFA as a window into postural dynamics supporting task performance: does choice of step size matter?Front Netw Physiol. 2023 Aug 7;3:1233894. doi: 10.3389/fnetp.2023.1233894. eCollection 2023. Front Netw Physiol. 2023. PMID: 37609060 Free PMC article.
-
Scale-Free Dynamics in Instantaneous Alpha Frequency Fluctuations: Validation, Test-Retest Reliability and Its Relationship with Task Manipulations.Brain Topogr. 2023 Mar;36(2):230-242. doi: 10.1007/s10548-022-00936-7. Epub 2023 Jan 7. Brain Topogr. 2023. PMID: 36611116
-
Detrended Fluctuation Analysis in the prediction of type 2 diabetes mellitus in patients at risk: Model optimization and comparison with other metrics.PLoS One. 2019 Dec 18;14(12):e0225817. doi: 10.1371/journal.pone.0225817. eCollection 2019. PLoS One. 2019. PMID: 31851681 Free PMC article.
-
Using Continuous Glucose Monitoring Data and Detrended Fluctuation Analysis to Determine Patient Condition: A Review.J Diabetes Sci Technol. 2015 Jun 30;9(6):1327-35. doi: 10.1177/1932296815592410. J Diabetes Sci Technol. 2015. PMID: 26134835 Free PMC article. Review.
-
Assessing the Temporal Organization of Walking Variability: A Systematic Review and Consensus Guidelines on Detrended Fluctuation Analysis.Front Physiol. 2020 Jun 23;11:562. doi: 10.3389/fphys.2020.00562. eCollection 2020. Front Physiol. 2020. PMID: 32655400 Free PMC article.
Cited by
-
Multifractal foundations of biomarker discovery for heart disease and stroke.Sci Rep. 2023 Oct 25;13(1):18316. doi: 10.1038/s41598-023-45184-2. Sci Rep. 2023. PMID: 37880302 Free PMC article.
-
Principles Entailed by Complexity, Crucial Events, and Multifractal Dimensionality.Entropy (Basel). 2025 Feb 26;27(3):241. doi: 10.3390/e27030241. Entropy (Basel). 2025. PMID: 40149165 Free PMC article.
-
Complexity synchronization analysis of neurophysiological data: Theory and methods.Front Netw Physiol. 2025 May 14;5:1570530. doi: 10.3389/fnetp.2025.1570530. eCollection 2025. Front Netw Physiol. 2025. PMID: 40438270 Free PMC article.
-
Complexity synchronization in living matter: a mini review.Front Netw Physiol. 2024 May 20;4:1379892. doi: 10.3389/fnetp.2024.1379892. eCollection 2024. Front Netw Physiol. 2024. PMID: 38831910 Free PMC article. Review.
-
How short video addiction affects risk decision-making behavior in college students based on fNIRS technology.Front Hum Neurosci. 2025 Apr 7;19:1542271. doi: 10.3389/fnhum.2025.1542271. eCollection 2025. Front Hum Neurosci. 2025. PMID: 40270566 Free PMC article.
References
-
- Annunziato, M. , & Grigolini, P. (2000). Stochastic versus dynamic approach to Lévy statistics in the presence of an external perturbation. Physics Letters A, 269, 31–39. 10.1016/S0375-9601(00)00206-1 - DOI
-
- Bologna, M. (2020). Distribution with a simple laplace transform and its applications to non‐poissonian stochastic processes. Journal of Statistical Mechanics: Theory and Experiment, 2020, 073201. 10.1088/1742-5468/ab96b1 - DOI
-
- Buiatti, M. , Grigolini, P. , & Palatella, L. (1999). A non‐extensive approach to the entropy of symbolic sequences. Physica A: Statistical Mechanics and its Applications, 268, 214–224. 10.1016/S0378-4371(99)00062-X - DOI
Publication types
MeSH terms
LinkOut - more resources
Full Text Sources
