. 2023 Nov;29(11):3183-3198.
doi: 10.1111/cns.14253. Epub 2023 May 24.

Increasing brain N-acetylneuraminic acid alleviates hydrocephalus-induced neurological deficits

Affiliations

Increasing brain N-acetylneuraminic acid alleviates hydrocephalus-induced neurological deficits

Zhangyang Wang et al. CNS Neurosci Ther. 2023 Nov.

Abstract

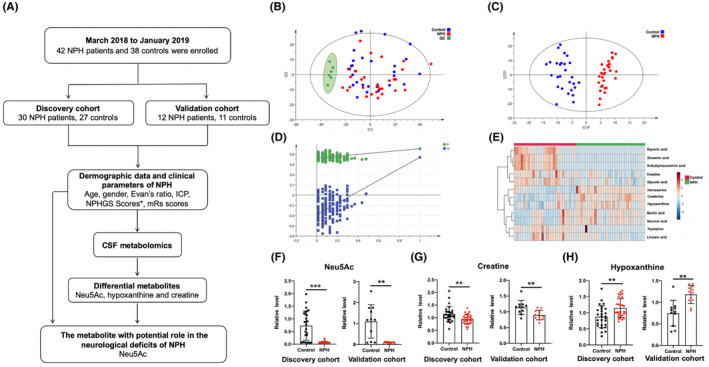
Aims: This metabolomic study aimed to evaluate the role of N-acetylneuraminic acid (Neu5Ac) in the neurological deficits of normal pressure hydrocephalus (NPH) and its potential therapeutic effect.

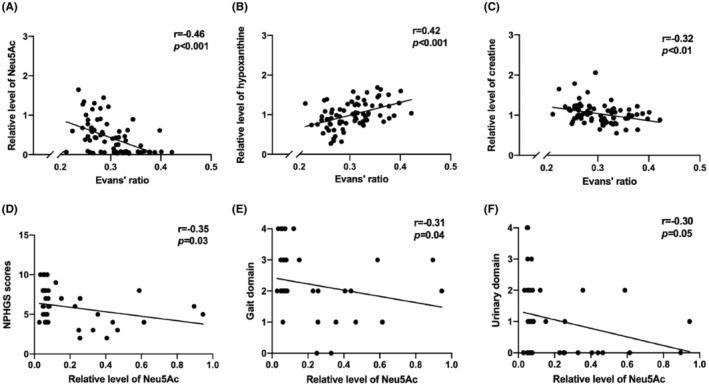
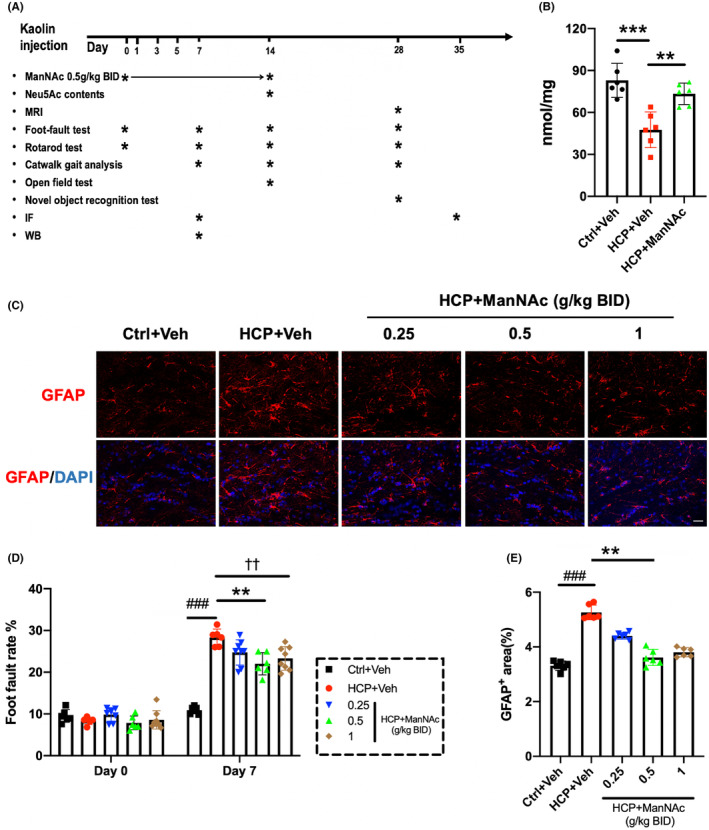
Methods: We analyzed the metabolic profiles of NPH using cerebrospinal fluid with multivariate and univariate statistical analyses in a set of 42 NPH patients and 38 controls. We further correlated the levels of differential metabolites with severity-related clinical parameters, including the normal pressure hydrocephalus grading scale (NPHGS). We then established kaolin-induced hydrocephalus in mice and treated them using N-acetylmannosamine (ManNAc), a precursor of Neu5Ac. We examined brain Neu5Ac, astrocyte polarization, demyelination, and neurobehavioral outcomes to explore its therapeutic effect.

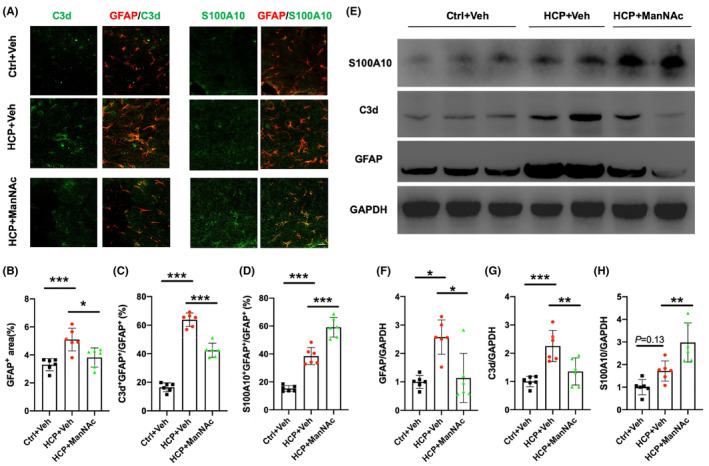
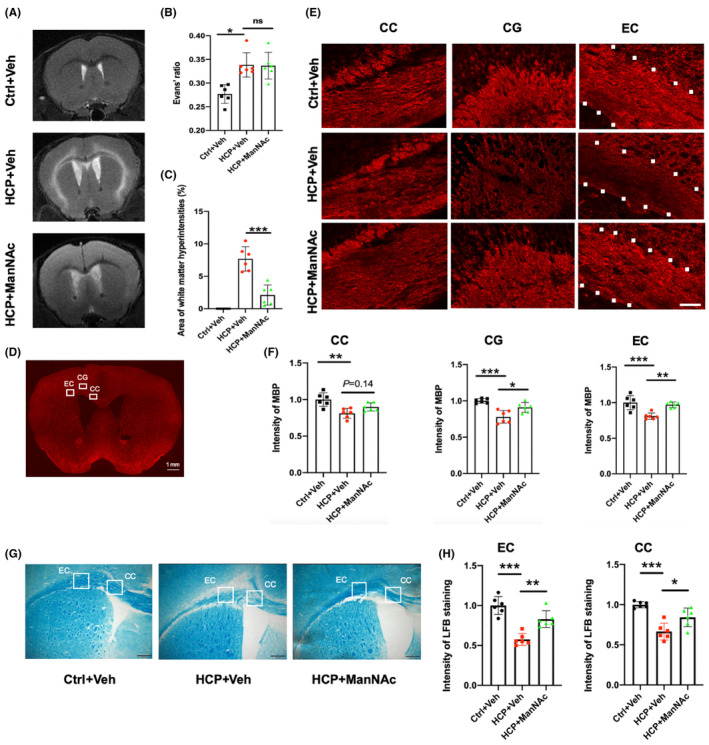
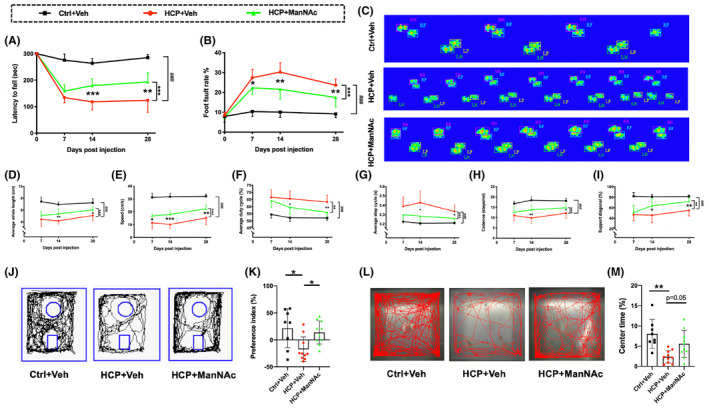
Results: Three metabolites were significantly altered in NPH patients. Only decreased Neu5Ac levels were correlated with NPHGS scores. Decreased brain Neu5Ac levels have been observed in hydrocephalic mice. Increasing brain Neu5Ac by ManNAc suppressed the activation of astrocytes and promoted their transition from A1 to A2 polarization. ManNAc also attenuated the periventricular white matter demyelination and improved neurobehavioral outcomes in hydrocephalic mice.

Conclusion: Increasing brain Neu5Ac improved the neurological outcomes associated with the regulation of astrocyte polarization and the suppression of demyelination in hydrocephalic mice, which may be a potential therapeutic strategy for NPH.

Keywords: N-acetylmannosamine; N-acetylneuraminic acid; hydrocephalus; metabolomics.


Conflict of interest statement

The authors report no competing interests.

Figures

FIGURE 1
FIGURE 1
CSF metabolomic analysis in the NPH and control groups. (A) A flow chart of the metabolomic study. * NPHGS scores include assessment of the gait, cognitive and urinary symptoms. ICP: intracranial pressure; NPHGS: normal pressure hydrocephalus grading scale; mRs: Modified Rankin Scale. Neu5Ac: N‐acetylneuraminic acid. (B) PCA score plot between control (blue, Control), normal pressure hydrocephalus (red, NPH), and quality‐control (green, QC) groups in the discovery cohort. (C) OPLS‐DA score plot between control (blue) and NPH (red) groups in the discovery cohort. (D) Validation plot for OPLS‐DA model obtained from 200 times the permutation test. (E) Heatmap of the 12 differential metabolites in the discovery cohort. Columns represent the samples (control, red; NPH, green). Rows represent 12 differential metabolites. The colors represent the relative levels of metabolites, changing from blue to red to indicate elevating levels. (F–H) Levels of Neu5Ac (F), creatine (G), and hypoxanthine (H) in the discovery and validation cohorts. Data were evaluated using Mann–Whitney test with the FDR adjustment. ***FDR < 0.001; **FDR < 0.01 Control vs. NPH. For B‐E, n = 27 for Control; n = 30 for NPH; n = 6 for QC. For F‐H, n = 27 for Control in the discovery cohort and n = 11 in the validation cohort; n = 30 for NPH in the discovery cohort and n = 12 in the validation cohort. All data were presented as mean ± SD.
FIGURE 2
FIGURE 2
Correlation analysis of the differential metabolites with clinical parameters in NPH patients. (A–C) Correlation of Evans' ratio with relative levels of Neu5Ac (A), creatine (B), and hypoxanthine (C) in the control and NPH groups. For A–B, the Spearman correlation analysis was performed. For C, the Pearson correlation analysis was performed. r: correlation coefficient. (D–F) Correlation of Neu5Ac levels in the NPH group with the total score of NPHGS (D), the NPHGS scores of gait (E), and urinary domain (F). For D–F, the Spearman correlation analysis was performed. For A–C, n = 80. For D‐F, n = 42. All data were presented as mean ± SD.
FIGURE 3
FIGURE 3
The study design, brain Neu5Ac measurement, and dose gradient of the animal study. (A) Illustration of experimental timeline. Kaolin was injected at day 0, and ManNAc was subcutaneously administrated for 14 days. * represents the timepoint of each experimental technique. IF: immunofluorescence; WB: Western blot; BID: twice a day. (B) Brain Neu5Ac levels in different groups. Data were compared using one‐way ANOVA with the post hoc Tukey–Kramer test. n = 6 for Ctrl+Veh, HCP + Veh and HCP + ManNAc, ***p < 0.001; **p < 0.01. (C–E) The effects of various doses of ManNAc on experimental hydrocephalus were assessed by immunostaining of GFAP showing astrogliosis and foot‐fault test showing motor coordination. (C) Representative immunostaining of GFAP (red) with DAPI (Cyan) in the region of periventricular white matter (scale bar =20 μm). (D) The foot fault rates were assessed using the foot‐fault test. Data were compared by one‐way ANOVA with the post hoc Tukey–Kramer test. (E) Percentage of the GFAP+ area in the periventricular white matter. Data were compared using the Kruskal–Wallis with post hoc Dunn test. For C and E, n = 6 for HCP + Veh, Ctrl+Veh, 0.25, 0.5, and 1. For D, n = 6 for HCP + Veh, Ctrl+Veh, and 0.5, n = 8 for 0.25 and 1. For C–E, ###p < 0.001 Ctrl+Veh vs. HCP + Veh; **p < 0.01 HCP + Veh vs. 0.5; †† p < 0.01 HCP + Veh vs. 1. Ctrl+Veh: animal control + saline vehicle; HCP + Veh: hydrocephalic mice + saline vehicle; 0.25: hydrocephalic mice + ManNAc treatment (0.25 g/kg BID); 0.5: hydrocephalic mice + ManNAc treatment (0.5 g/kg BID); 1: hydrocephalic mice + ManNAc treatment (1 g/kg BID). All data were presented as mean ± SD.
FIGURE 4
FIGURE 4
Increasing brain Neu5Ac modulates astrogliosis and astrocyte polarization in hydrocephalic mice. (A) Representative double immunostaining of GFAP (red) with C3d (green) and GFAP (red) with S100A10 (green) in the region of periventricular white matter on day 7 (scale bar =20 μm). (B‐D) Percentage of the GFAP+ area (B), C3d+ GFAP+/ GFAP+ cells (C), and S100A10+ GFAP+/ GFAP+ cells (D) in the periventricular white matter. Data were compared by one‐way ANOVA with the post hoc Tukey–Kramer test. (E) Representative image of a western blot for GFAP, C3d, and S100A10 in the region of periventricular white matter on day 7. GAPDH was used as the loading control. (F–H) Semi‐quantitative analyses of GFAP (F), C3d (G), and S100A10 (H) expression by western blot in the region of periventricular white matter on day 7. For F and H, data were compared by Kruskal–Wallis with the post hoc Dunn test. For G, data were compared by one‐way ANOVA with the post hoc Tukey–Kramer test. For A‐H, n = 6 for Ctrl+Veh: animal control + saline vehicle; HCP + Veh: hydrocephalic mice + saline vehicle; HCP + ManNAc: hydrocephalic mice + ManNAc treatment. ***p < 0.001; **p < 0.01; *p < 0.05. All data were presented as mean ± SD.
FIGURE 5
FIGURE 5
Increasing brain Neu5Ac reduces the white matter damage in hydrocephalic mice. (A) Representative T2‐weighted MRI images in the coronal plane on day 28. (B‐C) Evans' ratio (B) and area of white matter intensities (C) on day 28. For B, data were compared by Kruskal–Wallis with the post hoc Dunn test. For C, data were compared by unpaired t‐test. (D) Illustration of the positions of CC, CG, and EC in an immunofluorescent image of MBP staining (scale bar = 1 mm). (E) Representative immunostaining of MBP in regions of corpus callosum (CC), cingulum bundle (CG), and external capsule (EC) on day 35. The dashed line depicts the border of the EC region (scale bar = 40 μm). (F) Relative quantification of the MBP fluorescence intensity in CC, CG, and EC regions. Data were compared by one‐way ANOVA with the post hoc Tukey–Kramer test. (G) Representative LFB staining in regions of CC and EC on day 35. (H) Relative quantification of the LFB staining intensity in EC and CC region (scale bar = 200 μm). Data were compared by one‐way ANOVA with the post hoc Tukey–Kramer test. For A‐H, n = 6 for Ctrl+Veh: animal control + saline vehicle; HCP + Veh: hydrocephalic mice + saline vehicle; HCP + ManNAc: hydrocephalic mice + ManNAc treatment. ***p < 0.001; **p < 0.01; *p < 0.05. ns, not significant. All data were presented as mean ± SD.
FIGURE 6
FIGURE 6
Increasing brain Neu5Ac alleviates hydrocephalus‐induced neurological deficits. (A) The balance ability was evaluated using the rotarod test. (B) The motor coordination was assessed using the foot‐fault test. Data were compared by repeated‐measures ANOVA and post hoc Tukey multiple comparisons. (C) Representative footprints from animals on day 28. (D‐I) Gait parameters, including average stride length (D), speed (E), average duty cycle (F), average step cycle (G), cadence (H), and support diagonal (I), analyzed using the CatWalk system. Data were compared by repeated‐measures ANOVA and post hoc Tukey multiple comparisons. For A‐I, ***p < 0.001; **p < 0.01; *p < 0.05 for HCP + Veh vs. HCP + ManNAc; ###p < 0.001 for Ctrl+Veh vs. HCP + Veh. (J) Representative traces of animals during the test session of the novel object recognition test starting from day 28. (K) The preference index was calculated from the novel object recognition test. Data were compared by Kruskal–Wallis with the post hoc Dunn test. (L) Representative traces of animals during the open field test on day 14. (M) The time spent in the central zone during the open field test on day 14. Data were compared by one‐way ANOVA with post hoc Tukey–Kramer test; For J‐M, **p < 0.01; *p < 0.05. For A‐M, n = 8 for Ctrl+Veh: animal control + saline vehicle; n = 10 for HCP + Veh: hydrocephalic mice + saline vehicle, HCP + ManNAc: hydrocephalic mice + ManNAc treatment. All data were presented as mean ± SD.

Similar articles

Cited by

References

    1. Nakajima M, Yamada S, Miyajima M, et al. Guidelines for Management of Idiopathic Normal Pressure Hydrocephalus (third edition): endorsed by the Japanese Society of Normal Pressure Hydrocephalus. Neurol Med Chir (Tokyo). 2021;61(2):63‐97. - PMC - PubMed
    1. Das JM, Biagioni MC. Normal pressure hydrocephalus. StatPearls [Internet]. 2021. - PubMed
    1. Martín‐Láez R, Caballero‐Arzapalo H, López‐Menéndez L, Arango‐Lasprilla JC, Vázquez‐Barquero A. Epidemiology of idiopathic Normal pressure hydrocephalus: a systematic review of the literature. World Neurosurg. 2015;84(6):2002‐2009. - PubMed
    1. Andersson J, Rosell M, Kockum K, Lilja‐Lund O, Söderström L, Laurell K. Prevalence of idiopathic normal pressure hydrocephalus: a prospective, population‐based study. PLoS One. 2019;14(5):e0217705. - PMC - PubMed
    1. Lu VM, Kerezoudis P, Patel NP, et al. Our efforts in understanding normal pressure hydrocephalus: learning from the 100 most cited articles by bibliometric analysis. World Neurosurg. 2020;137:429‐434.e13. - PubMed

Publication types

Substances