. 2023 Nov;29(11):3339-3350.
doi: 10.1111/cns.14263. Epub 2023 May 24.

Diffusion tensor imaging-based machine learning for IDH wild-type glioblastoma stratification to reveal the biological underpinning of radiomic features

Affiliations

Diffusion tensor imaging-based machine learning for IDH wild-type glioblastoma stratification to reveal the biological underpinning of radiomic features

Zilong Wang et al. CNS Neurosci Ther. 2023 Nov.

Abstract

Introduction: This study addresses the lack of systematic investigation into the prognostic value of hand-crafted radiomic features derived from diffusion tensor imaging (DTI) in isocitrate dehydrogenase (IDH) wild-type glioblastoma (GBM), as well as the limited understanding of the biological interpretation of individual DTI radiomic features and metrics.

Aims: To develop and validate a DTI-based radiomic model for predicting prognosis in patients with IDH wild-type GBM and reveal the biological underpinning of individual DTI radiomic features and metrics.

Results: The DTI-based radiomic signature was an independent prognostic factor (p < 0.001). Incorporating the radiomic signature into a clinical model resulted in a radiomic-clinical nomogram that predicted survival better than either the radiomic model or clinical model alone, with a better calibration and classification accuracy. Four categories of pathways (synapse, proliferation, DNA damage response, and complex cellular functions) were significantly correlated with the DTI-based radiomic features and DTI metrics.

Conclusion: The prognostic radiomic features derived from DTI are driven by distinct pathways involved in synapse, proliferation, DNA damage response, and complex cellular functions of GBM.

Keywords: biological pathway; diffusion tensor imaging; glioblastoma; machine learning; prognosis.


Conflict of interest statement

All authors declare no financial or nonfinancial competing interests.

Figures
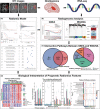
FIGURE 1
FIGURE 1
Workflow of this study. (A) Radiomic model construction and validation. (B) Radiogenomic analysis: the RNA‐seq data were analyzed using both GSEA and WGCNA approaches according to the conclusions of radiomic analysis. (C) Categories of intersective pathways. (D) Annotating individual prognostic radiomic feature.
FIGURE 2
FIGURE 2
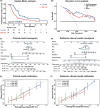
Validation of the radiomic signature. (A) Kaplan–Meier curves for patients stratified by the radiomic signature in the validation set. (B) Decision curve analysis for radiomic‐clinical model nomogram and clinical model nomogram to estimate the OS. The x‐axis represents the threshold probability, and the y‐axis measures the net benefit. (C–F) The clinical model nomogram (C) and the radiomic‐clinical model nomogram (D) for predicting the 1‐, 2‐, and 3‐year OS, along with the calibration curves for assessment of the clinical model nomogram (E) and the radiomic‐clinical model nomogram (F).
FIGURE 3
FIGURE 3
Results of gene set enrichment analysis. (A) Top enriched pathway in Kyoto Encyclopedia of Genes and Genomes (KEGG), Hallmark, Reactome, BioCarta, Pathway Interaction Database (PID), WikiPathways. (B) A heatmap of the gene set variation analysis (GSVA) score of GSEA pathways significantly correlated with the radiomic signature. (C) Bar plot of the top enriched pathways in each gene set. (D) Ridgeline plot of the top enriched pathways in each gene set.
FIGURE 4
FIGURE 4
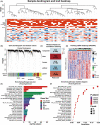
Results of weighted gene co‐expression network analysis. (A) Cluster analysis of patients in the radiogenomic set. (B) The modules obtained from WGCNA. (C) Heatmap of modules correlation with Radscore. (D) Results of pathway enrichment analysis of genes in the Radscore – related modules. (E) Bar plot of the top enriched pathways in each gene set. (F) Bubble diagram of the top enriched pathways in each gene set.
FIGURE 5
FIGURE 5
Radiogenomics linking between 14 radiomic features constituting the radiomic signature and their significantly associated pathways. (A) Venn diagram of the two approaches' pathways. (B) Categories of intersective pathways. (C) Heatmap of intersective pathways. (D) The number of relevant pathway species corresponding to each prognostic radiomic feature. (E) A bubble plot of correlation between prognostic radiomic features and classic biological pathways. (F) Violin Plot of the mean value of FA, MD, AD, and RD in the high‐ and low‐risk groups. (G) The correlation between the four DTI metrics and the significant pathways. Pairwise comparisons of biological pathways are shown, with a color gradient denoting Pearson's correlation coefficient.
FIGURE 6
FIGURE 6
Radiogenomic linking between 14 radiomic features constituting the radiomic signature and their significantly associated pathways. (A) Left panel: Heatmap of 11 radiomics features along with their top significantly associated pathways. The five rows immediately after each radiomic feature indicate the activation level of the top significant pathways. Right panel: Feature maps delineating visual properties of the 11 radiomic features for two patients from the radiogenomic set in high‐ and low‐risk groups, respectively. (B) DTI metrics for the same two patients.

References

    1. Ostrom QT, Gittleman H, Xu J, et al. CBTRUS statistical report: primary brain and other central nervous system tumors diagnosed in the United States in 2009‐2013. Neuro Oncol. 2016;18:v1‐v75. - PMC - PubMed
    1. Parsons DW, Jones S, Zhang X, et al. An integrated genomic analysis of human glioblastoma multiforme. Science. 2008;321(5897):1807‐1812. - PMC - PubMed
    1. Hartmann C, Hentschel B, Simon M, et al. Long‐term survival in primary glioblastoma with versus without isocitrate dehydrogenase mutations. Clin Cancer Res. 2013;19(18):5146‐5157. - PubMed
    1. Louis DN, Perry A, Wesseling P, et al. The 2021 WHO classification of tumors of the central nervous system: a summary. Neuro Oncol. 2021;23(8):1231‐1251. - PMC - PubMed
    1. Ramos‐Fresnedo A, Pullen MW, Perez‐Vega C, et al. The survival outcomes of molecular glioblastoma IDH‐wildtype: a multicenter study. J Neurooncol. 2022;157(1):177‐185. - PubMed

Publication types

Substances