

Distribution and Environmental Drivers of Fungal Denitrifiers in Global Soils
- PMID: 37222601
- PMCID: PMC10269876
- DOI: 10.1128/spectrum.00061-23
Distribution and Environmental Drivers of Fungal Denitrifiers in Global Soils
Abstract
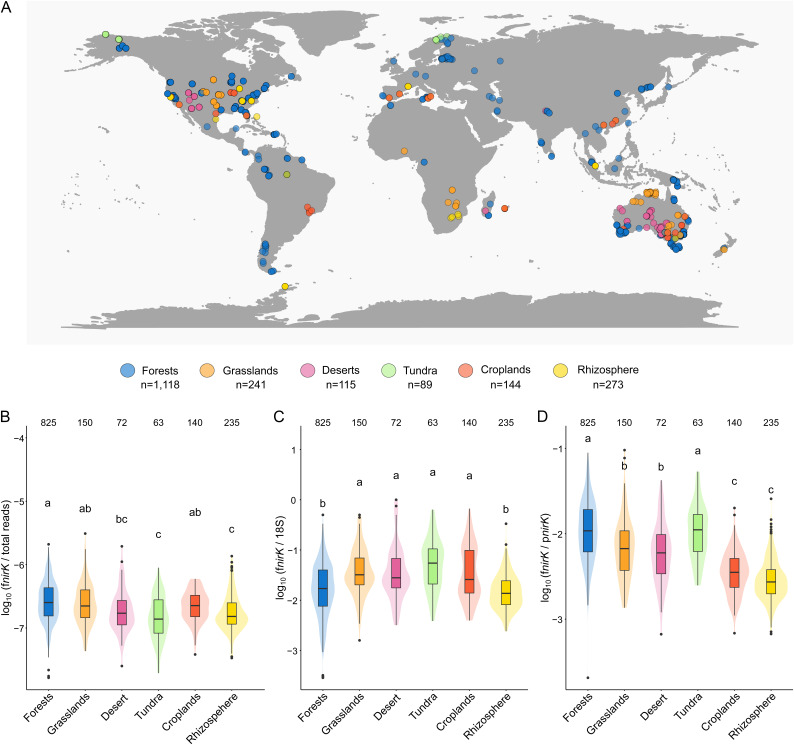
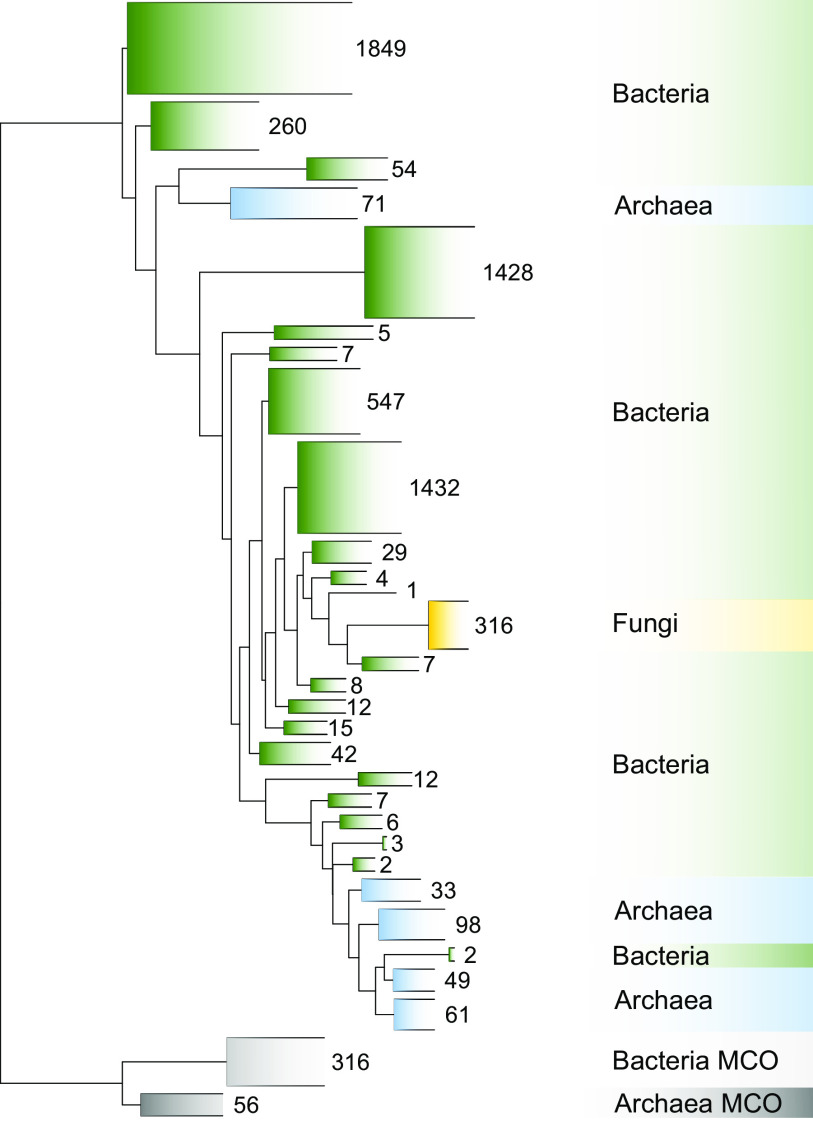
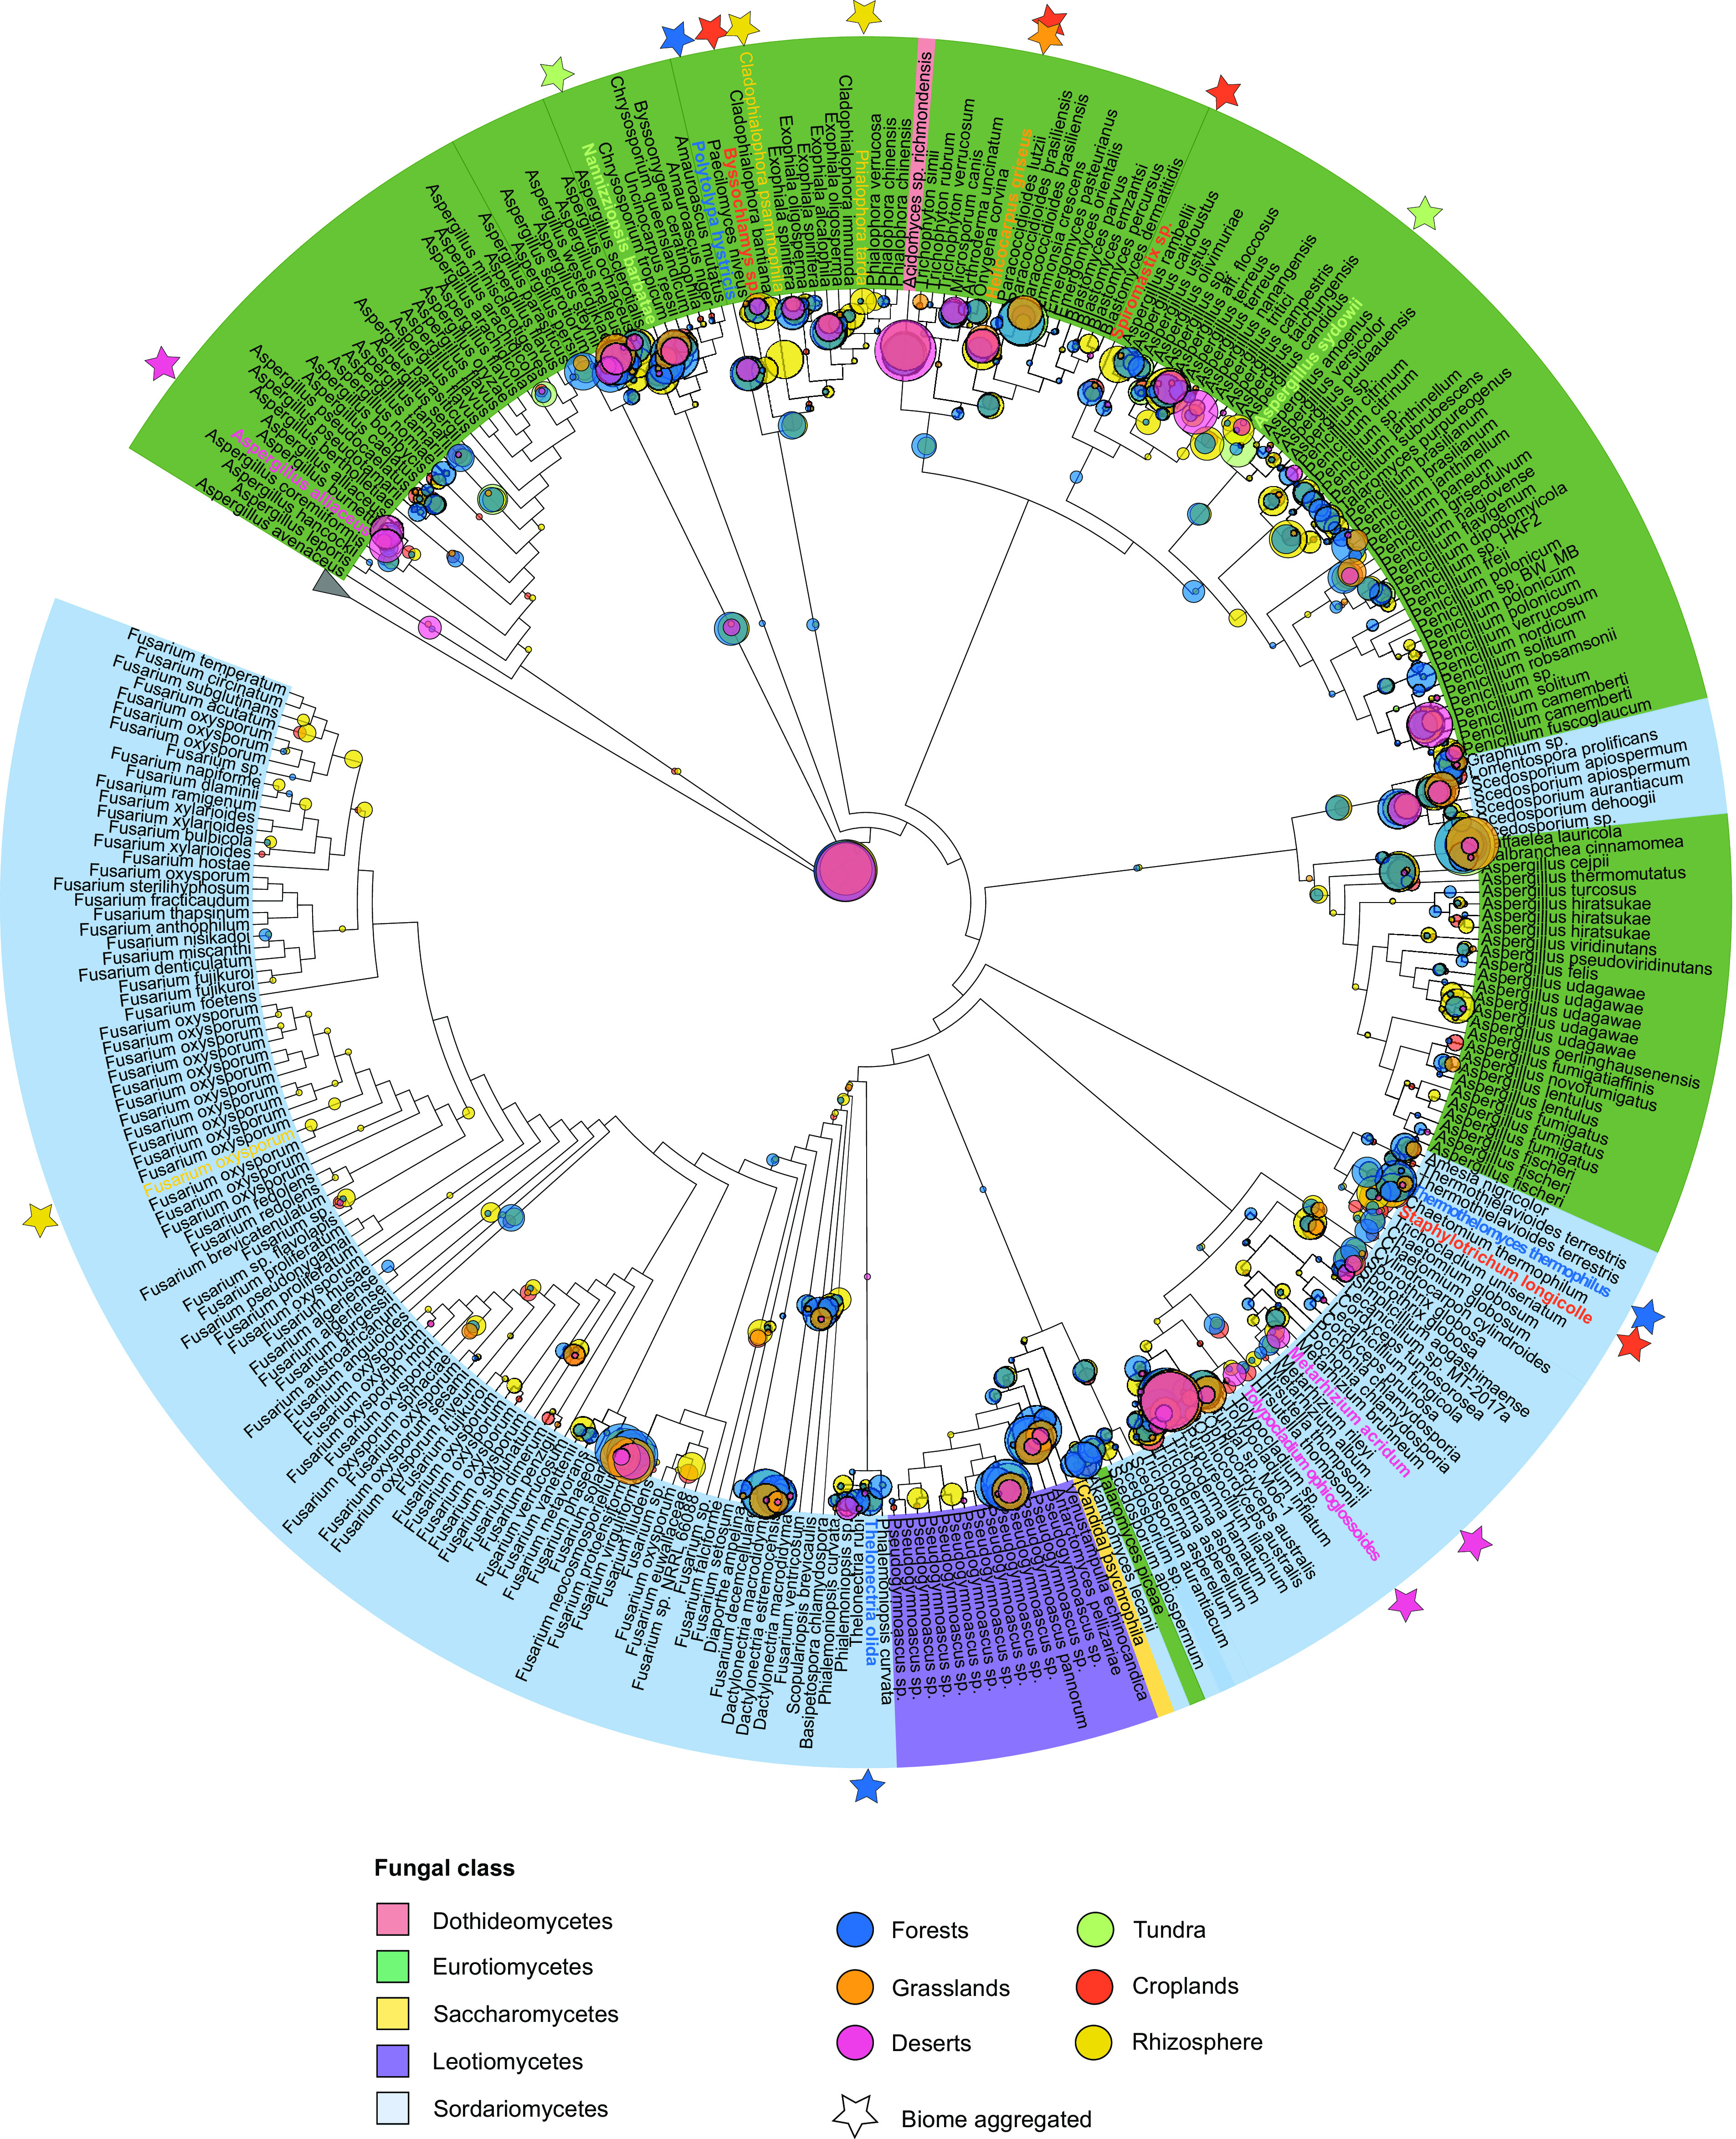
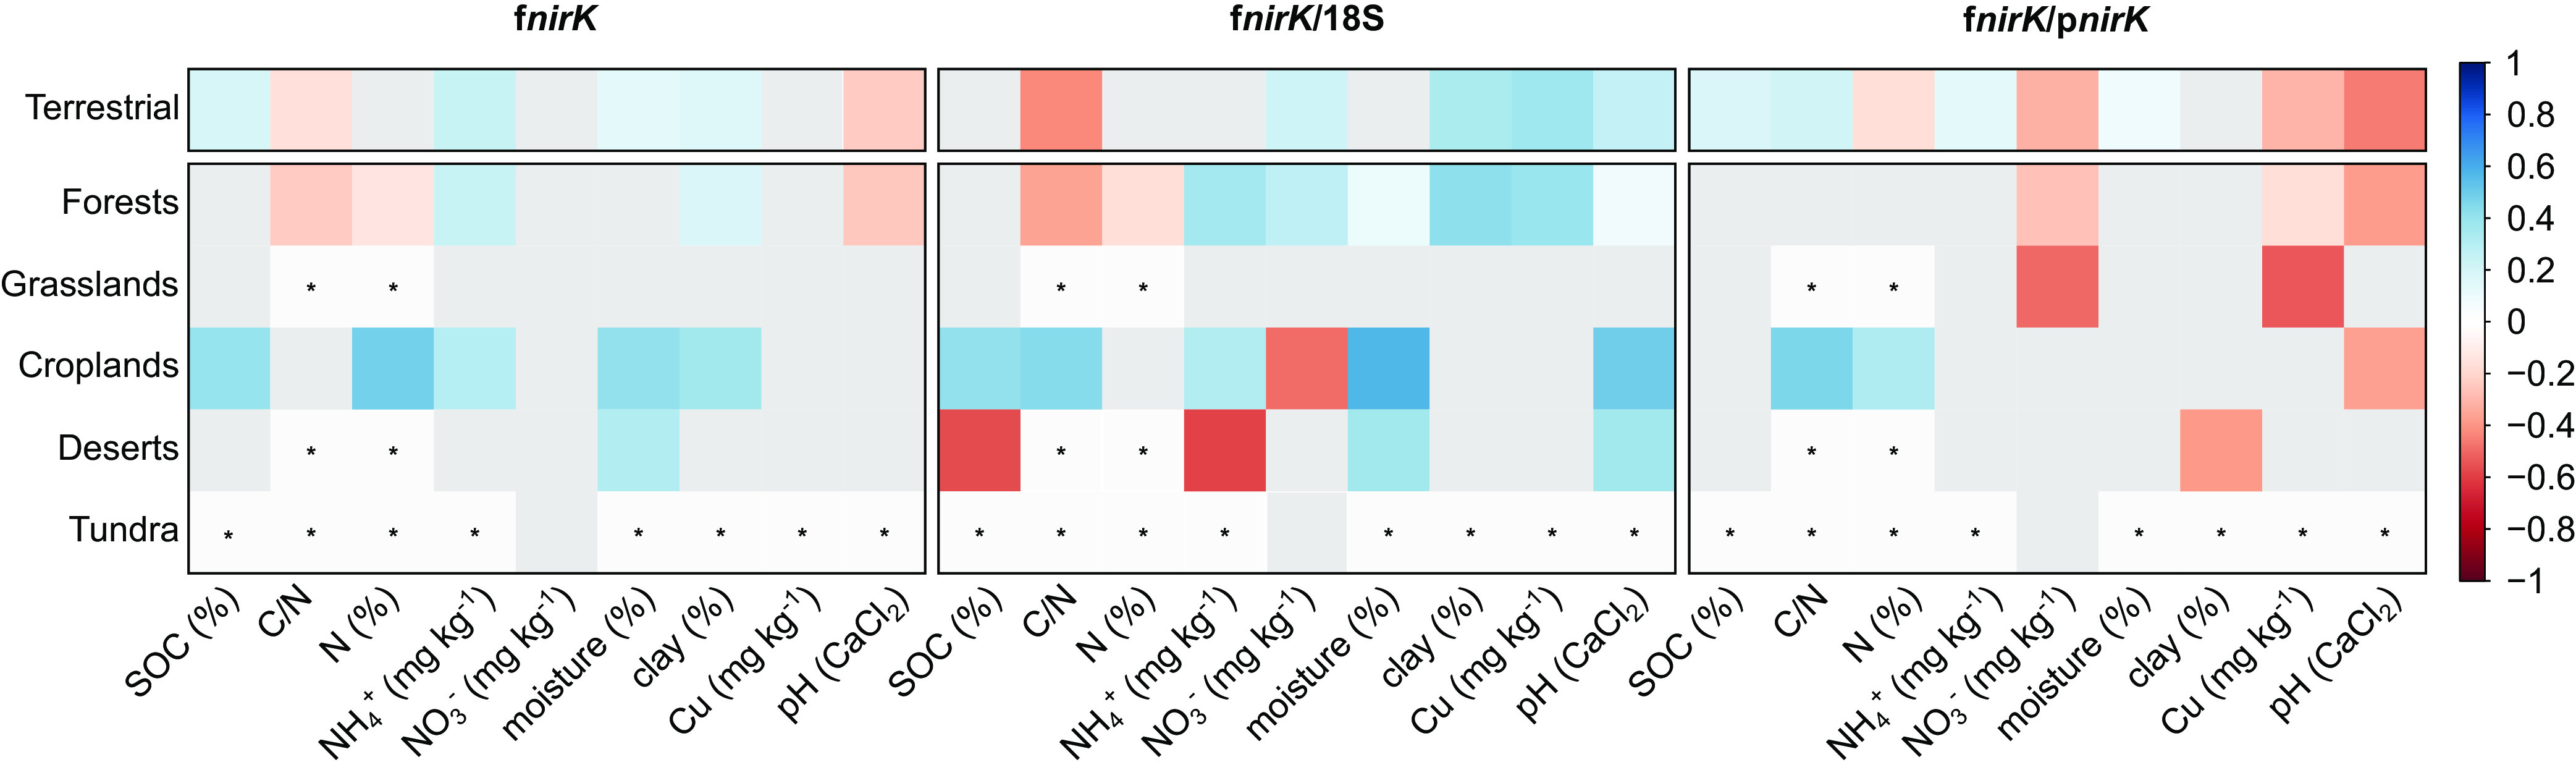
The microbial process of denitrification is the primary source of the greenhouse gas nitrous oxide (N2O) from terrestrial ecosystems. Fungal denitrifiers, unlike many bacteria, lack the N2O reductase, and thereby are sources of N2O. Still, their diversity, global distribution, and environmental determinants, as well as their relative importance, compared to bacterial and archaeal denitrifiers, remain unresolved. Employing a phylogenetically informed approach to analyze 1,980 global soil and rhizosphere metagenomes for the denitrification marker gene nirK, which codes for the copper dependent nitrite reductase in denitrification, we show that fungal denitrifiers are sparse, yet cosmopolitan and that they are dominated by saprotrophs and pathogens. Few showed biome-specific distribution patterns, although members of the Fusarium oxysporum species complex, which are known to produce substantial amounts of N2O, were proportionally more abundant and diverse in the rhizosphere than in other biomes. Fungal denitrifiers were most frequently detected in croplands, but they were most abundant in forest soils when normalized to metagenome size. Nevertheless, the overwhelming dominance of bacterial and archaeal denitrifiers suggests a much lower fungal contribution to N2O emissions than was previously estimated. In relative terms, they could play a role in soils that are characterized by a high carbon to nitrogen ratio and a low pH, especially in the tundra as well as in boreal and temperate coniferous forests. Because global warming predicts the proliferation of fungal pathogens, the prevalence of potential plant pathogens among fungal denitrifiers and the cosmopolitan distribution of these organisms suggest that fungal denitrifier abundance may increase in terrestrial ecosystems. IMPORTANCE Fungal denitrifiers, in contrast to their bacterial counterparts, are a poorly studied functional group within the nitrogen cycle, even though they produce the greenhouse gas N2O. To curb soil N2O emissions, a better understanding of their ecology and distribution in soils from different ecosystems is needed. Here, we probed a massive amount of DNA sequences and corresponding soil data from a large number of samples that represented the major soil environments for a broad understanding of fungal denitrifier diversity at the global scale. We show that fungal denitrifiers are predominantly cosmopolitan saprotrophs and opportunistic pathogens. Fungal denitrifiers constituted, on average, 1% of the total denitrifier community. This suggests that earlier estimations of fungal denitrifier abundance, and, thereby, it is also likely that the contributions of fungal denitrifiers to N2O emissions have been overestimated. Nevertheless, with many fungal denitrifiers being plant pathogens, they could become increasingly relevant, as soilborne pathogenic fungi are predicted to increase with ongoing climate change.
Keywords: biogeography; denitrification; nirK; nitrous oxide; pathogenic fungi; phyloecology; terrestrial fungi.
Conflict of interest statement
The authors declare no conflict of interest.
Figures
References
-
- Tian H, Xu R, Canadell JG, Thompson RL, Winiwarter W, Suntharalingam P, Davidson EA, Ciais P, Jackson RB, Janssens-Maenhout G, Prather MJ, Regnier P, Pan N, Pan S, Peters GP, Shi H, Tubiello FN, Zaehle S, Zhou F, Arneth A, Battaglia G, Berthet S, Bopp L, Bouwman AF, Buitenhuis ET, Chang J, Chipperfield MP, Dangal SRS, Dlugokencky E, Elkins JW, Eyre BD, Fu B, Hall B, Ito A, Joos F, Krummel PB, Landolfi A, Laruelle GG, Lauerwald R, Li W, Lienert S, Maavara T, MacLeod M, Millet DB, Olin S, Patra PK, Prinn RG, Raymond PA, Ruiz DJ, van der Werf GR, et al. 2020. A comprehensive quantification of global nitrous oxide sources and sinks. Nature 586:248–256. doi: 10.1038/s41586-020-2780-0. - DOI - PubMed
-
- Scheer C, Fuchs K, Pelster DE, Butterbach-Bahl K. 2020. Estimating global terrestrial denitrification from measured N2O:(N2O + N2) product ratios. Curr Opin Environ Sustain 47:72–80. doi: 10.1016/j.cosust.2020.07.005. - DOI
-
- Philippot L, Hallin S, Schloter M. 2007. Ecology of denitrifying prokaryotes in agricultural soil. In Advances in Agronomy (ed) Bothe H., Ferguson SJ, Newton WE. 96:249–305, Academic Press.
Publication types
MeSH terms
Substances
LinkOut - more resources
Full Text Sources
