

Diagnostic performance of standardized typical CT findings for COVID-19: a systematic review and meta-analysis
- PMID: 37222857
- PMCID: PMC10206568
- DOI: 10.1186/s13244-023-01429-2
Diagnostic performance of standardized typical CT findings for COVID-19: a systematic review and meta-analysis
Abstract
Objective: To meta-analyze diagnostic performance measures of standardized typical CT findings for COVID-19 and examine these measures by region and national income.
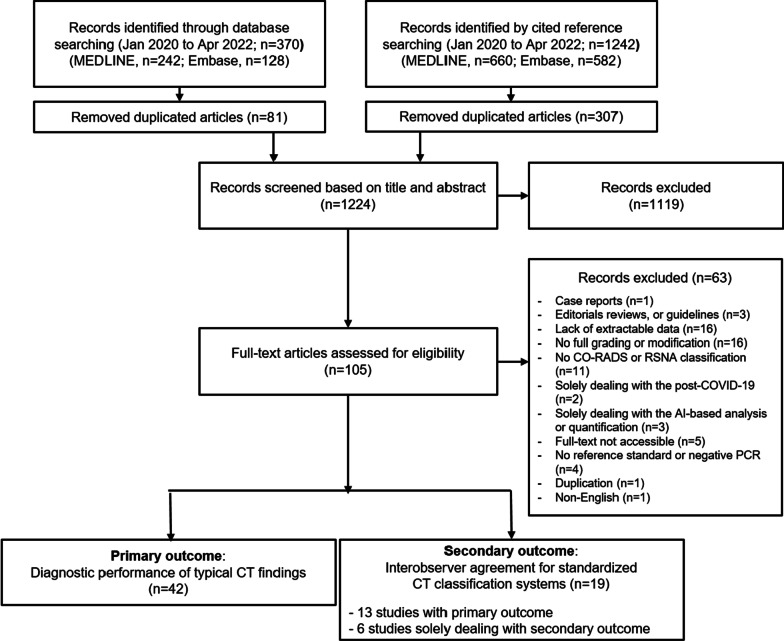
Methods: MEDLINE and Embase were searched from January 2020 to April 2022 for diagnostic studies using the Radiological Society of North America (RSNA) classification or the COVID-19 Reporting and Data System (CO-RADS) for COVID-19. Patient and study characteristics were extracted. We pooled the diagnostic performance of typical CT findings in the RSNA and CO-RADS systems and interobserver agreement. Meta-regression was performed to examine the effect of potential explanatory factors on the diagnostic performance of the typical CT findings.
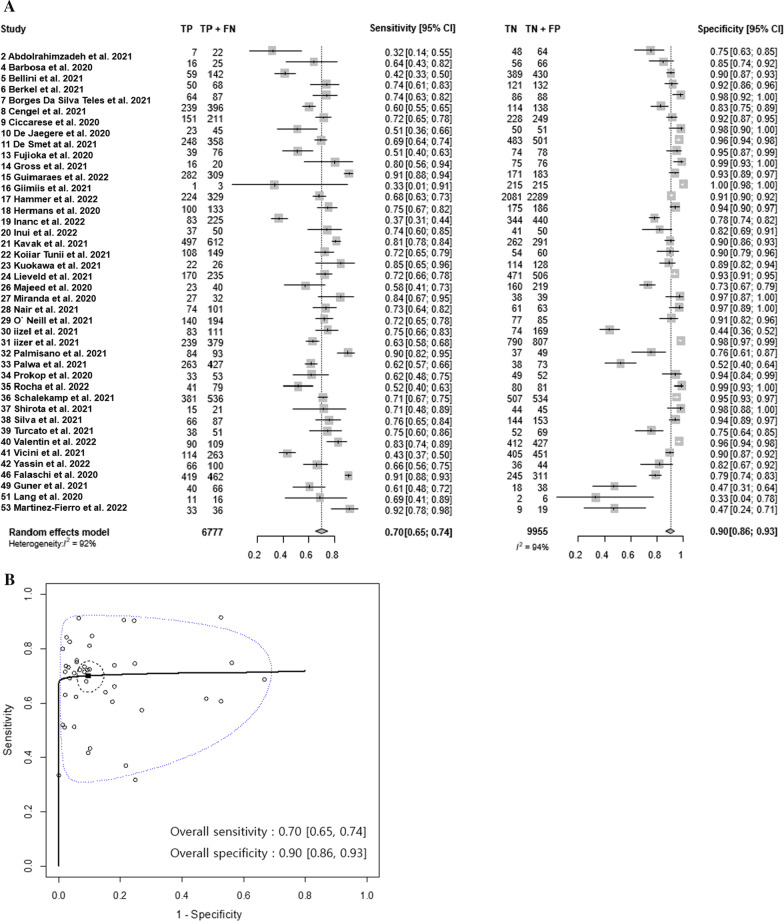
Results: We included 42 diagnostic performance studies with 6777 PCR-positive and 9955 PCR-negative patients from 18 developing and 24 developed countries covering the Americas, Europe, Asia, and Africa. The pooled sensitivity was 70% (95% confidence interval [CI]: 65%, 74%; I2 = 92%), and the pooled specificity was 90% (95% CI 86%, 93%; I2 = 94%) for the typical CT findings of COVID-19. The sensitivity and specificity of the typical CT findings did not differ significantly by national income and the region of the study (p > 0.1, respectively). The pooled interobserver agreement from 19 studies was 0.72 (95% CI 0.63, 0.81; I2 = 99%) for the typical CT findings and 0.67 (95% CI 0.61, 0.74; I2 = 99%) for the overall CT classifications.
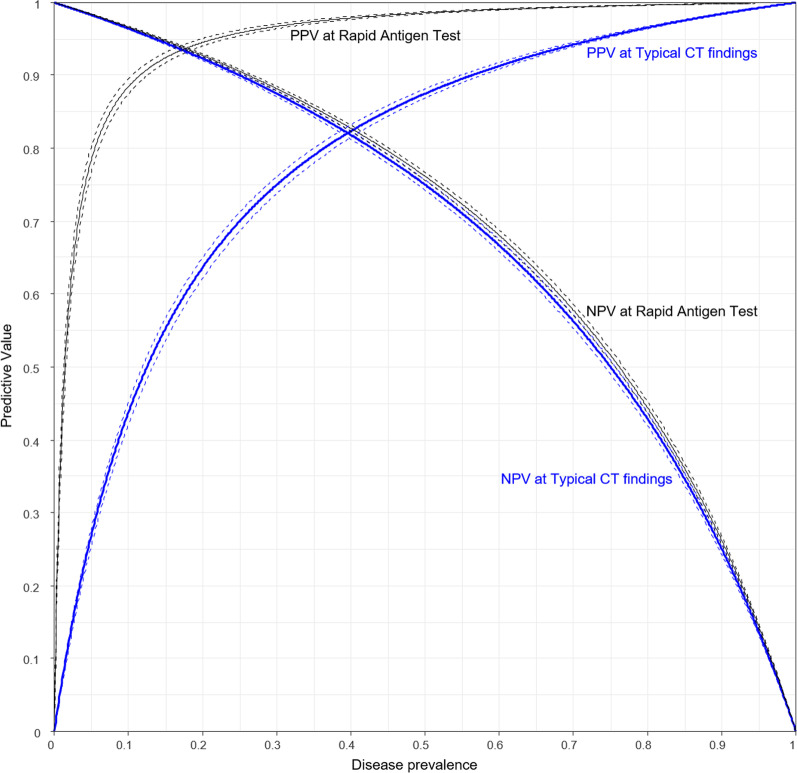
Conclusion: The standardized typical CT findings for COVID-19 provided moderate sensitivity and high specificity globally, regardless of region and national income, and were highly reproducible between radiologists.
Critical relevance statement: Standardized typical CT findings for COVID-19 provided a reproducible high diagnostic accuracy globally.
Key points: Standardized typical CT findings for COVID-19 provide high sensitivity and specificity. Typical CT findings show high diagnosability regardless of region or income. The interobserver agreement for typical findings of COVID-19 is substantial.
Keywords: COVID-19; Lung; Meta-analysis; Pneumonia (viral); Tomography (X-Ray Computed).
© 2023. The Author(s).
Conflict of interest statement
The authors declare that they have no competing interests related to the present study. Not related to the present article: SHY is the chief medical officer for Medical IP and holds a stock option in the firm.
Figures
Similar articles
-
Radiological Society of North America (RSNA) Expert Consensus Statement Related to Chest CT Findings in COVID-19 Versus CO-RADS: Comparison of Reporting System Performance Among Chest Radiologists and End-User Preference.Can Assoc Radiol J. 2021 Nov;72(4):806-813. doi: 10.1177/0846537120968919. Epub 2020 Nov 3. Can Assoc Radiol J. 2021. PMID: 33138634
-
Diagnostic Performance of CO-RADS and the RSNA Classification System in Evaluating COVID-19 at Chest CT: A Meta-Analysis.Radiol Cardiothorac Imaging. 2021 Jan 14;3(1):e200510. doi: 10.1148/ryct.2021200510. eCollection 2021 Feb. Radiol Cardiothorac Imaging. 2021. PMID: 33778660 Free PMC article.
-
Standardized reporting systems of chest computed tomography in a population with low coronavirus disease 2019 prevalence: A retrospective comparative study.Heliyon. 2021 Aug;7(8):e07743. doi: 10.1016/j.heliyon.2021.e07743. Epub 2021 Aug 10. Heliyon. 2021. PMID: 34395930 Free PMC article.
-
Thoracic imaging tests for the diagnosis of COVID-19.Cochrane Database Syst Rev. 2020 Nov 26;11:CD013639. doi: 10.1002/14651858.CD013639.pub3. Cochrane Database Syst Rev. 2020. Update in: Cochrane Database Syst Rev. 2021 Mar 16;3:CD013639. doi: 10.1002/14651858.CD013639.pub4. PMID: 33242342 Updated.
-
Thoracic imaging tests for the diagnosis of COVID-19.Cochrane Database Syst Rev. 2020 Sep 30;9:CD013639. doi: 10.1002/14651858.CD013639.pub2. Cochrane Database Syst Rev. 2020. Update in: Cochrane Database Syst Rev. 2020 Nov 26;11:CD013639. doi: 10.1002/14651858.CD013639.pub3. PMID: 32997361 Updated.
Cited by
-
Evaluating the Accuracy of Chest CT in Detecting COVID-19 Through Tracheobronchial Wall Thickness: Insights From Emergency Department Patients in Mid-2023.Cureus. 2024 Sep 11;16(9):e69161. doi: 10.7759/cureus.69161. eCollection 2024 Sep. Cureus. 2024. PMID: 39398816 Free PMC article.
References
LinkOut - more resources
Full Text Sources
Miscellaneous
