

Beneath the surface: spatial and temporal trends in water quality and its impacts on algal community composition in the Albemarle Sound, North Carolina
- PMID: 37223620
- PMCID: PMC10016187
- DOI: 10.1007/s10452-023-10008-y
Beneath the surface: spatial and temporal trends in water quality and its impacts on algal community composition in the Albemarle Sound, North Carolina
Abstract
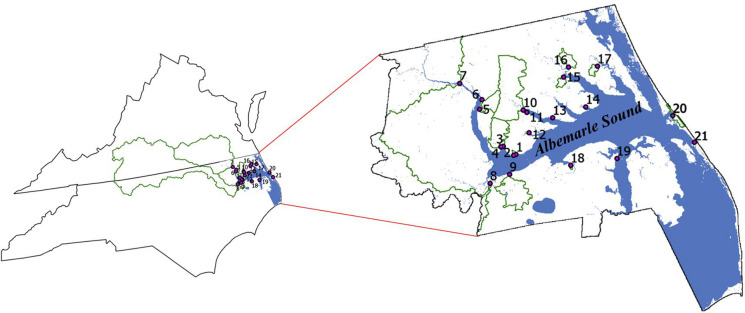
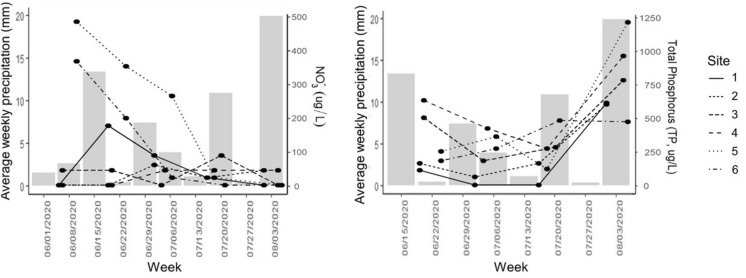
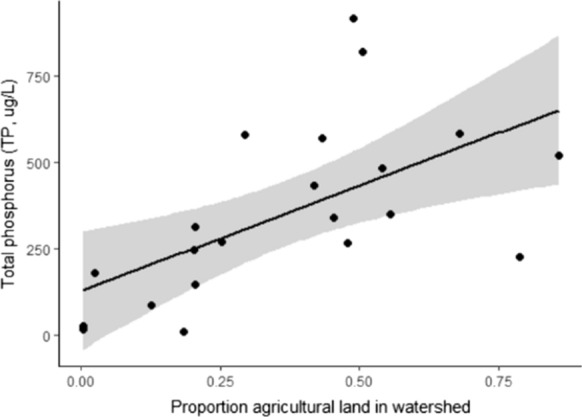
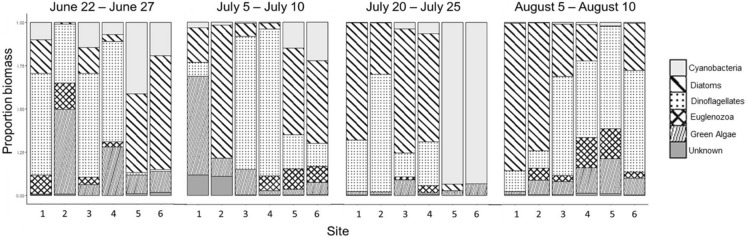
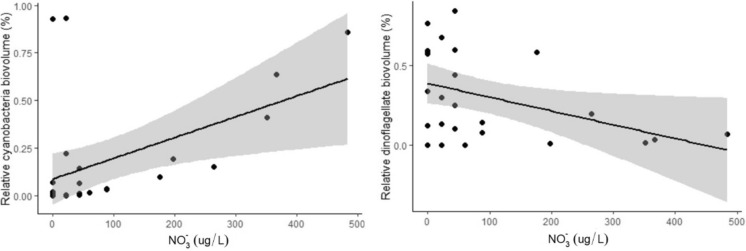
Urban and agricultural expansion and intensification pose a critical threat to water quality and aquatic ecosystems. Increased nutrient loading into waterways combined with warming temperatures due to climate change have increased eutrophication and algal blooms. The relationship between land use, nutrient availability, and algal growth can vary dramatically across space and time, but few studies have captured this variation. The goal of this research is to assess water quality across time and disparate land uses, and its influence on algal community composition in the Albemarle Sound, a brackish water estuary in North Carolina. We collected water quality data from 21 sites across the sound, visiting six sites in Chowan County biweekly and 15 other sites twice between June and August 2020. Water samples from each site were tested for nitrate, phosphate, ammonia, bicarbonate, and total phosphorus (TP). Preserved algal samples from the six Chowan County sites were enumerated under a microscope to estimate genus richness and biomass. In the Chowan County sites, phosphorus increased and nitrate decreased over the course of the summer. Across all sites, TP increased with development and agricultural land use. These results suggest that sources of nitrogen and phosphorus in the sound differ. Algal richness increased with nitrate concentration and decreased with precipitation while biomass increased with water temperature. Our results indicate that climate change impacts, particularly increasing temperatures and extreme precipitation, influence how land use, water quality, and algal community composition interact. These data demonstrate the co-benefits of mitigating climate change in developing management strategies to reduce algal blooms.
Supplementary information: The online version contains supplementary material available at 10.1007/s10452-023-10008-y.
Keywords: Algae; Community composition; Land use; Nutrient concentration; Water quality.
© The Author(s), under exclusive licence to Springer Nature B.V. 2023, Springer Nature or its licensor (e.g. a society or other partner) holds exclusive rights to this article under a publishing agreement with the author(s) or other rightsholder(s); author self-archiving of the accepted manuscript version of this article is solely governed by the terms of such publishing agreement and applicable law.
Figures


References
-
- Altman JC, Paerl HW. Composition of inorganic and organic nutrient sources influences phytoplankton community structure in the New River Estuary. North Carolina Aquat Ecol. 2012;46(3):269–282. doi: 10.1007/s10452-012-9398-8. - DOI
-
- ANSP_2001_Diatom Biovolume. (2001). The Academy of Natural Sciences of Drexel University.
-
- APNEP. (n.d.-a). Our Estuary. Albemarle-Pamlico National Estuary Partnership. Retrieved September 25, 2020, from https://apnep.nc.gov/our-estuary
-
- APNEP. (n.d.-b). A to Z in the Albemarle-Pamlico Estuary. Albemarle-Pamlico National Estuary Partnership. Retrieved September 25, 2020, from https://apnep.nc.gov/our-estuary/z-albemarle-pamlico-estuary
LinkOut - more resources
Full Text Sources