. 2022:10:119106-119118.
doi: 10.1109/access.2022.3221436. Epub 2022 Nov 10.

Integrating Statistical and Machine Learning Approaches for Neural Classification

Affiliations

Integrating Statistical and Machine Learning Approaches for Neural Classification

Mehrad Sarmashghi et al. IEEE Access. 2022.

Abstract

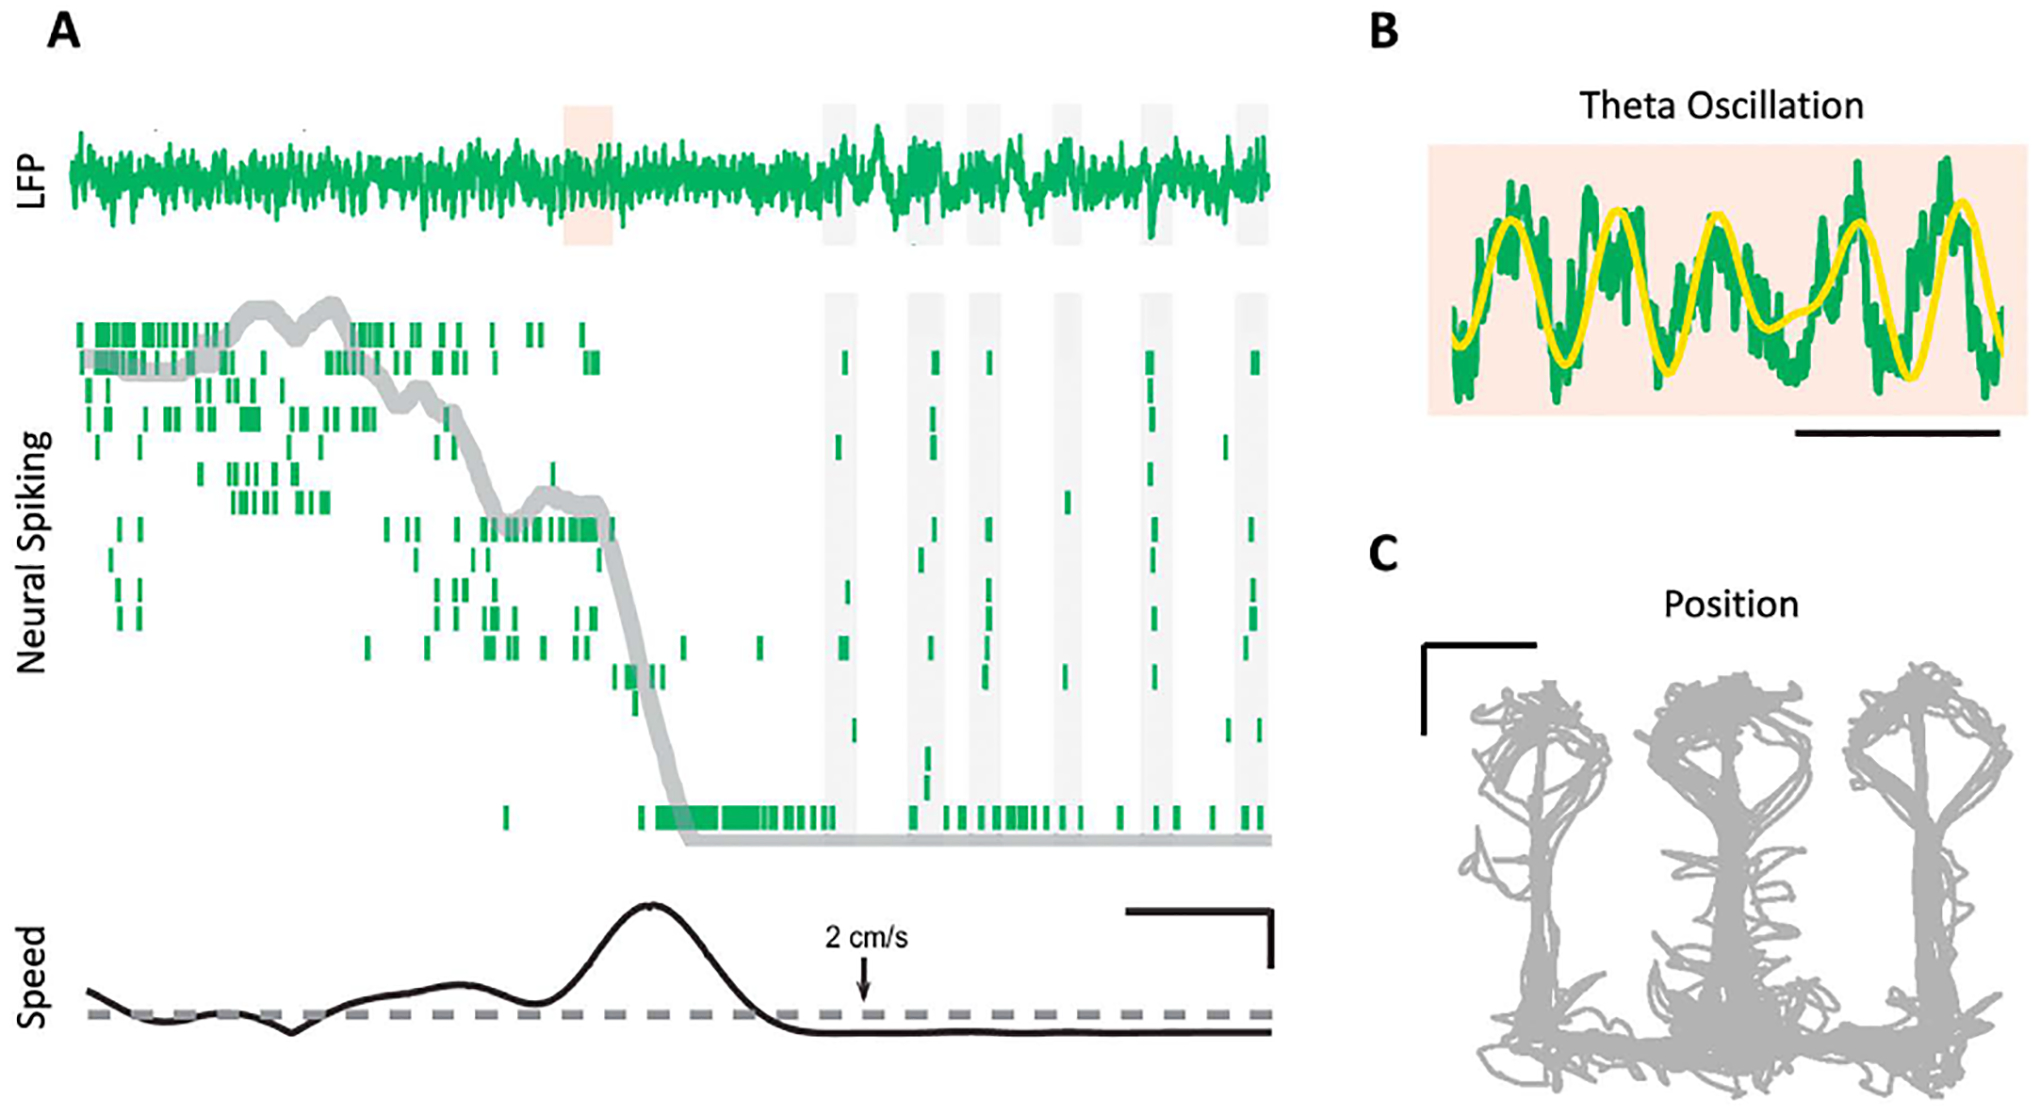
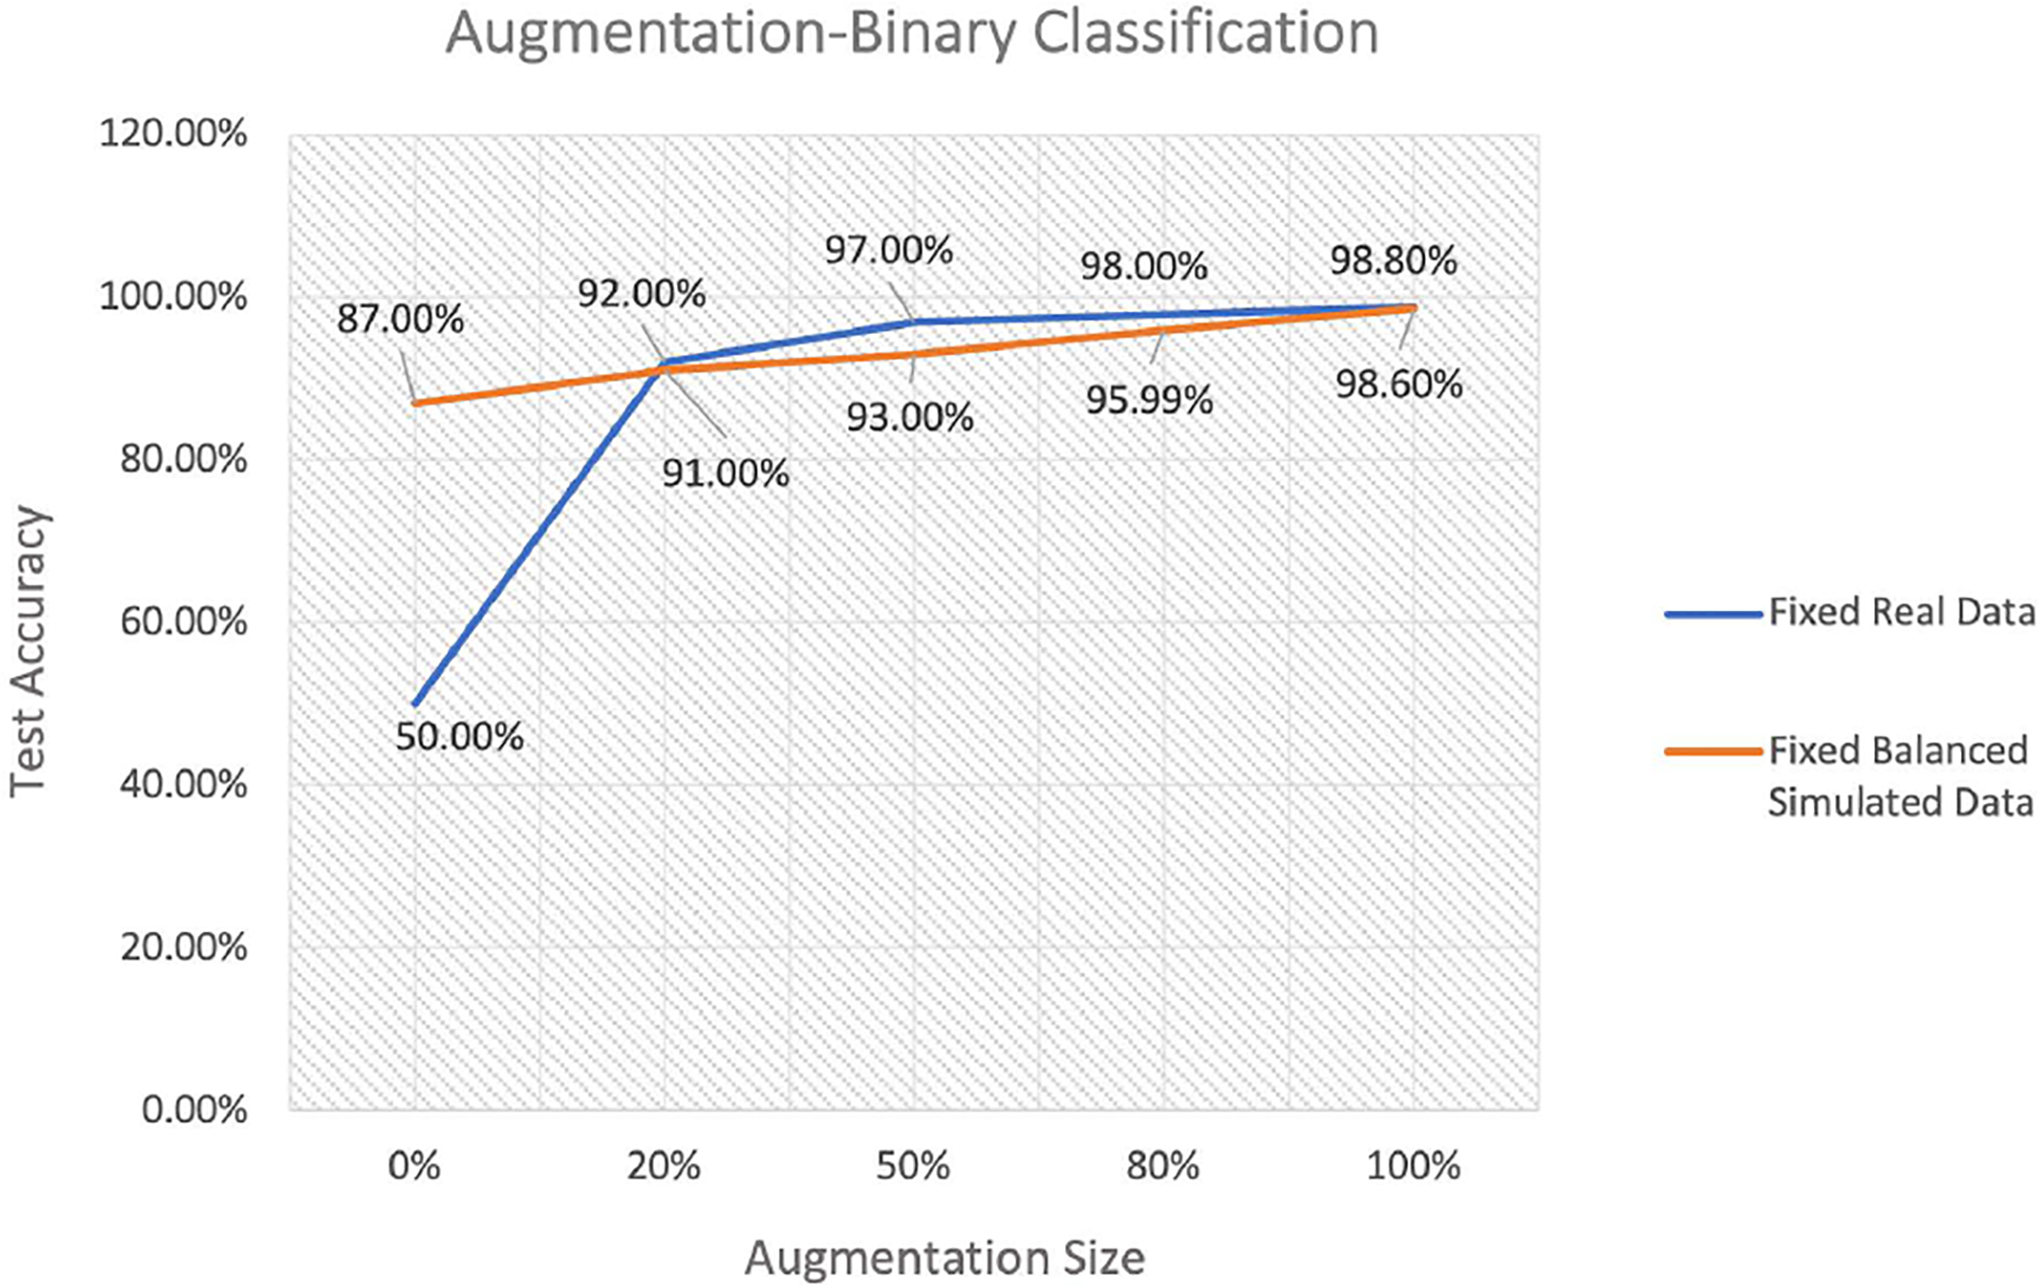
Neurons can code for multiple variables simultaneously and neuroscientists are often interested in classifying neurons based on their receptive field properties. Statistical models provide powerful tools for determining the factors influencing neural spiking activity and classifying individual neurons. However, as neural recording technologies have advanced to produce simultaneous spiking data from massive populations, classical statistical methods often lack the computational efficiency required to handle such data. Machine learning (ML) approaches are known for enabling efficient large scale data analyses; however, they typically require massive training sets with balanced data, along with accurate labels to fit well. Additionally, model assessment and interpretation are often more challenging for ML than for classical statistical methods. To address these challenges, we develop an integrated framework, combining statistical modeling and machine learning approaches to identify the coding properties of neurons from large populations. In order to demonstrate this framework, we apply these methods to data from a population of neurons recorded from rat hippocampus to characterize the distribution of spatial receptive fields in this region.

Keywords: Deep learning; large-scale neural data; machine learning; neural coding; receptive field; statistical models.


Figures

FIGURE 1.
FIGURE 1.
General deep learning framework for multivariate time series classification.
FIGURE 2.
FIGURE 2.
Multi channel deep convolutional neural network (MCDCNN) architecture.
FIGURE 3.
FIGURE 3.. Hippocampal neural activity patterns during behavior.
(A) From top to bottom, LFP (1–400 Hz) activity in CA1 and spiking activity of 18 CA1 neurons represented in a raster plot in green. The gray line indicates the linearized position of the animal. The bottom plot shows the rat’s speed vs a threshold speed of 2 cm/s, used to differentiate the running state from rest. The scale bars are 2s (horizontal) and 10 cm/s (vertical). (B) Magnification of the shaded area from A where the yellow line is filtered LFP in the theta rhythm bandwidth (6–12 Hz). The scale bar is 250 ms. (C) The animal’s movement trajectory in a W-track maze. The scale bar is 20 cm. (Jadhav et al.).
FIGURE 4.
FIGURE 4.. Coding properties of an individual neuron in CA1.
(A) Locations of rat at spike times are shown as black dots within the rat’s movement trajectory in gray. (B) Occupancy-normalized histogram of the neuron’s firing in a linearized version of the track. Each color represents a different arm of the W-track. (C) Position and speed of the rat during movement (gray) and at spike times (black). (D) Position and theta phase during spike times during inbound (blue) and outbound (red) trajectories.
FIGURE 5.
FIGURE 5.. Population summary of coding properties in CA1 population.
Relative frequency of p-values for maximum likelihood ratio tests for each potential predictor of spiking, including position, speed, direction and theta phase.
FIGURE 6.
FIGURE 6.. Performance of different neural network architectures on classifying simulated data.
Performance of four neural networks including MLP, LSTM, CNN, and MCDCNN for (A) binary classification of place field vs non-place specific firing where 100% data size means 204 neurons, and (B) categorical classification with 4 classes including place, speed, and direction specific firing. 100% data size means 816 neurons.
FIGURE 7.
FIGURE 7.. Test accuracy of binary classification for two training scenarios.
Scenario (1): fixed amount of real data that includes only place specific neurons (class 1) augmented by adding balanced data of size 20%, 50%, 80% and 100% of the original data size, 204 neurons, (blue line). Case (2): fixed amount of balanced simulated data augmented by adding subsets of the real dataset of different sizes (orange line).
FIGURE 8.
FIGURE 8.. Test accuracy of categorical classification for two training cases and a fixed test set.
Case (1): real data that includes only place and speed specific neurons (class 2) and different proportion of balanced simulated data (class 0 and 1). Case (2): real data (class 2), balanced simulated data (class 0 and 1) augmented by the different proportion of empirical simulated data (class 2) while keeping balance. In both training cases, 100% augmentation size means 4584 neurons.

Similar articles

References

    1. Paninski L, Pillow J, and Lewi J, “Statistical models for neural encoding, decoding, and optimal stimulus design,” Prog. Brain Res, vol. 165, pp. 493–507, Jan. 2007. - PubMed
    1. Dayan P and Abbott L, “Theoretical neuroscience: Computational and mathematical modeling of neural systems,” J. Cognit. Neurosci, vol. 15, no. 1, pp. 154–155, 2003.
    1. Johnson KO, “Neural coding,” Neuron, vol. 26, no. 3, pp. 563–566, 2000. - PubMed
    1. Rieke F, Spikes: Exploring the Neural Code, vol. 7. Cambridge, MA, USA: MIT Press, 1999.
    1. Barbieri R, Frank LM, Nguyen DP, Quirk MC, Solo V, Wilson MA, and Brown EN, “Dynamic analyses of information encoding in neural ensembles,” Neural Comput, vol. 16, no. 2, pp. 277–307, 2004. - PubMed

LinkOut - more resources