. 2023 Mar 23:4:uqad010.
doi: 10.1093/femsml/uqad010. eCollection 2023.

Phylogenetic diversity of core rumen microbiota as described by cryo-ET

Affiliations

Phylogenetic diversity of core rumen microbiota as described by cryo-ET

Benedikt H Wimmer et al. Microlife. .

Abstract

Microbial taxonomy is critical for describing ecosystem composition, yet the link between taxonomy and properties of microbes, such as their cellular architecture, remains poorly defined. We hypothesized that the cellular architecture represents microbial niche adaptation. We used cryo-electron microscopy and tomography to analyze microbial morphology in order to associate cellular architecture with phylogeny and genomic contents. As a model system, we chose the core rumen microbiome and imaged a large isolate collection covering 90% of its richness at the order level. Based on quantifications of several morphological features, we found that the visual similarity of microbiota is significantly related to their phylogenetic distance. Up to the Family level, closely related microbes have similar cellular architectures, which are highly correlated with genome similarity. However, in more distantly related bacteria, the correlation both with taxonomy and genome similarity is lost. This is the first comprehensive study of microbial cellular architecture and our results highlight that structure remains an important parameter in classification of microorganisms, along with functional parameters such as metabolomics. Furthermore, the high-quality images presented in this study represent a reference database for the identification of bacteria in anaerobic ecosystems.

Keywords: anaerobic microorganisms; cellular architecture; cryo-electron microscopy; cryo-electron tomography; gut microbiome; rumen microbiome; taxonomy.


Conflict of interest statement

None declared.

Figures

Figure 1.
Figure 1.
Visualizing the cellular architecture of core rumen microbiome members. To study the link between taxonomy and cellular architecture, the rumen core microbiome was selected as a model (phylogenetic tree, colored by order). A selection of 69 isolates (colored branches) was subjected to cryo-electron microscopy and subsequent analysis of cellular architecture. This analysis yields insights into the structural composition of the rumen ecosystem. The phylogenetic tree is based on the 16S rRNA gene of core microorganisms present in 80% of the individuals at the order level in a cohort of 1000 cows. Bootstraps with a confidence higher than 95% are displayed as pink circles. Phylogenetic tree generated using iTOL.
Figure 2.
Figure 2.
Bacteria of the core microbiome span a plethora of morphologies. Selection of representative micrographs of microbiome members. (A)Selenomonas ruminantium AB3002, a diderm rod-shaped bacterium isolated from the bovine rumen. (B)Succinimonas amylolytica DSM 2873, a diderm coccoid bacterium isolated from the bovine rumen. (C)Prevotella ruminicola ATCC 19189, a diderm ovoid bacterium isolated from the bovine rumen. Here, an S-layer is visible in the micrographs (insert, arrow). (D)A. ruminis DSM 29029, a monoderm vibrioid bacterium isolated from sheep rumen. Flagella are visible in the micrographs (insert, arrows). (E) High-exposure micrograph of Akkermansia muciniphila DSM 22959, an important player in the human intestinal microbiome linked to metabolic benefits in the early developing cow rumen (Furman et al. , Ouyang et al. 2020). To compare shapes, the outline was manually traced (dotted line) and the circularity of the shape calculated in FIJI. Furthermore, the diameter was measured (yellow line). Panels (A)–(D) at the same magnification.
Figure 3.
Figure 3.
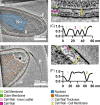
Cryo-ET elucidates the cellular architecture. Central cross-sections through tomograms of bacteria reveal the cellular architecture. (A)Pseudobutyrivibrio sp. LB 2011 contains a dense cytoplasm, the nucleoid DNA stands out by its stringy texture (blue overlay, Nu). Cell membrane (CM, light green), cell wall (CW, two leaflets in pink), and outer membrane (OM, dark green) are highlighted. A flagellum (F) is visible next to the cell. (B) Closer inspection of the cell surface reveals a diderm bacterium with a CW in two leaflets (pink), membranes are highlighted in light green (CM) and dark green (OM). The CW thickness (white line) and distance from the CM (yellow line) were measured as indicated. (C) A line profile through the cellular boundary clearly shows four electron-dense layers. (D) A central cross-section through a Wolinella sp. ATCC 33567 cell. Again, CM, CW, and OM are traced. Ribosomes are visible throughout the cytoplasm (orange), with the exception of a polar exclusion zone (white outline, EZ). A flagellum emerging from the tip is visible next to the cell (F). (E) CM and OM are clearly visible bordering an electron-light periplasm. The CW is visible adjacent to the OM as a faint band. Measurements were performed as indicated. (F) The line profile plot shows that only CM and OM have significant electron density. Slice thickness 10 nm.
Figure 4.
Figure 4.
Cellular architecture reflects changing carbon sources. (A) PCA of the five parameters diameter, circularity, number of electron-dense bounding layers, CW thickness, and CW distance from the CM. Replicates for all 45 samples with associated 3D data are shown. Highlighted are measurements for strains C. thermocellum DSM 1313, B. thetaiotaomicron DSM 2079, and R. bromii L2-63 grown on simple or complex carbon sources. (B) Further analysis shows that the CW of B. thetaiotaomicron DSM 2079 is significantly thicker when grown on starch/maltose (unpaired t-test, P < .001), and that the cells are less circular (P < .001). (C) For R. bromii L2-63, the cell diameter is higher when grown on complex carbon sources starch or pullulan compared to cells grown on fructose (unpaired t-tests, both P < .001). Example micrographs shown below.
Figure 5.
Figure 5.
Visual diversity emerges in the phylogenetic branches. The Euclidean distance between each pair of replicates as a function of their lowest shared taxonomic rank. Samples within a species show a conserved cellular architecture, as do those within a genus. Starting at the family level, the cellular architectures do not become more diverse within the same domain. As an example, tomogram slices from three representative strains in the genus Bacteroides are shown on the top right: B. caccae DSM 19024, B. cellulosilyticus DSM 14838, and B. thetaiotaomicron DSM 2079. All three present as rod-shaped diderm bacteria with thin CWs. Correspondingly, the mean Euclidean distances between them are low. In contrast, three members of the Lachnospiraceae family show little resemblance and correspondingly higher Euclidean distances: Lachnospira multipara ATCC 19207, B. fibrisolvens CF3, and Roseburia intestinalis DSM 14610.
Figure 6.
Figure 6.
Hierarchical clustering and 3D rendering reveal divergence between genome and morphology. (A) All members of the Lachnospiraceae family were hierarchically clustered by genome contents. Members of the same genus frequently occupy neighboring branches, indicating a reliable link between taxonomy and genome contents at this level. Basic cell shapes are indicated by icon, either rod, ovoid, or vibrioid. (B) 3D renderings of B. fibrisolvens CF3 and A. ruminis cells. The divergent cell architectures are immediately visible: B. fibrisolvens is bound by a CM, a double-layered CW (pink), and an OM (dark green), while A. ruminis only carries one CW layer (pink) on top of the CM (light green). In both cells, the cytoplasm contains a high density of presumptive ribosomes (orange), as well as a nucleoid (blue). A. ruminis additionally contains two chemoreceptor arrays (teal), as well a flagellum in the extracellular space (teal).

Similar articles

Cited by

References

    1. American Society for Microbiology, Bergey DH, Breed RS. Bergey’s Manual of Determinative Bacteriology, by Robert S. Breed [and Others]. Baltimore: Williams & Wilkins Co, 1957.
    1. Atherly T, Ziemer CJ. Bacteroides isolated from four mammalian hosts lack host-specific 16S rRNA gene phylogeny and carbon and nitrogen utilization patterns. Microbiologyopen. 2014;3:225–38. - PMC - PubMed
    1. Bankevich A, Nurk S, Antipov Det al. . SPAdes: a new genome assembly algorithm and its applications to single-cell sequencing. J Comput Biol. 2012;19:455–77. - PMC - PubMed
    1. Brenzinger S, van der Aart LT, van Wezel GPet al. . Structural and proteomic changes in viable but non-culturable Vibrio cholerae. Front Microbiol. 2019;10:793. - PMC - PubMed
    1. Briegel A, Li X, Bilwes AMet al. . Bacterial chemoreceptor arrays are hexagonally packed trimers of receptor dimers networked by rings of kinase and coupling proteins. Proc Natl Acad Sci USA. 2012;109:3766–71. - PMC - PubMed

LinkOut - more resources