

Genome-wide association study presents insights into the genetic architecture of drought tolerance in maize seedlings under field water-deficit conditions
- PMID: 37223800
- PMCID: PMC10200999
- DOI: 10.3389/fpls.2023.1165582
Genome-wide association study presents insights into the genetic architecture of drought tolerance in maize seedlings under field water-deficit conditions
Abstract
Introduction: Drought stress is one of the most serious abiotic stresses leading to crop yield reduction. Due to the wide range of planting areas, the production of maize is particularly affected by global drought stress. The cultivation of drought-resistant maize varieties can achieve relatively high, stable yield in arid and semi-arid zones and in the erratic rainfall or occasional drought areas. Therefore, to a great degree, the adverse impact of drought on maize yield can be mitigated by developing drought-resistant or -tolerant varieties. However, the efficacy of traditional breeding solely relying on phenotypic selection is not adequate for the need of maize drought-resistant varieties. Revealing the genetic basis enables to guide the genetic improvement of maize drought tolerance.
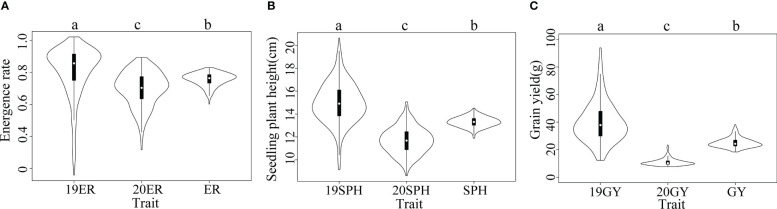
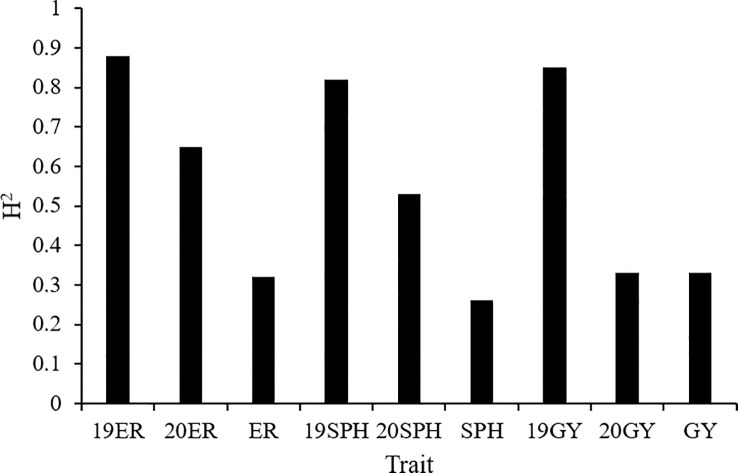
Methods: We utilized a maize association panel of 379 inbred lines with tropical, subtropical and temperate backgrounds to analyze the genetic structure of maize drought tolerance at seedling stage. We obtained the high quality 7837 SNPs from DArT's and 91,003 SNPs from GBS, and a resultant combination of 97,862 SNPs of GBS with DArT's. The maize population presented the lower her-itabilities of the seedling emergence rate (ER), seedling plant height (SPH) and grain yield (GY) under field drought conditions.
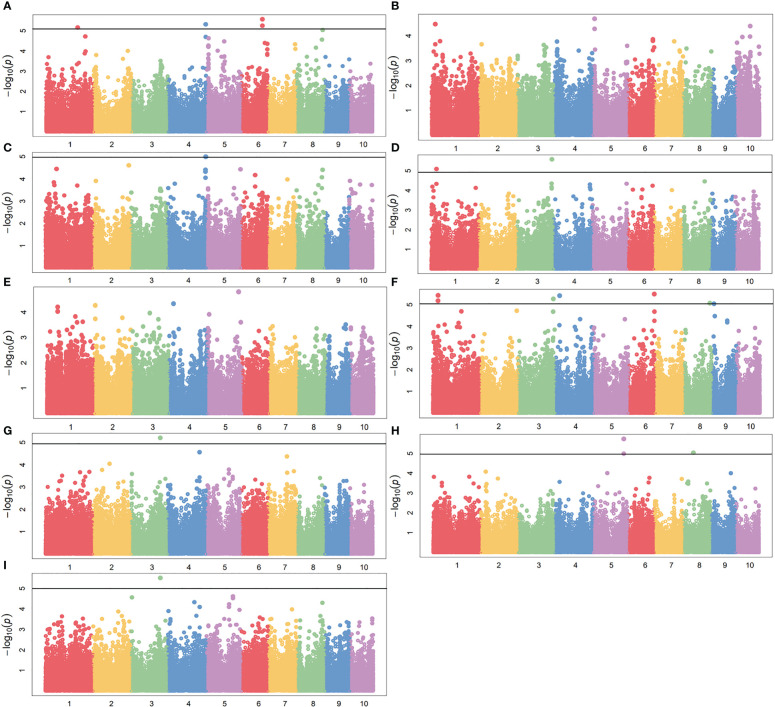
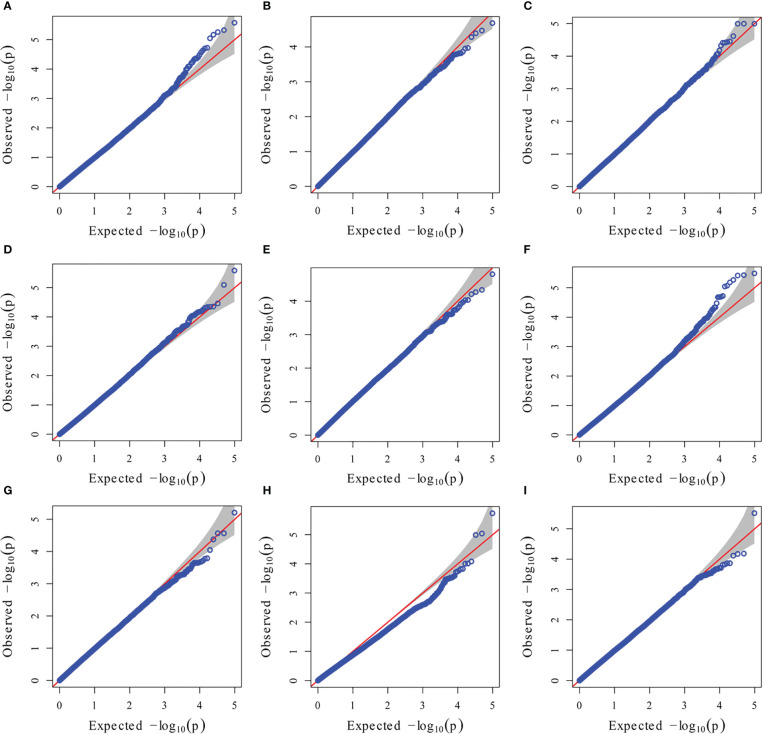
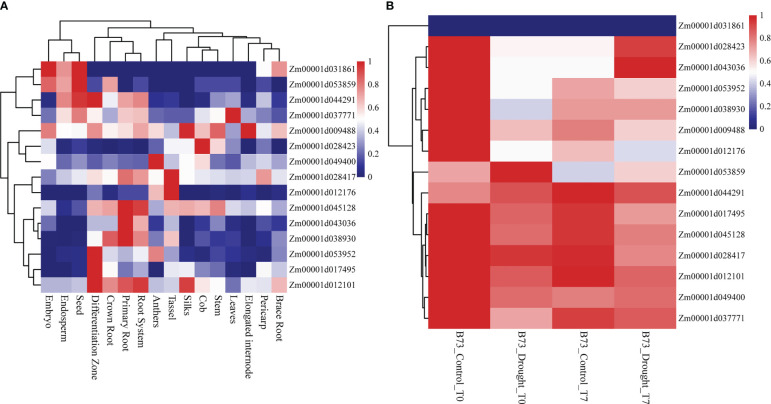
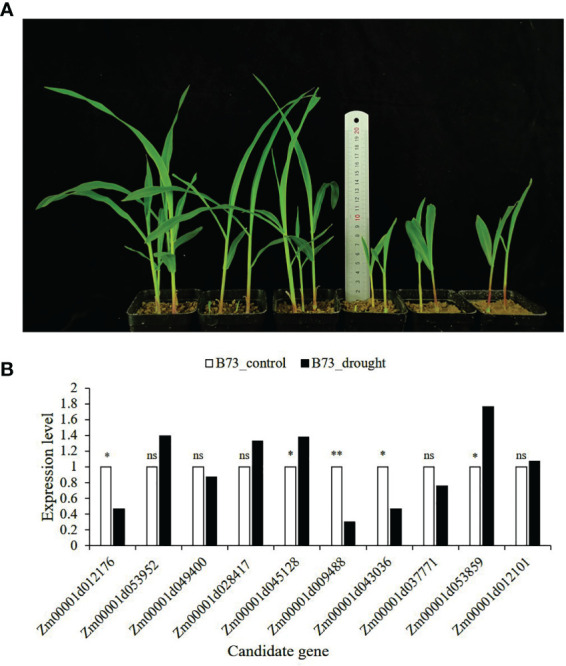
Results: GWAS analysis by MLM and BLINK models with the phenotypic data and 97862 SNPs revealed 15 variants that were significantly independent related to drought-resistant traits at the seedling stage above the threshold of P < 1.02 × 10⁻⁵. We found 15 candidate genes for drought resistance at the seedling stage that may involve in (1) metabolism (Zm00001d012176, Zm00001d012101, Zm00001d009488); (2) programmed cell death (Zm00001d053952); (3) transcriptional regulation (Zm00001d037771, Zm00001d053859, Zm00001d031861, Zm00001d038930, Zm00001d049400, Zm00001d045128 and Zm00001d043036); (4) autophagy (Zm00001d028417); and (5) cell growth and development (Zm00001d017495). The most of them in B73 maize line were shown to change the expression pattern in response to drought stress. These results provide useful information for understanding the genetic basis of drought stress tolerance of maize at seedling stage.
Keywords: SNPs; field drought tolerance; genome-wide association study; maize (Zea mays L.); seedling stage.
Copyright © 2023 Chen, Dang, Liu, Ji, Zheng, Zhao, Dong, Li, Guan, Zhang and Ruan.
Conflict of interest statement
The authors declare that the research was conducted in the absence of any commercial or financial relationships that could be construed as a potential conflict of interest.
Figures
Similar articles
-
Genome-wide analysis of ZmDREB genes and their association with natural variation in drought tolerance at seedling stage of Zea mays L.PLoS Genet. 2013;9(9):e1003790. doi: 10.1371/journal.pgen.1003790. Epub 2013 Sep 26. PLoS Genet. 2013. PMID: 24086146 Free PMC article.
-
Genetics of Germination and Seedling Traits under Drought Stress in a MAGIC Population of Maize.Plants (Basel). 2021 Aug 27;10(9):1786. doi: 10.3390/plants10091786. Plants (Basel). 2021. PMID: 34579319 Free PMC article.
-
Genome-wide association screening and verification of potential genes associated with root architectural traits in maize (Zea mays L.) at multiple seedling stages.BMC Genomics. 2021 Jul 20;22(1):558. doi: 10.1186/s12864-021-07874-x. BMC Genomics. 2021. PMID: 34284723 Free PMC article.
-
Drought stress in maize: stress perception to molecular response and strategies for its improvement.Funct Integr Genomics. 2023 Sep 11;23(4):296. doi: 10.1007/s10142-023-01226-6. Funct Integr Genomics. 2023. PMID: 37697159 Review.
-
Approaches and progress in breeding drought-tolerant maize hybrids for tropical lowlands in west and central Africa.Plant Genome. 2024 Jun;17(2):e20437. doi: 10.1002/tpg2.20437. Epub 2024 Feb 20. Plant Genome. 2024. PMID: 38379199 Review.
Cited by
-
Advancements and Prospects of Genome-Wide Association Studies (GWAS) in Maize.Int J Mol Sci. 2024 Feb 5;25(3):1918. doi: 10.3390/ijms25031918. Int J Mol Sci. 2024. PMID: 38339196 Free PMC article. Review.
-
Genetic Potential of Newly Developed Maize Hybrids under Different Water-Availability Conditions in an Arid Environment.Life (Basel). 2024 Mar 29;14(4):453. doi: 10.3390/life14040453. Life (Basel). 2024. PMID: 38672723 Free PMC article.
-
Genetic, molecular and physiological crosstalk during drought tolerance in maize (Zea mays): pathways to resilient agriculture.Planta. 2024 Aug 28;260(4):81. doi: 10.1007/s00425-024-04517-9. Planta. 2024. PMID: 39196449 Review.
-
Drought stress memory in maize: understanding and harnessing the past for future resilience.Plant Cell Rep. 2025 Apr 25;44(5):101. doi: 10.1007/s00299-025-03494-x. Plant Cell Rep. 2025. PMID: 40278890 Review.
-
Integrative Multi-Omics Approaches for Identifying and Characterizing Biological Elements in Crop Traits: Current Progress and Future Prospects.Int J Mol Sci. 2025 Feb 10;26(4):1466. doi: 10.3390/ijms26041466. Int J Mol Sci. 2025. PMID: 40003933 Free PMC article. Review.
References
-
- Cao S., Loladze A., Yuan Y., Wu Y., Zhang A., Chen J., et al. . (2017. a). Genome-wide analysis of tar spot complex resistance in maize using genotyping-by-Sequencing SNPs and whole-genome prediction. Plant Genome 10 (2), plantgenome2016.2010.0099. doi: 10.3835/plantgenome2016.10.0099 - DOI - PubMed
LinkOut - more resources
Full Text Sources