

Assessing the impact of biochar and nitrogen application on yield, water-nitrogen use efficiency and quality of intercropped maize and soybean
- PMID: 37223811
- PMCID: PMC10200913
- DOI: 10.3389/fpls.2023.1171547
Assessing the impact of biochar and nitrogen application on yield, water-nitrogen use efficiency and quality of intercropped maize and soybean
Abstract
Introduction: Biochar (BC) and nitrogen (N) application have the potential to increase grain yield and resource use efficiency in intercropping systems. However, the effects of different levels of BC and N application in these systems remain unclear. To address this gap, the study is intended to ascertain the impact of various combinations of BC and N fertilizer on the performance of maize-soybean intercropping and determine the optimum application of BC and N for maximizing the effect of the intercropping system.
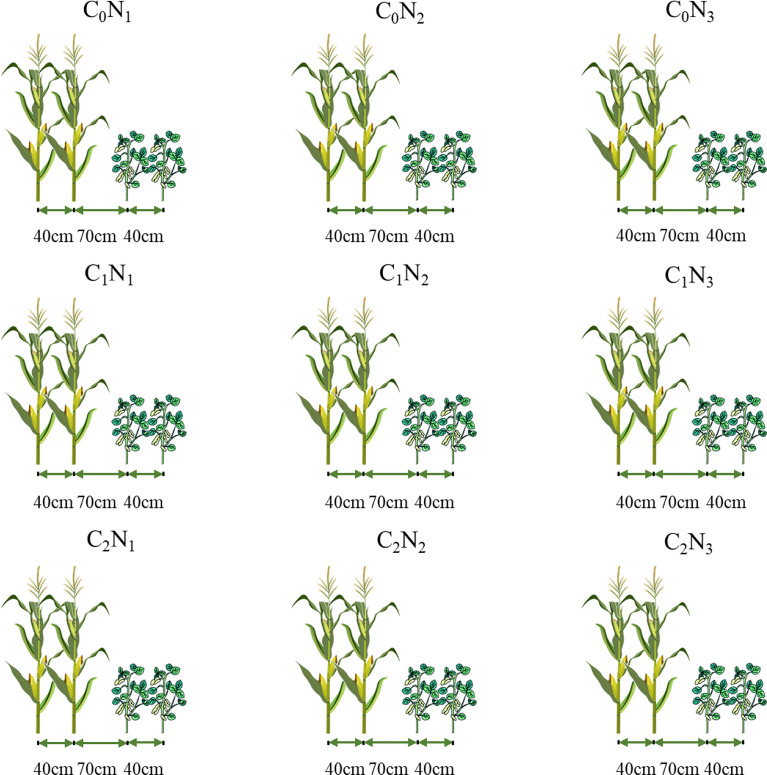
Methods: A two-year (2021-2022) field experiment was conducted in Northeast China to assess the impact of BC (0, 15, and 30 t ha-1) and N application (135, 180, and 225 kg ha-1) on plant growth, yield, water use efficiency (WUE), N recovery efficiency (NRE) and quality in an intercropping system. Maize and soybean were selected as materials in the experiment, where every 2 rows of maize were intercropped with 2 rows of soybean.
Results and discussion: The results showed that the combination of BC and N significantly affected the yield, WUE, NRE and quality of intercropped maize and soybean. The treatment of 15 t ha-1 BC and 180 kg ha-1 N increased grain yield and WUE, while that of 15 t ha-1 BC and 135 kg ha-1 N enhanced NRE in both years. Nitrogen promoted the protein and oil content of intercropped maize, but decreased the protein and oil content of intercropped soybean. BC did not enhance the protein and oil content of intercropped maize, especially in the first year, but increased maize starch content. BC was found to have no positive impact on soybean protein, but it unexpectedly increased soybean oil content. The TOPSIS method revealed that the comprehensive assessment value first increased and then declined with increasing BC and N application. BC improved the performance of maize-soybean intercropping system in terms of yield, WUE, NRE, and quality while N fertilizer input was reduced. The highest grain yield in two years was achieved for BC of 17.1-23.0 t ha-1 and N of 156-213 kg ha-1 in 2021, and 12.0-18.8 t ha-1 BC and 161-202 kg ha-1 N in 2022. These findings provide a comprehensive understanding of the growth of maize-soybean intercropping system and its potential to enhance the production in northeast China.
Keywords: NRE; NUE; biochar; maize-soybean intercropping; nitrogen application; yield.
Copyright © 2023 Wang, Yu, Ji, Khan, Li, Rehman, Liu and Li.
Conflict of interest statement
The authors declare that the research was conducted in the absence of any commercial or financial relationships that could be construed as a potential conflict of interest.
Figures


Similar articles
-
Rational Water and Nitrogen Regulation Can Improve Yield and Water-Nitrogen Productivity of the Maize (Zea mays L.)-Soybean (Glycine max L. Merr.) Strip Intercropping System in the China Hexi Oasis Irrigation Area.Plants (Basel). 2025 Jul 4;14(13):2050. doi: 10.3390/plants14132050. Plants (Basel). 2025. PMID: 40648059 Free PMC article.
-
[Effects of reduced N application rate on yield and nutrient uptake and utilization in maize-soybean relay strip intercropping system].Ying Yong Sheng Tai Xue Bao. 2014 Feb;25(2):474-82. Ying Yong Sheng Tai Xue Bao. 2014. PMID: 24830248 Chinese.
-
Evaluating the influence of straw mulching and intercropping on nitrogen uptake, crop growth, and yield performance in maize and soybean.Front Plant Sci. 2023 Oct 13;14:1280382. doi: 10.3389/fpls.2023.1280382. eCollection 2023. Front Plant Sci. 2023. PMID: 37900744 Free PMC article.
-
Assessment of molybdenum application on soybean physiological characteristics in maize-soybean intercropping.Front Plant Sci. 2023 Sep 29;14:1240146. doi: 10.3389/fpls.2023.1240146. eCollection 2023. Front Plant Sci. 2023. PMID: 37841600 Free PMC article.
-
Agro-Techniques for Lodging Stress Management in Maize-Soybean Intercropping System-A Review.Plants (Basel). 2020 Nov 17;9(11):1592. doi: 10.3390/plants9111592. Plants (Basel). 2020. PMID: 33212960 Free PMC article. Review.
Cited by
-
Increasing pesticide diversity impairs soil microbial functions.Proc Natl Acad Sci U S A. 2025 Jan 14;122(2):e2419917122. doi: 10.1073/pnas.2419917122. Epub 2025 Jan 9. Proc Natl Acad Sci U S A. 2025. PMID: 39786931 Free PMC article.
-
Macrogenomics-Based Analysis of the Effects of Intercropped Soybean Photosynthetic Characteristics and Nitrogen-Assimilating Enzyme Activities on Yield at Different Nitrogen Levels.Microorganisms. 2024 Jun 18;12(6):1220. doi: 10.3390/microorganisms12061220. Microorganisms. 2024. PMID: 38930602 Free PMC article.
-
Exploring the effect of different application rates of biochar on the accumulation of nutrients and growth of flue-cured tobacco (Nicotiana tabacum).Front Plant Sci. 2024 Feb 23;15:1225031. doi: 10.3389/fpls.2024.1225031. eCollection 2024. Front Plant Sci. 2024. PMID: 38463569 Free PMC article.
-
Enhancing production efficiency through optimizing plant density in maize-soybean strip intercropping.Front Plant Sci. 2024 Oct 11;15:1473786. doi: 10.3389/fpls.2024.1473786. eCollection 2024. Front Plant Sci. 2024. PMID: 39464277 Free PMC article.
-
Elucidating the impact of biochar with different carbon/nitrogen ratios on soil biochemical properties and rhizosphere bacterial communities of flue-cured tobacco plants.Front Plant Sci. 2023 Sep 15;14:1250669. doi: 10.3389/fpls.2023.1250669. eCollection 2023. Front Plant Sci. 2023. PMID: 37790782 Free PMC article.
References
-
- Ahmed S., Raza M. A., Zhou T., Hussain S., Khalid M. H. B., Feng L., et al. . (2018). Responses of soybean dry matter production, phosphorus accumulation, and seed yield to sowing time under relay intercropping with maize. Agronomy 8, 282. doi: 10.3390/agronomy8120282 - DOI
-
- Ajayi A. E., Horn R. (2016). Modification of chemical and hydro-physical properties of two texturally differentiated soils due to varying magnitudes of added biochar. Soil Tillage Res. 164, 34–44. doi: 10.1016/j.still.2016.01.011 - DOI
-
- Akhtar S. S., Guitong L., Mathias N. A., Fulai L. (2014). Biochar enhances yield and quality of tomato under reduced irrigation. Agric. Water Manage. 138, 37–44. doi: 10.1016/j.agwat.2014.02.016 - DOI
-
- Alkharabsheh H. M., Seleiman M. F., Battaglia L. B., Shami A., Jalal S. R., Bushra A. A., et al. . (2021). Biochar and its broad impacts in soil quality and Fertility,Nutrient leaching and crop productivity: a review. Agronomy 11, 5. doi: 10.3390/agronomy11050993 - DOI
-
- Amanullah, Khattak R. A., Khalil S. K. (2009). Plant density and nitrogen effects on maize phenologyand grain yield. J. Plant Nutr. 32 (2), 246–260. doi: 10.1080/01904160802592714 - DOI
LinkOut - more resources
Full Text Sources
Research Materials
Miscellaneous