. 2023 Aug 1;29(15):2933-2943.
doi: 10.1158/1078-0432.CCR-22-3743.

Immunogenomic Landscape of Neuroendocrine Prostate Cancer

Affiliations

Immunogenomic Landscape of Neuroendocrine Prostate Cancer

Bhavneet Bhinder et al. Clin Cancer Res. .

Abstract

Purpose: Patients with neuroendocrine prostate cancer (NEPC) are often managed with immunotherapy regimens extrapolated from small-cell lung cancer (SCLC). We sought to evaluate the tumor immune landscape of NEPC compared with other prostate cancer types and SCLC.

Experimental design: In this retrospective study, a cohort of 170 patients with 230 RNA-sequencing and 104 matched whole-exome sequencing data were analyzed. Differences in immune and stromal constituents, frequency of genomic alterations, and associations with outcomes were evaluated.

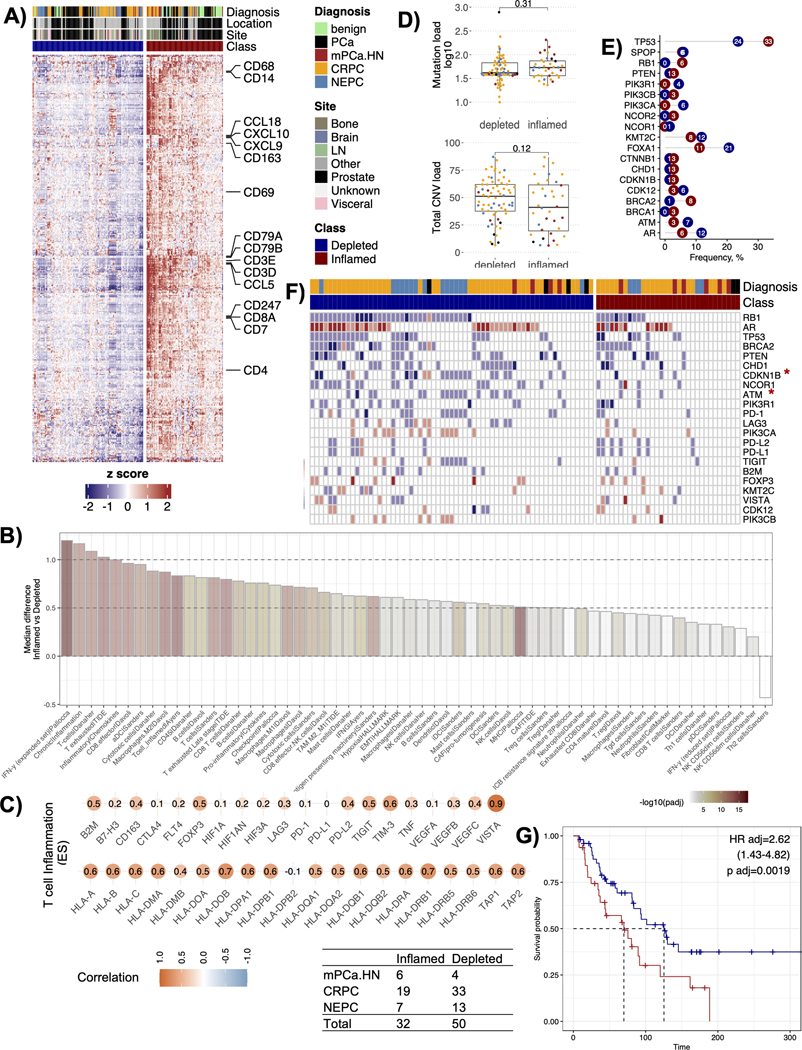
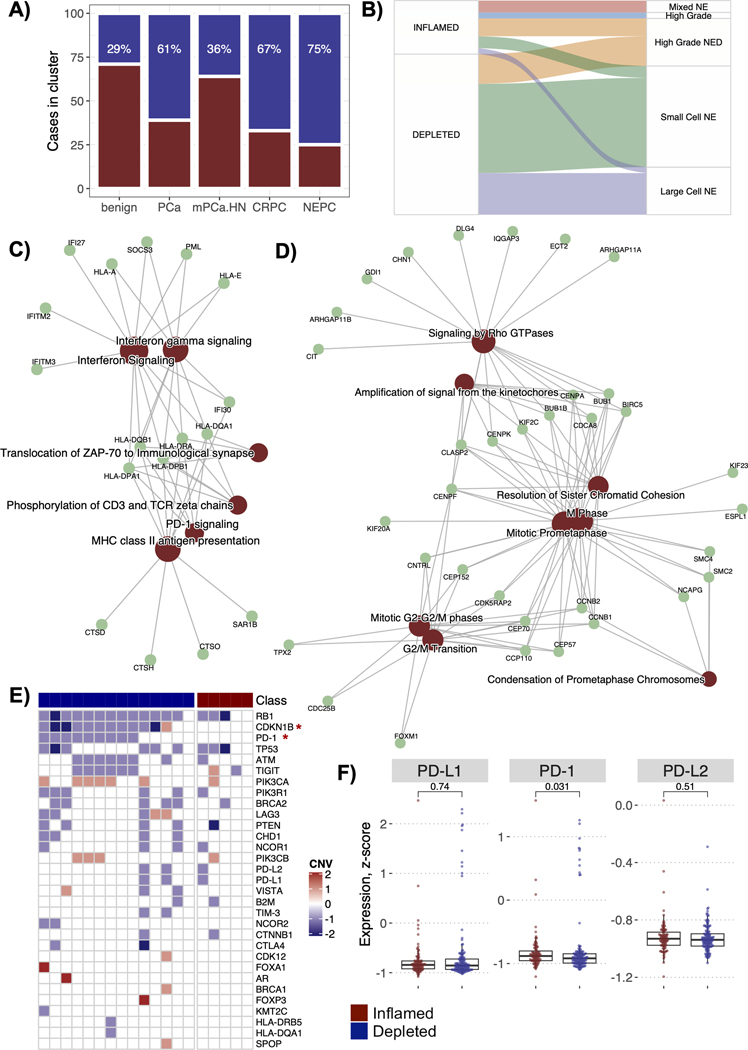
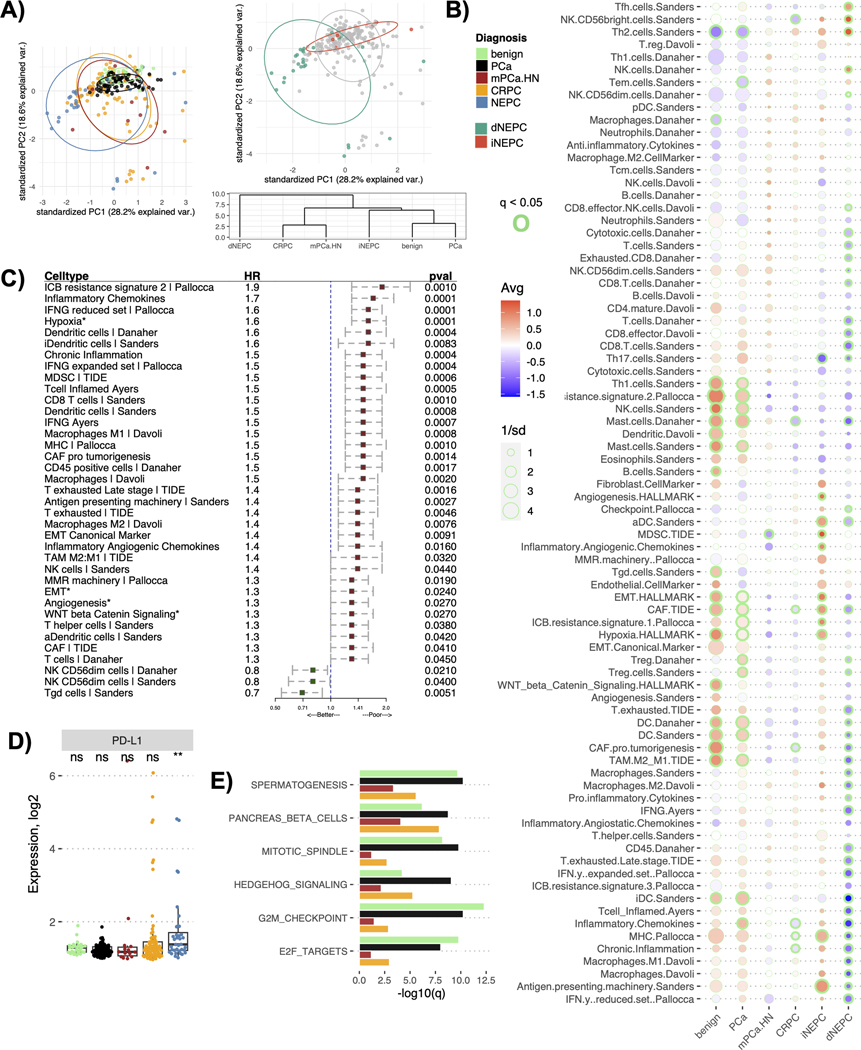
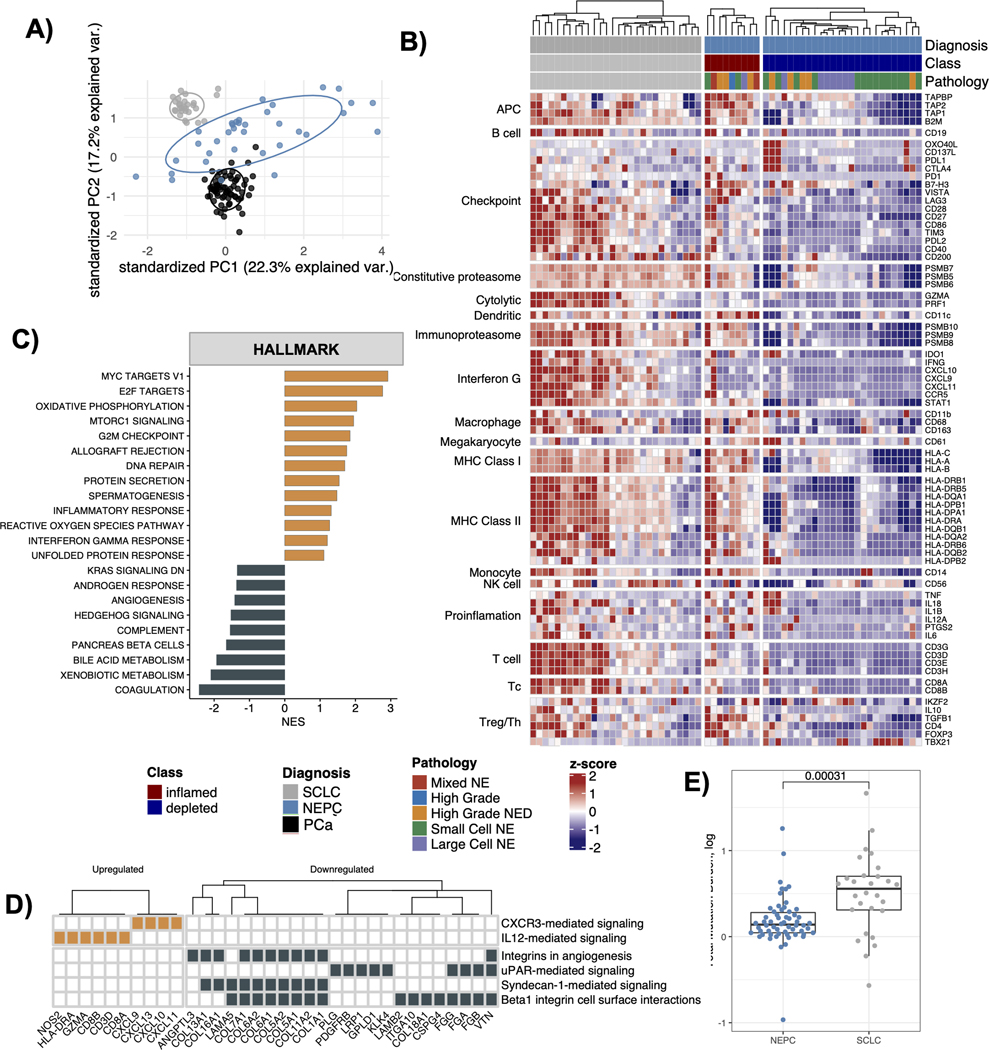
Results: In our cohort, 36% of the prostate tumors were identified as CD8+ T-cell inflamed, whereas the remaining 64% were T-cell depleted. T-cell-inflamed tumors were enriched in anti-inflammatory M2 macrophages and exhausted T cells and associated with shorter overall survival relative to T-cell-depleted tumors (HR, 2.62; P < 0.05). Among all prostate cancer types in the cohort, NEPC was identified to be the most immune depleted, wherein only 9 out of the 36 total NEPC tumors were classified as T-cell inflamed. These inflamed NEPC cases were enriched in IFN gamma signaling and PD-1 signaling compared with other NEPC tumors. Comparison of NEPC with SCLC revealed that NEPC had poor immune content and less mutations compared with SCLC, but expression of checkpoint genes PD-L1 and CTLA-4 was comparable between NEPC and SCLC.

Conclusions: NEPC is characterized by a relatively immune-depleted tumor immune microenvironment compared with other primary and metastatic prostate adenocarcinoma except in a minority of cases. These findings may inform development of immunotherapy strategies for patients with advanced prostate cancer.


Conflict of interest statement

H.B. has served as consultant/advisory board member for Janssen, Astellas, Merck, Pfizer, Foundation Medicine, Blue Earth Diagnostics, Amgen, Bayer, Oncorus, LOXO, Daicchi Sankyo, Sanofi, Curie Therapeutics, Novartis, Astra Zeneca; H.B. has received research funding from Janssen, AbbVie/Stemcentrx, Eli Lilly, Astellas, Millennium, Bristol Myers Squibb, Circle Pharma, Daicchi Sankyo, Novartis. O.E. is supported by Janssen, J&J, Astra-Zeneca, Volastra and Eli Lilly research grants; O.E. is scientific advisor and equity holder in Freenome, Owkin, Pionyr Immunotherapeutics, Volastra Therapeutics and One Three Biotech and a paid scientific advisor to Champions Oncology; V.C. has served as a consultant/advisory board member for Janssen, Astellas, Merck, AstraZeneca, Amgen, and Bayer; V.C. has received speaker honoraria or travel support from Astellas, Janssen, Ipsen, Bayer and Bristol.

Figures

Figure 1.
Figure 1.
Classification of prostate tumors based on T-cell immune status. A) Heatmap showing the result of consensus clustering using the 361 gene signature (derived in this study) to group prostate tumors into T-cell inflamed or depleted phenotypes. B) Barplot showing immune and stromal cell types and processes with significantly different median enrichment scores between the inflamed and the depleted T-cell groups (adjusted p value < 0.15, n=58). The x-axis shows the quantified features, and the y-axis shows the difference between the median enrichment scores from the inflamed versus the depleted clusters. The bars are colored by the adjusted p values on a -log10 scale. C) Pearson correlations between a composite T-cell cluster score (derived in this study) and the expression levels of a subset of genes related to immune checkpoints and functions. D) Boxplots showing the differences between the median tumor mutation burden (left panel) and the median total copy number variation (CNV) load (right panel) obtained from the two T-cell immune groups. p values reported are from the Wilcoxon signed-rank test, E) Plot showing the frequency of cases with mutations in known prostate driver genes separated by inflamed (red) versus depleted (blue) T-cell groups. F) Oncoprint plot showing the absolute copy number changes in 31 known prostate driver genomic alterations, MHC compels and common immune checkpoint genes. The oncoprint is segregated by T-cell immune groups and genes restricted to those with alterations in >=10 samples. Color red shows amplifications, blue shows deletions, and white shows a copy neutral status. Asterisk next to a gene denotes p-values significant at < 0.05 in a Fisher’s exact test for that gene. G) Kaplan-Meier survival curves showing a difference in overall survival (OS) between T-cell inflamed and the depleted groups (n=82). Hazard ratio (HR), 95% confidence intervals (upper and lower), and p values are reported from the Cox proportional-hazards regression model adjusted for the cancer types (adj).
Figure 2.
Figure 2.
T-cell groups by prostate cancer diagnoses. A) Barplot showing the percentage of cases among each prostate cancer diagnosis that belongs to T-cell inflamed or depleted groups, B) Sankey plot for the NEPC cases showing which NEPC histological subtype do the T-cell inflamed and depleted cases belong to, C) Enrichment maps for WGCNA module (MEmagenta) enriched in the inflamed NEPC cases. The map shows the network of key module genes and overrepresented pathways from the REACTOME database. D) Enrichment maps for WGCNA module (MEpurple) enriched in the depleted NEPC cases. E) Oncoprint plot for the NEPC cases showing the absolute copy number changes in 31 known prostate driver genomic alterations, MHC complex and common immune checkpoint genes. The oncoprint is segregated by the NEPC inflamed and depleted categories. Color red shows amplifications, blue shows deletions, and white shows a copy neutral status. F) Boxplots to show differences in the gene expression levels of the checkpoint gene PD-1 and its ligands PD-L1 and PD-L2 among the NEPCs, grouped by their inflamed or depleted status. p values reported are from the Wilcoxon signed-rank test.
Figure 3.
Figure 3.
TME profile of distinct prostate cancer types in the cohort. A) Plot for the principal component analysis applied to the TME profiles (comprised of 80 gene signatures) of the prostate cancer cohort colored either by diagnosis (left panel) or by NEPC immune classes (right panel top). The right panel bottom shows a cluster dendrogram for the prostate cancer diagnosis based on their averaged TME profiles. The dendrogram was constructed using the hierarchical clustering (distance= euclidean, method=ward D2), B) Bubble plot showing differences in the averaged TME profiles among the prostate cancer diagnosis in the cohort. The color of the circles indicates the mean (Avg) enrichment score by diagnosis for that feature, with red denoting high values and blue denoting low values on a color gradient scale. The size of the circle is determined by 1/standard deviation (sd) of the scores within that diagnosis, larger the circle smaller the sd among the tumors for that feature scores. The enrichment scores significantly different from at least four other cancers diagnoses being compared at a q < 0.05 are outlined with green, the thickness of the circle denotes the number of diagnoses it is significantly different from, C) Forest plots showing associations between the OS and individual features of the TME profile. Asterisk indicates that the corresponding feature is a cancer hallmark pathway. Hazard ratio (HR) and p-values (pval) are reported from the Cox proportional-hazards regression models adjusted for cancer type. The plot only shows associations that were significant at p < 0.05, D) Boxplot showing the differences in the gene expression levels of PD-L1 among the prostate cancer types. Asterisk denotes levels significantly different from all other cancer types compared (p < 0.05), while ns denotes not significant p-values from Wilcoxon signed-rank test, E) Barplot showing the cancer hallmark pathways significantly overexpressed in NEPCs compared to all other prostate diagnosis. The x-axis shows q values (-log10 scale) for the differences between the enrichment scores for the corresponding pathways in NEPC versus the cancer type being compared to.
Figure 4.
Figure 4.
Comparative analysis between NEPC and SCLC. A) Principal component analysis plot for the gene expression profiles obtained from NEPC, PCa and SCLC tumors, B) Heatmap showing expression of marker genes for immune cell types and immune checkpoint among the NEPC and SCLC tumors. The gene expression values are scaled by row and the plot is segregated by cancer diagnosis and the immune status of NEPCs tumors, C) Barplot showing cancer hallmark pathways identified as significantly upregulated (orange) or downregulated (black) in the SCLC versus the NEPCs (fdr < 0.25). x-axis shows normalized enrichment scores (NES) from the GSEA analysis applied to the list of genes differentially expressed between SCLC versus NEPC, ranked by their log2 fold change values, D) Heatmap showing 6 out of the 12 total enriched NCI-Nature_2016 pathways (enrichR) in the DEGs for SCLC versus NEPC, E) Boxplot showing the difference in tumor mutation burden between the NEPC and the SCLC tumors. p values reported are from the Wilcoxon signed-rank test.

References

    1. Sung H, et al., Global Cancer Statistics 2020: GLOBOCAN Estimates of Incidence and Mortality Worldwide for 36 Cancers in 185 Countries. CA Cancer J Clin, 2021. 71(3): p. 209–249. - PubMed
    1. Beltran H, et al., Divergent clonal evolution of castration-resistant neuroendocrine prostate cancer. Nat Med, 2016. 22(3): p. 298–305. - PMC - PubMed
    1. Bluemn EG, et al., Androgen Receptor Pathway-Independent Prostate Cancer Is Sustained through FGF Signaling. Cancer Cell, 2017. 32(4): p. 474–489 e6. - PMC - PubMed
    1. Aggarwal R, et al., Clinical and Genomic Characterization of Treatment-Emergent Small-Cell Neuroendocrine Prostate Cancer: A Multi-institutional Prospective Study. J Clin Oncol, 2018. 36(24): p. 2492–2503. - PMC - PubMed
    1. Abida W, et al., Genomic correlates of clinical outcome in advanced prostate cancer. Proc Natl Acad Sci U S A, 2019. 116(23): p. 11428–11436. - PMC - PubMed

Publication types

MeSH terms