. 2023 Jun 27;42(6):112552.
doi: 10.1016/j.celrep.2023.112552. Epub 2023 May 23.

The adhesion GPCRs CELSR1-3 and LPHN3 engage G proteins via distinct activation mechanisms

Affiliations

The adhesion GPCRs CELSR1-3 and LPHN3 engage G proteins via distinct activation mechanisms

Duy Lan Huong Bui et al. Cell Rep. .

Abstract

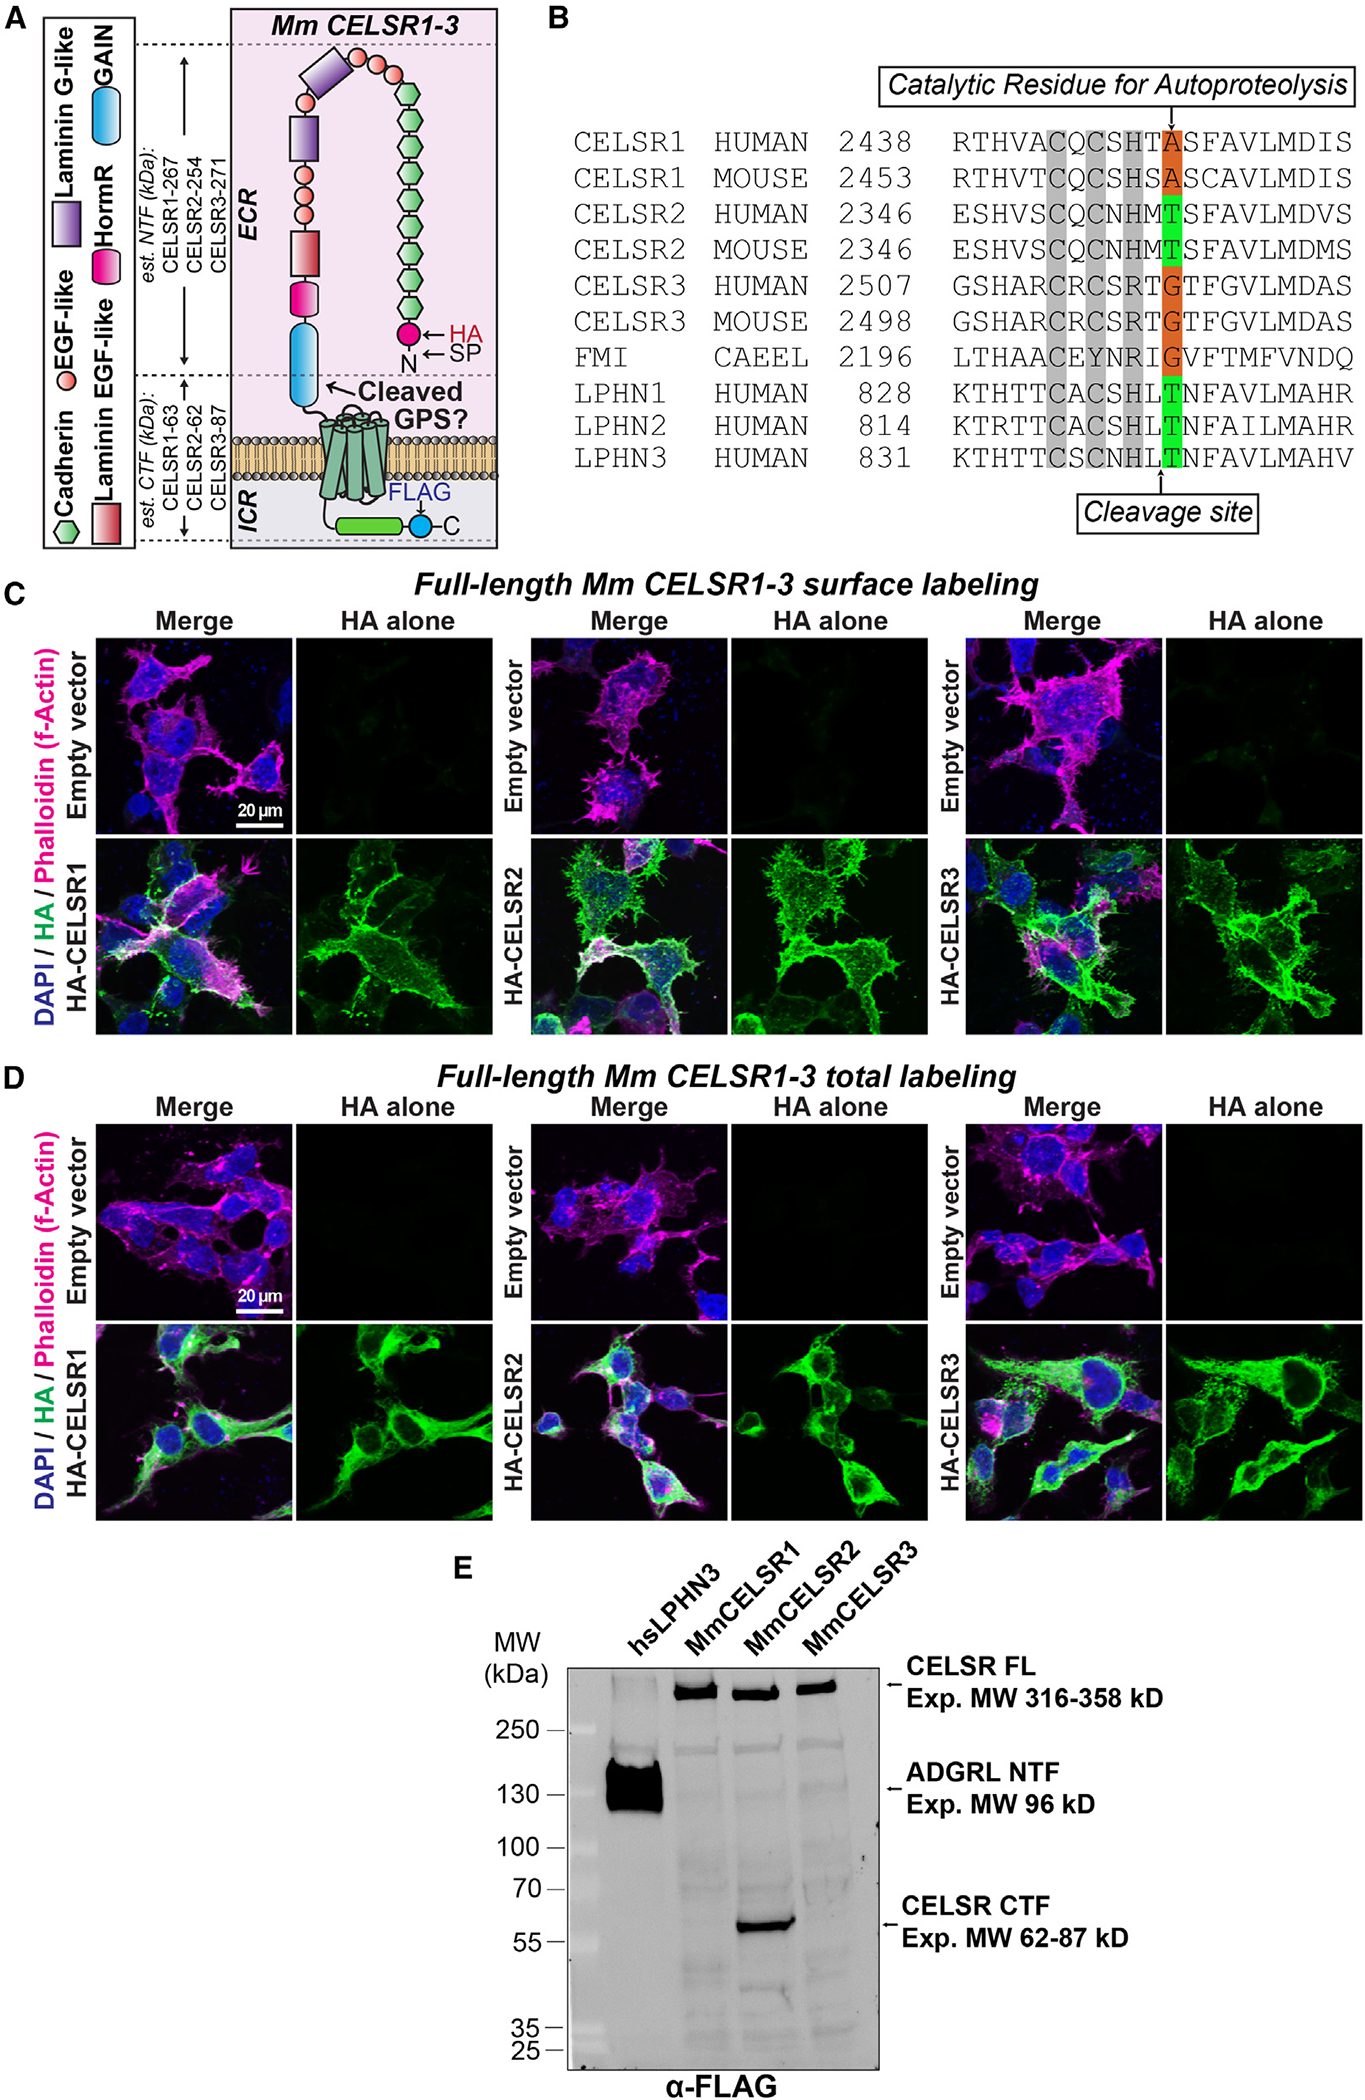
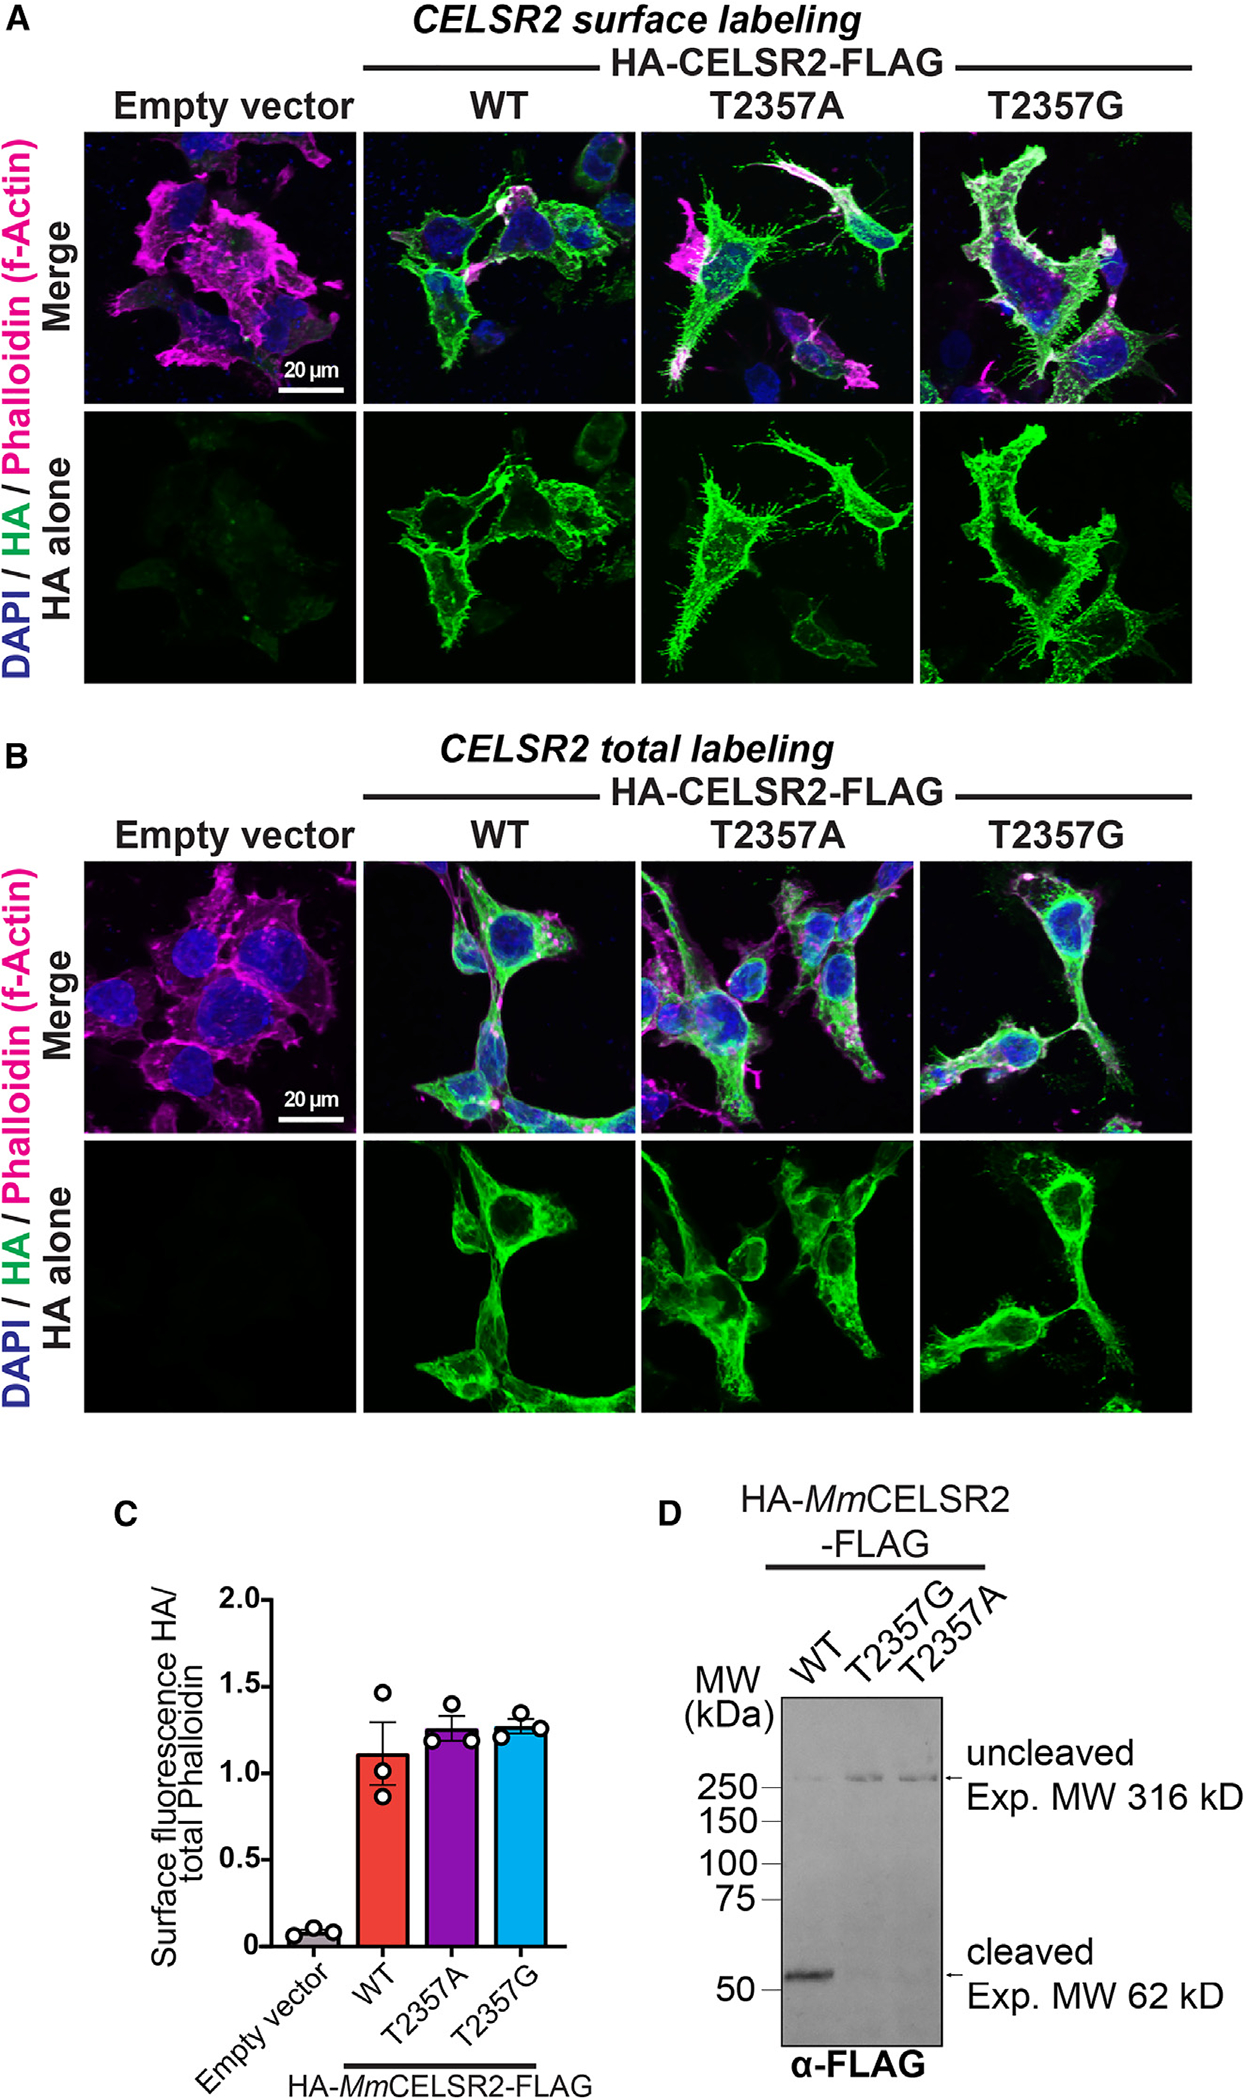
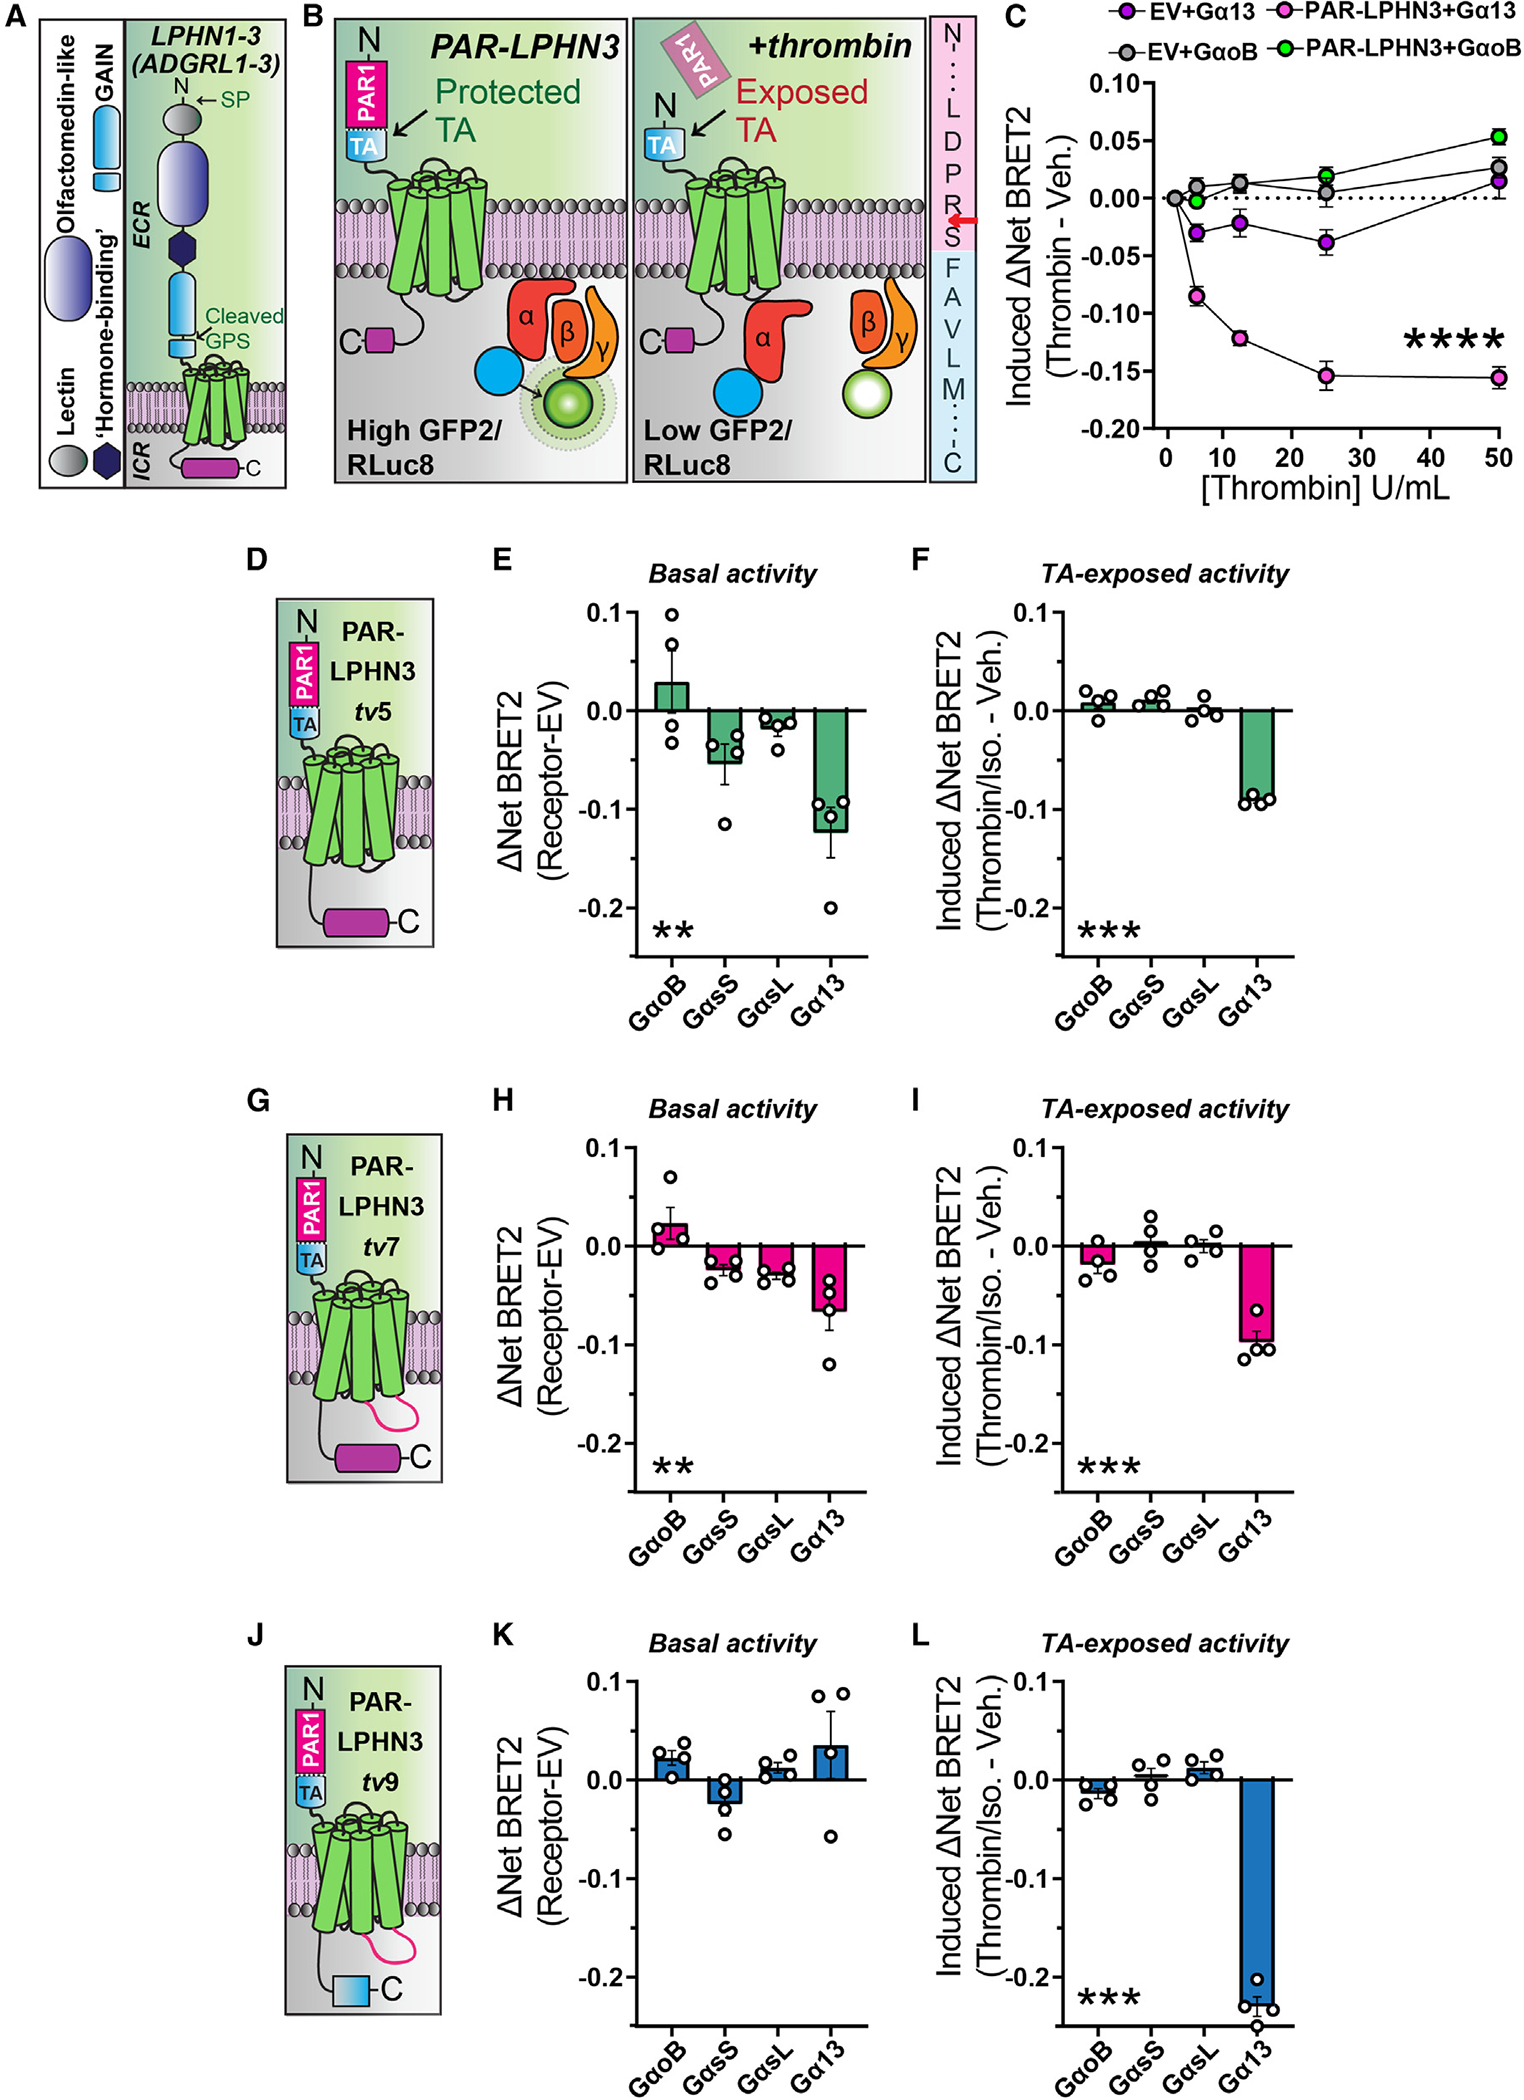
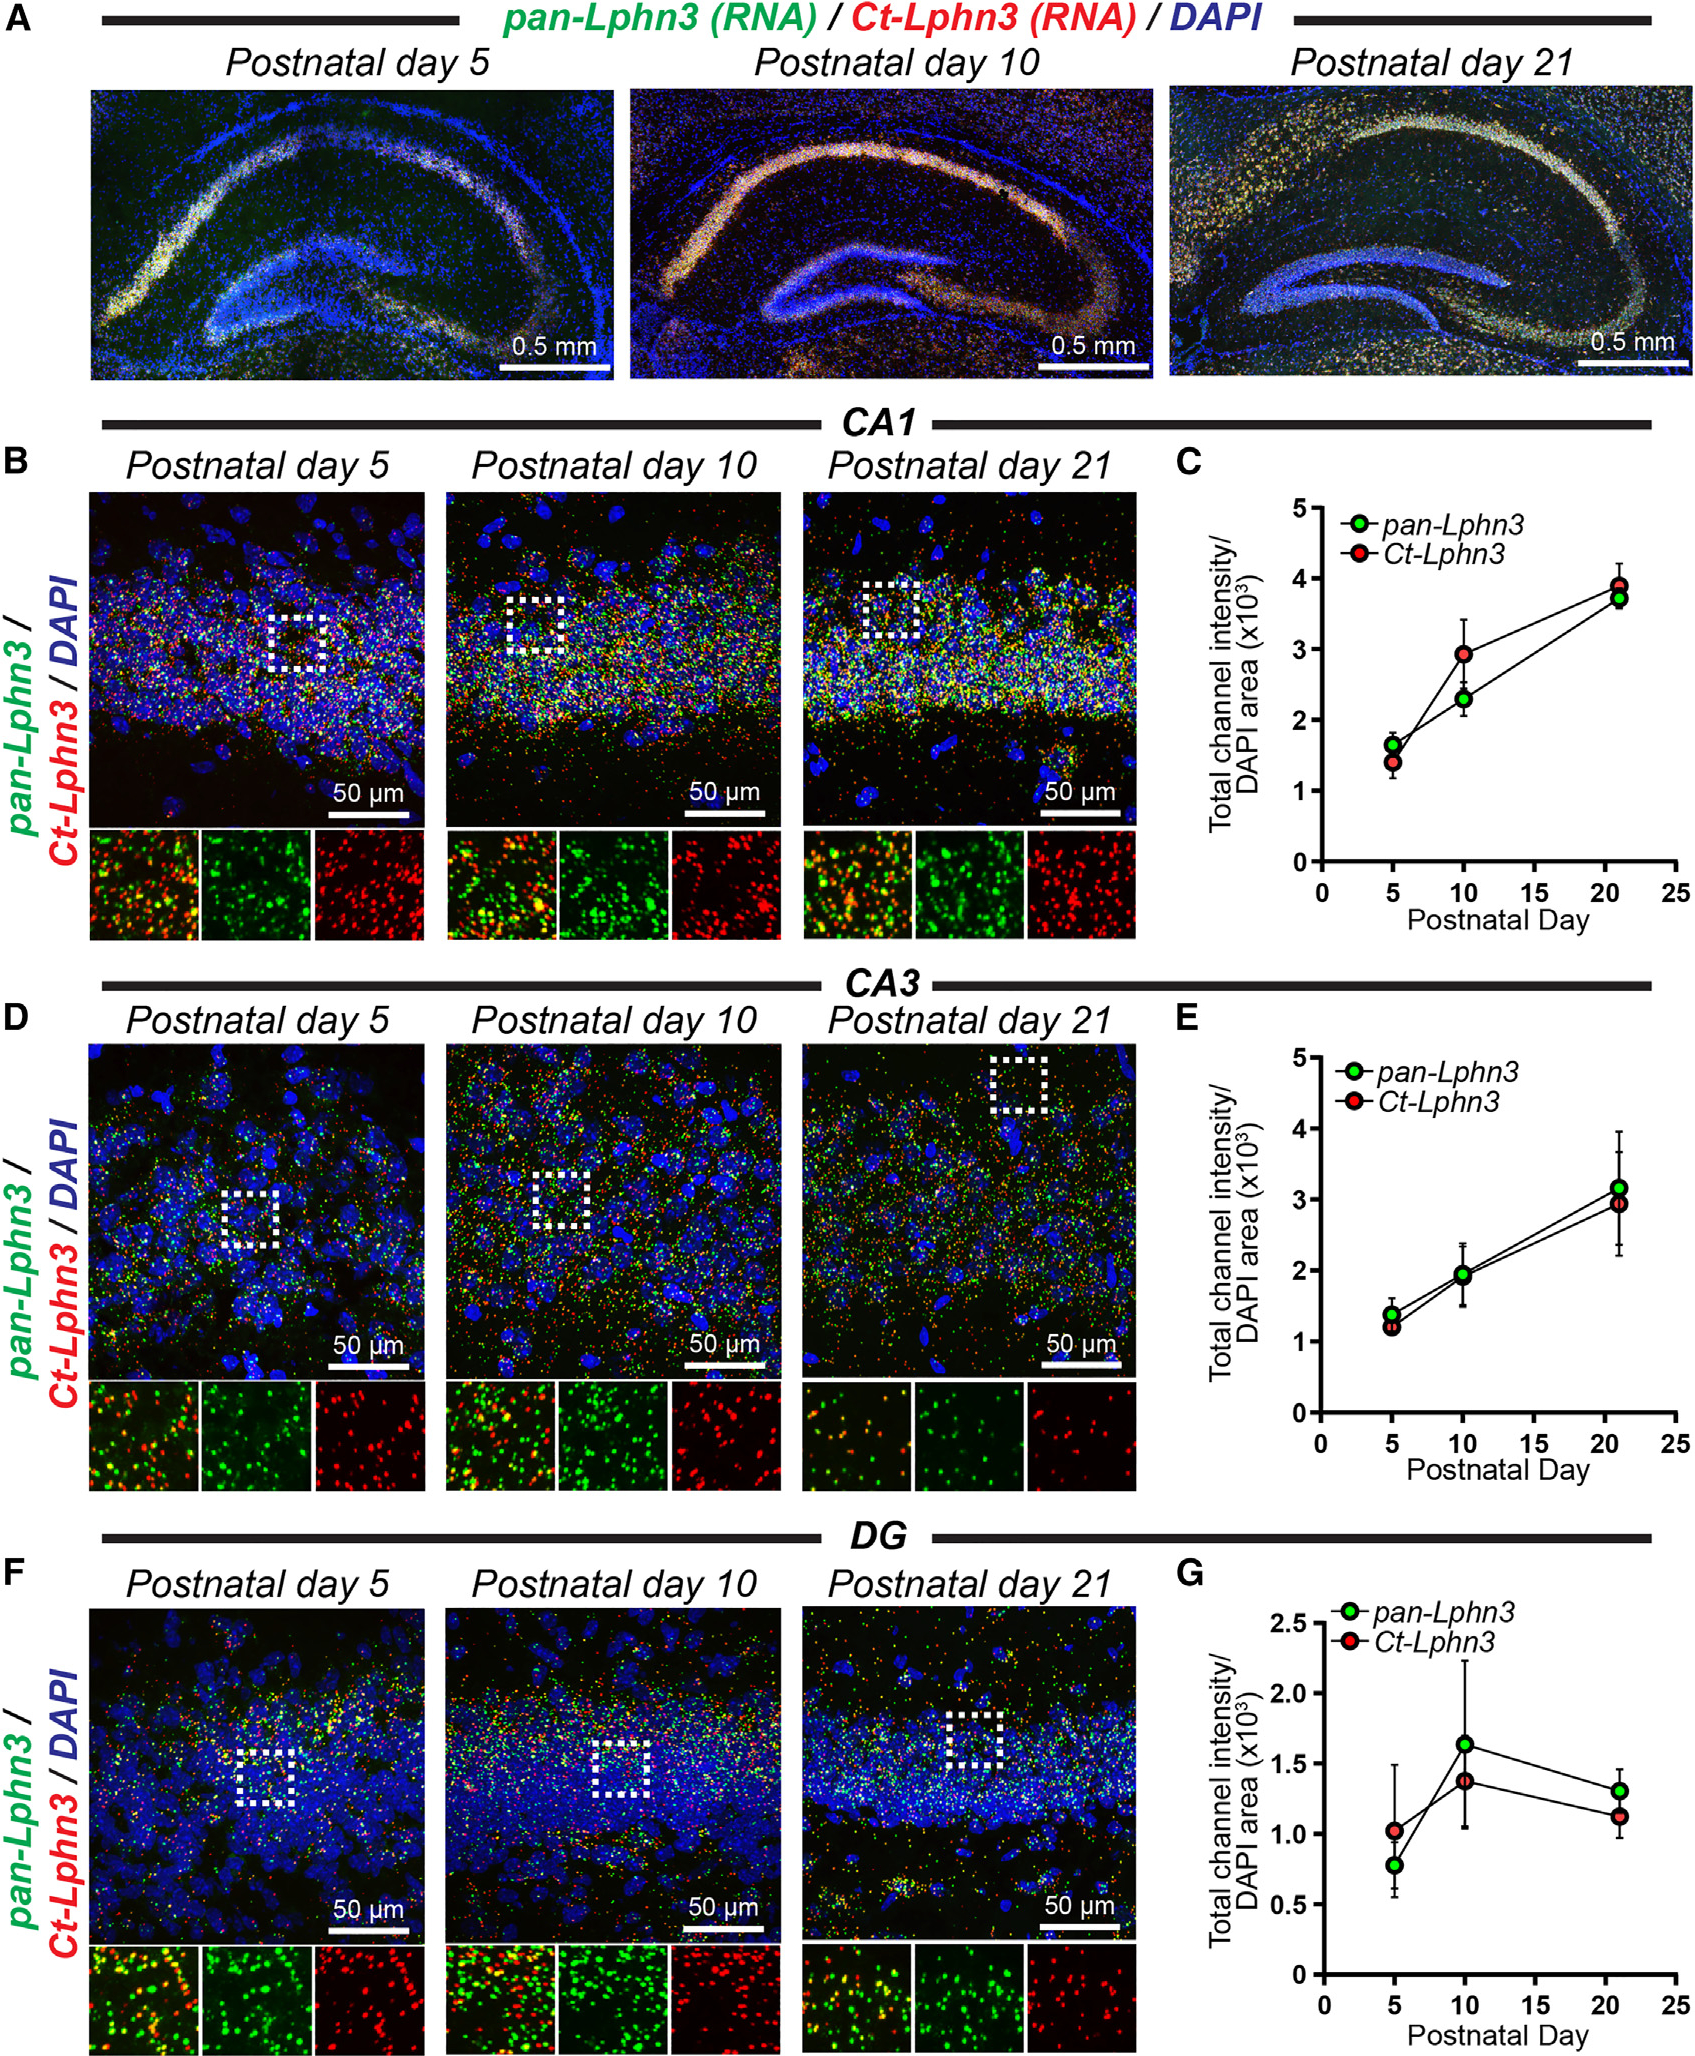
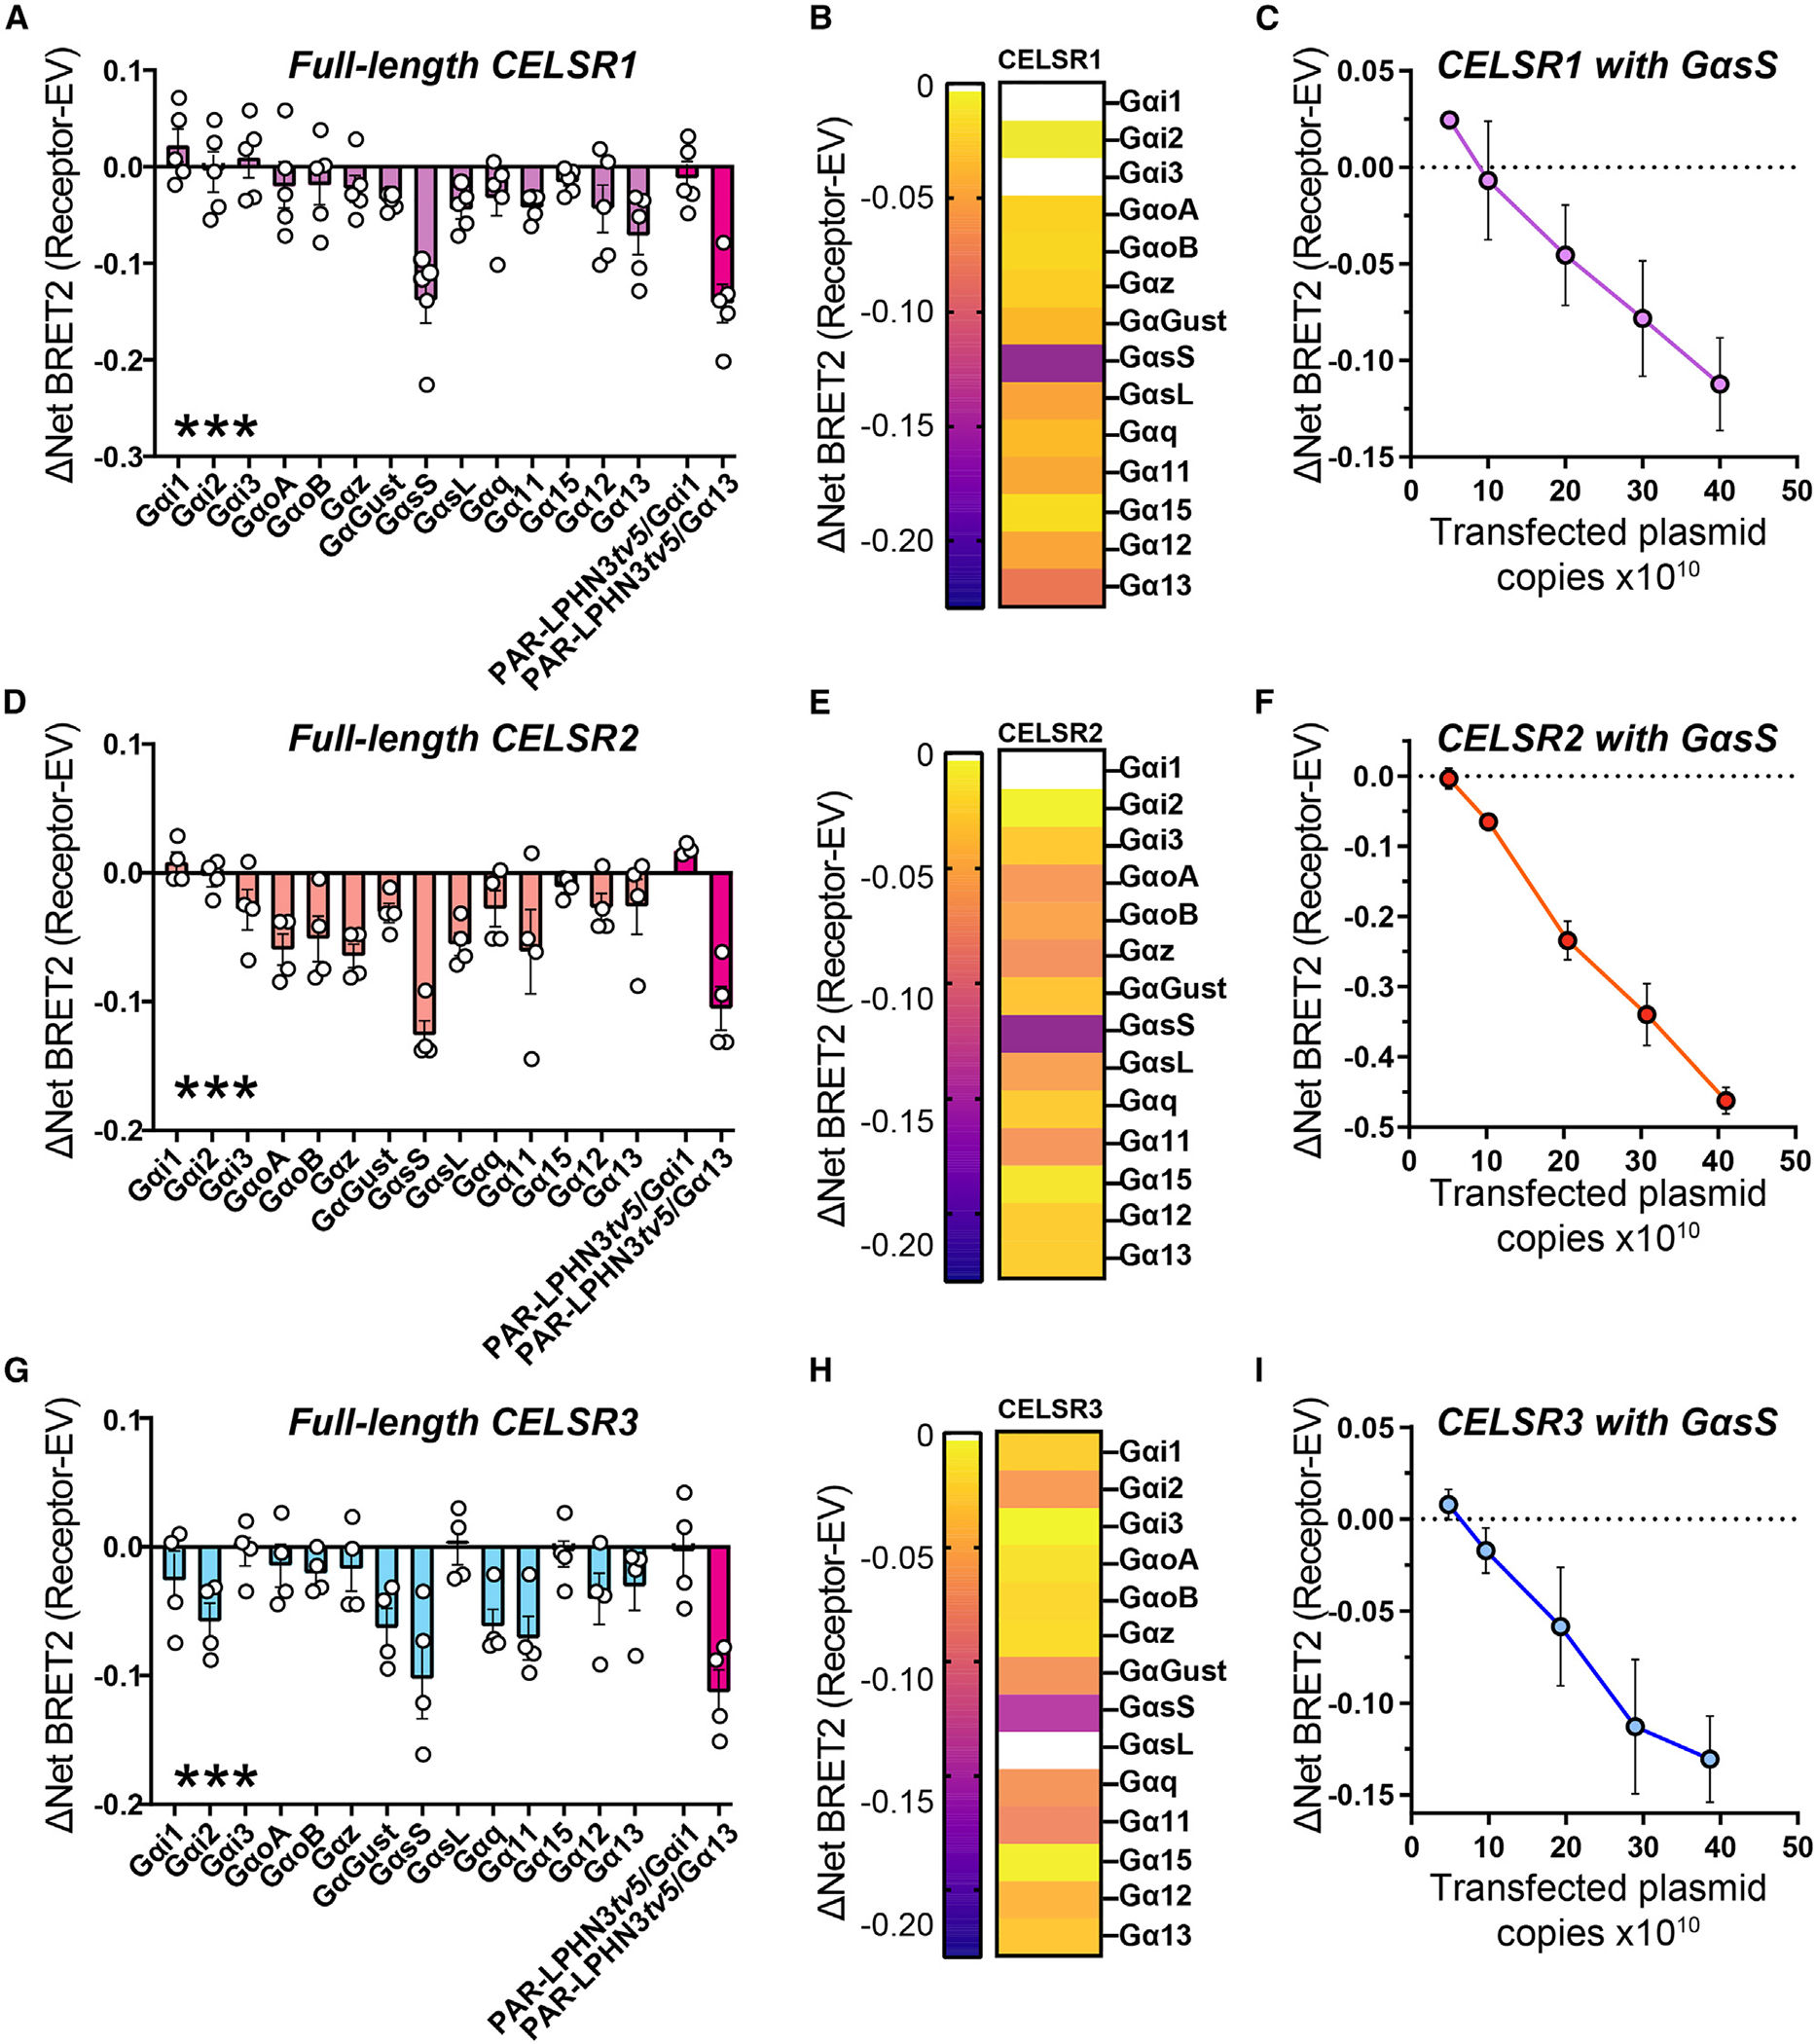
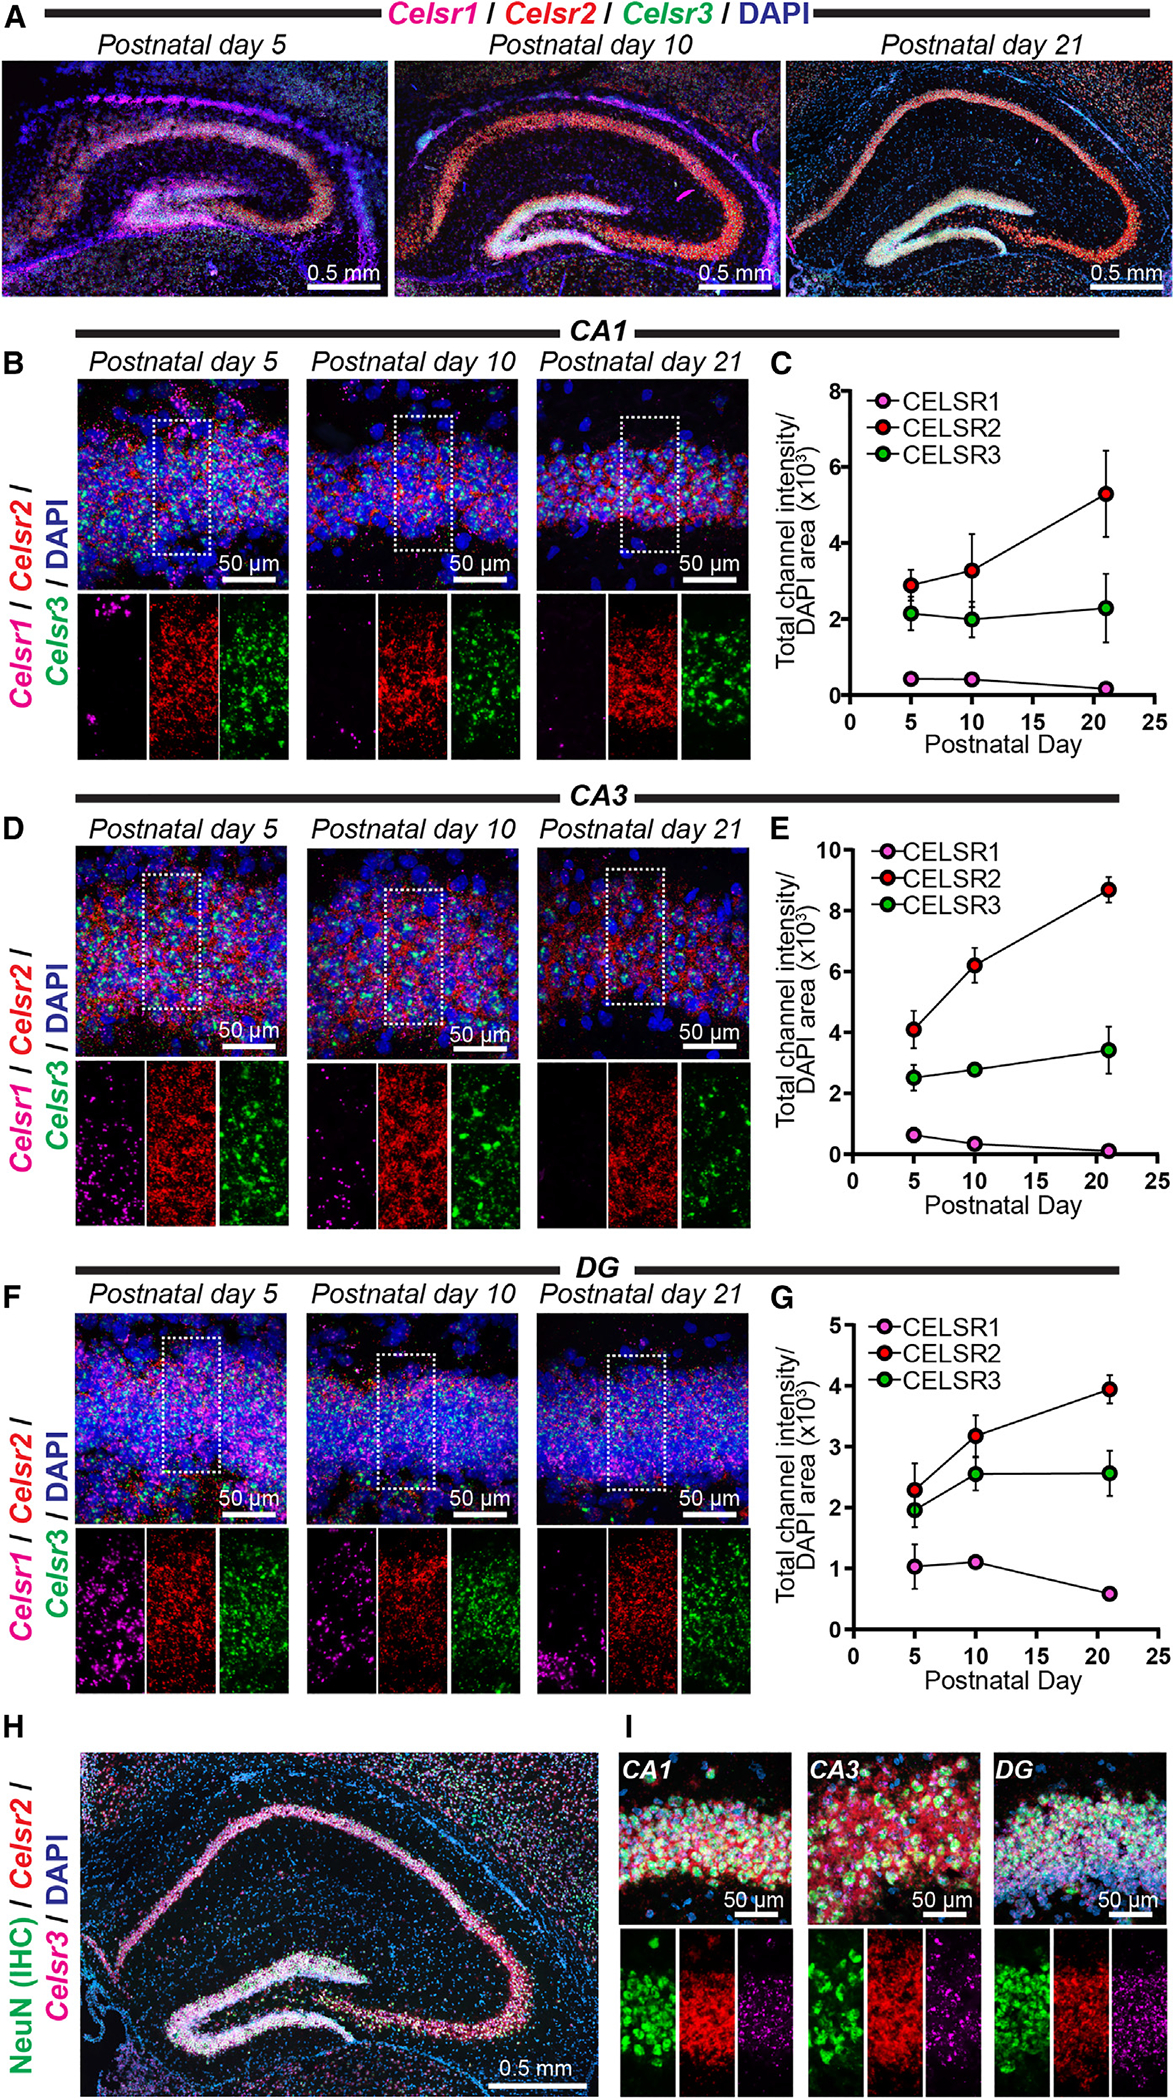
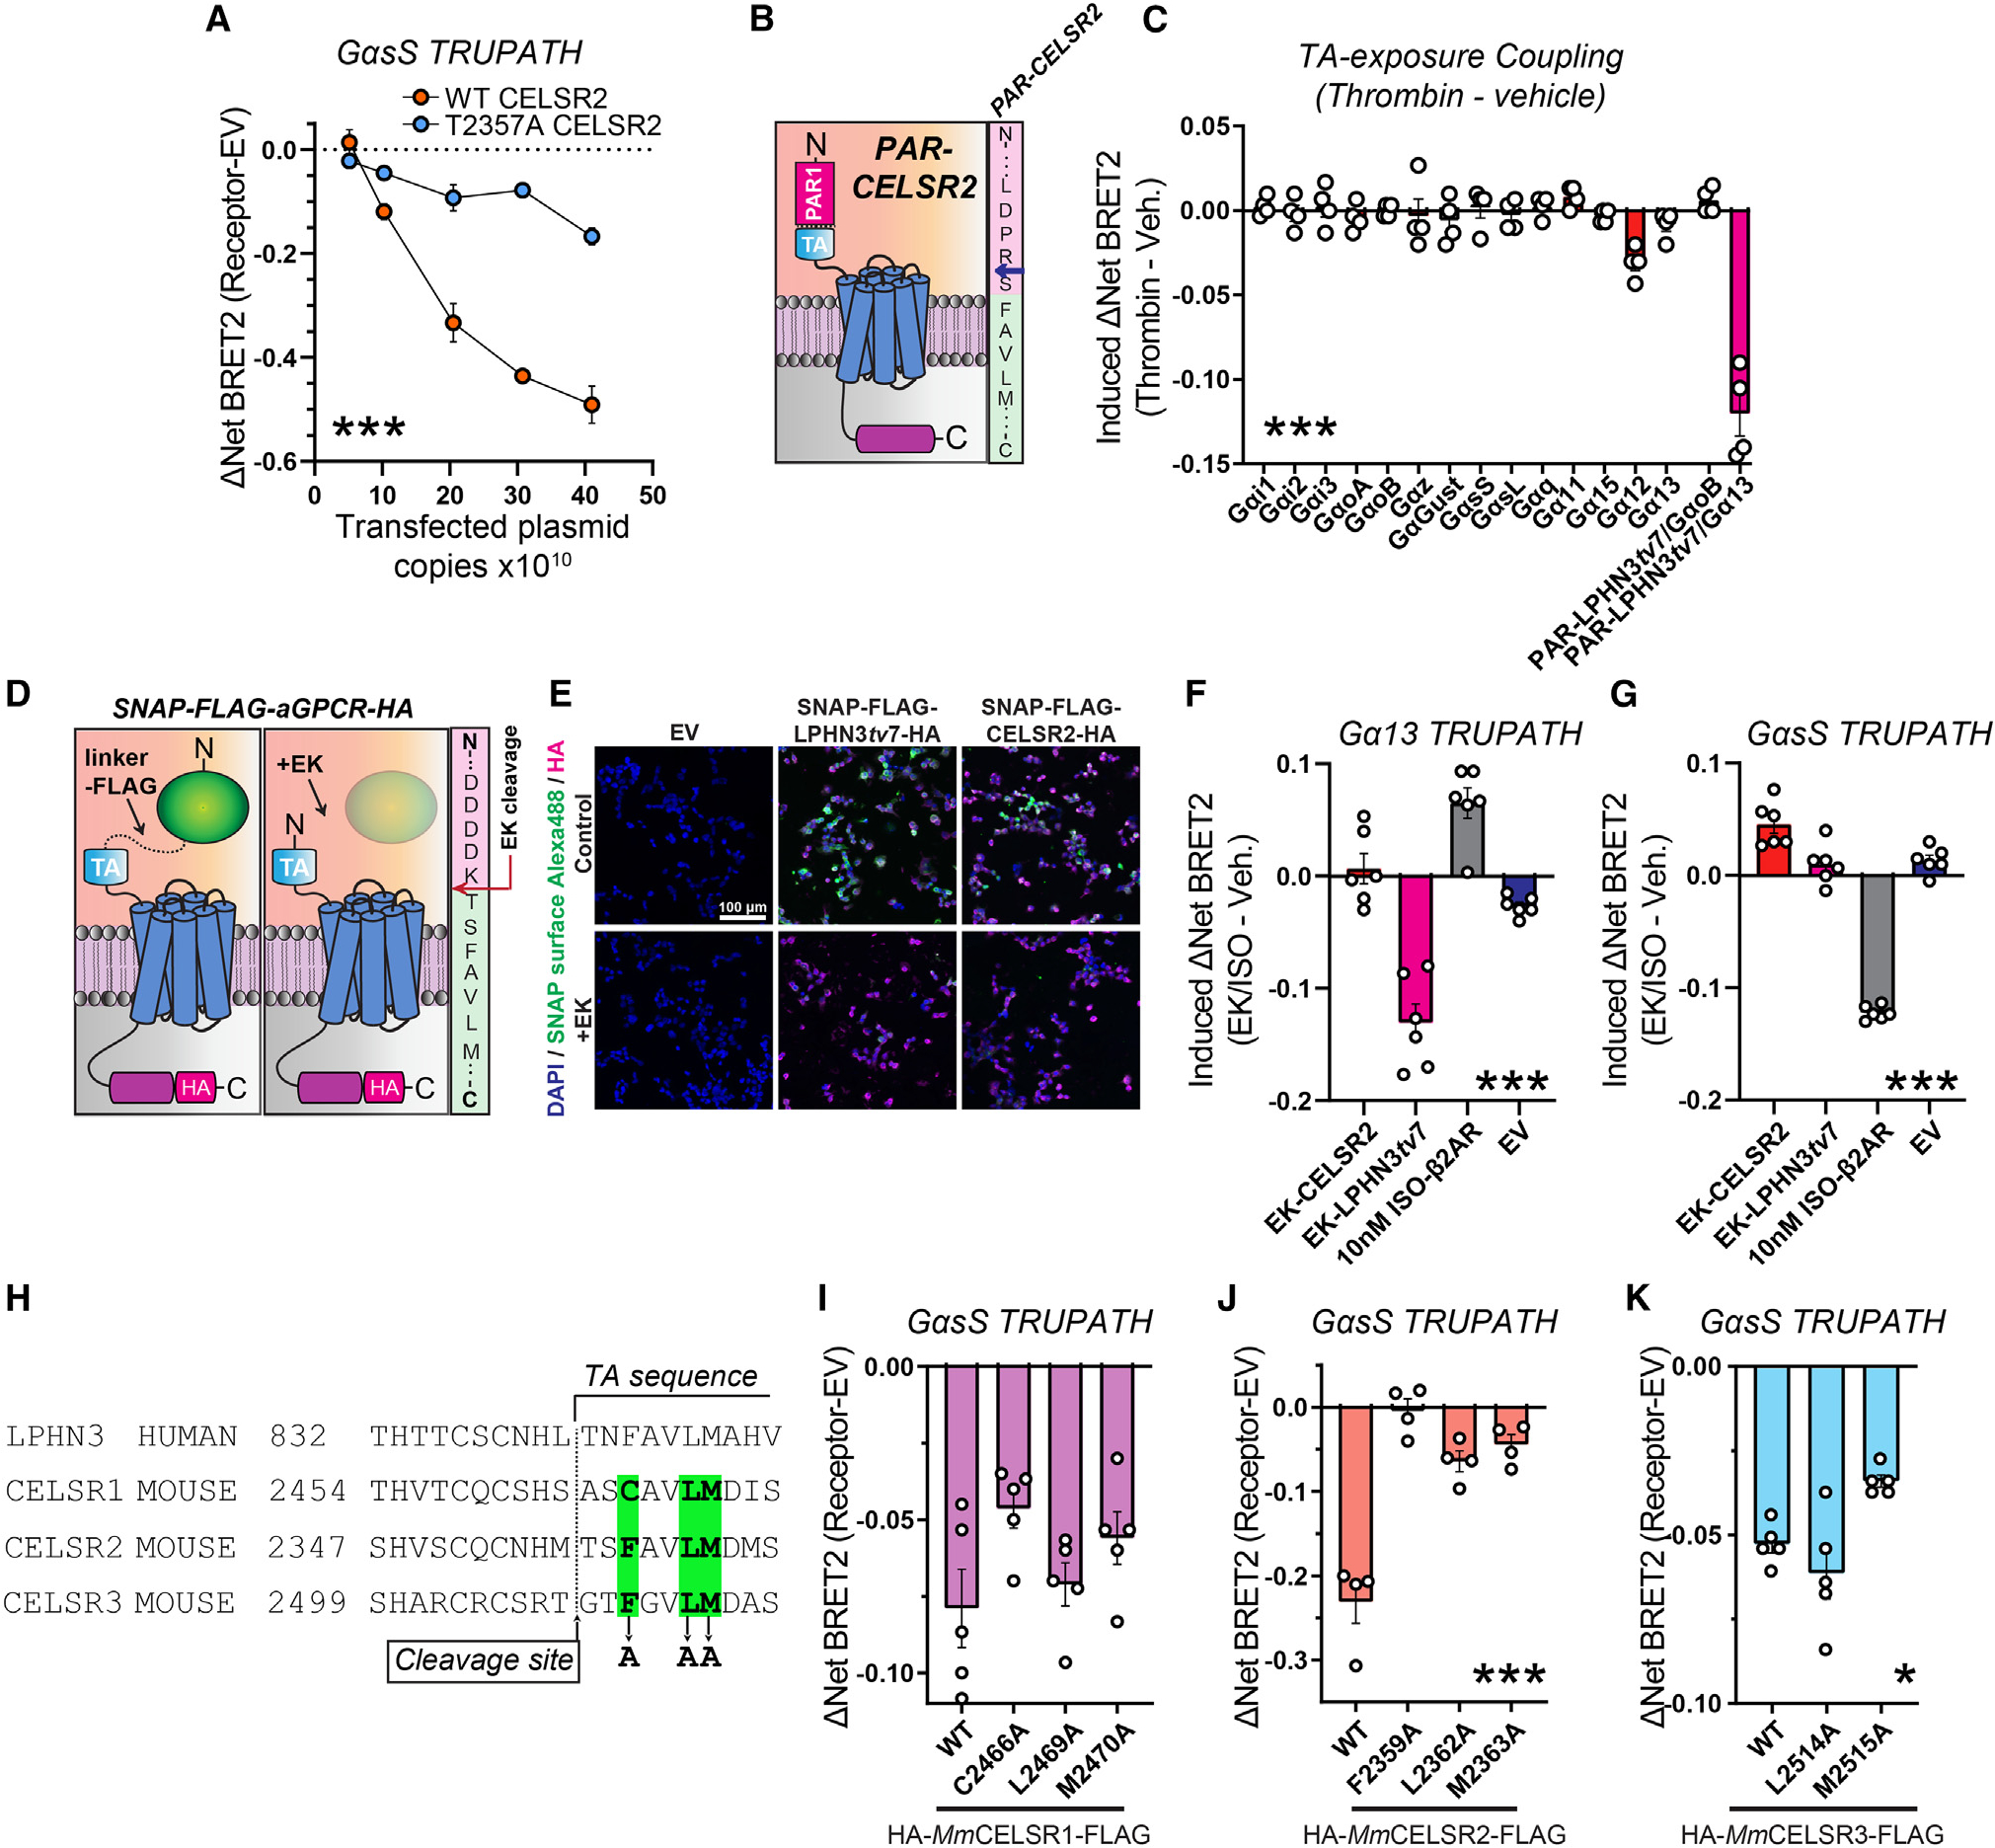
Adhesion G protein-coupled receptors (aGPCRs) are a large GPCR class that direct diverse fundamental biological processes. One prominent mechanism for aGPCR agonism involves autoproteolytic cleavage, which generates an activating, membrane-proximal tethered agonist (TA). How universal this mechanism is for all aGPCRs is unclear. Here, we investigate G protein induction principles of aGPCRs using mammalian latrophilin 3 (LPHN3) and cadherin EGF LAG-repeat 7-transmembrane receptors 1-3 (CELSR1-3), members of two aGPCR families conserved from invertebrates to vertebrates. LPHNs and CELSRs mediate fundamental aspects of brain development, yet CELSR signaling mechanisms are unknown. We find that CELSR1 and CELSR3 are cleavage deficient, while CELSR2 is efficiently cleaved. Despite differential autoproteolysis, CELSR1-3 all engage GαS, and CELSR1 or CELSR3 TA point mutants retain GαS coupling activity. CELSR2 autoproteolysis enhances GαS coupling, yet acute TA exposure alone is insufficient. These studies support that aGPCRs signal via multiple paradigms and provide insights into CELSR biological function.

Keywords: CP: Cell biology; adhesion GPCR; autoproteolysis; cell adhesion; signal transduction.


Conflict of interest statement

Declaration of interests The authors declare no competing interests.

Figures

Figure 1.
Figure 1.. Mm CELSR1–3 display distinct autoproteolytic cleavage profiles
(A) Diagram of full-length Mus musculus (Mm) CELSR1–3 depicting locations of N-terminal HA and C-terminal FLAG tags. The estimated molecular weight of the N-terminal fragment (NTF) and C-terminal fragment (CTF) that would result from cleavage is shown on the left. ECR, extracellular region; ICR, intracellular region; EGF, epidermal growth factor; HormR, hormone receptor domain; GAIN, G protein-coupled receptor autoproteolysis-inducing domain; SP, signal peptide; GPS, G protein-coupled receptor proteolysis site. (B) Multiple sequence alignment of the GAIN region of human, mouse, and C. elegans (CAEEL) CELSR (FMI-1) compared with human Lphn1–3 (Adgrl1–3). The autoproteolytic cleavage site is shown with an arrow on the bottom of the alignment, while the residue critical for autoproteolysis is depicted on the top of the alignment. (C) Surface expression and localization of full-length Mm CELSR1–3 in HEK293T cells. Cells were transfected with indicated full-length HA-tagged Mm CELSR constructs or empty vector and immunolabeled for surface HA in unpermeabilized conditions, followed by phalloidin (F-actin) and DAPI. (D) Total expression of full-length Mm CELSR1–3. Similar to (C) except that HEK293T cells were permeabilized and labeled for total HA together with phalloidin and DAPI. (E) Full-length Mm CELSR1–3 cleavage assays in HEK293T cells. Constructs contained N-terminal HA and C-terminal FLAG tags. Full-length Mm CELSR2 generates a cleaved C-terminal product at the expected size following autoproteolytic cleavage, while CELSR1/3 is uncleaved under similar conditions. Human LPHN3 was used as a positive control. Expected sizes (kDa): Mm CELSR1 full length (FL): 330, NTF: 267, and CTF: 63; Mm CELSR2 FL: 316, NTF: 254, and CTF: 62; Mm CELSR3 FL: 359, NTF: 271, and CTF: 87; Homo sapiens (hs) LPHN3 FL: 166, NTF: 96, and CTF: 70. Note that for the hs LPHN3 positive control, the FLAG tag was present on the NTF. The presence of two bands in hs LPHN3 is likely due to glycosylation (Araç et al.). See Figures S1 and S2 for additional full-length Mm CELSR1–3 autoproteolysis data.
Figure 2.
Figure 2.. T2357 is important for Mm CELSR2 autoproteolysis
(A) Representative images of surface expression levels of full-length Mm CELSR2 relative to CELSR2 point mutants (T2357A and T2357G). HEK293T cells were transfected with indicated full-length HA-Mm CELSR2-FLAG constructs (WT or indicated point mutants) or empty vector and immunolabeled for surface HA in unpermeabilized conditions, followed by phalloidin (F-actin) and DAPI (nuclei). (B) Total expression of indicated constructs. Similar to (A) except that HEK293T cells were permeabilized and labeled for total HA together with phalloidin and DAPI. (C) Quantification of HA surface intensity relative to phalloidin. Total cell fluorescence was measured for HA and phalloidin channels from three independent culture replicates. (D) Mm CELSR2 cleavage assays. HEK293T cells were transfected with the indicated HA-Mm CELSR2-FLAG constructs and subsequently immunoblotted for the C-terminal FLAG-tagged cleavage product. Numerical data are means ± SEM from 3 independent biological replicates (depicted as open circles). See Figure S3 for additional data regarding Mm CELSR2 autoproteolysis.
Figure 3.
Figure 3.. Validation of BRET2 approach to evaluate TA exposure-dependent and -independent aGPCR:G protein coupling
(A) Diagram of Mm LPHN1–3 (ADGRL1–3) domain organization. LPHNs exhibit a cleaved GAIN domain, which exposes a TA peptide. ECR, extracellular region; ICR, intracellular region; GAIN, G protein-coupled receptor autoproteolysis-inducing domain; SP, signal peptide; GPS, G protein-coupled receptor proteolysis site. (B) Model of experimental approach for acute TA exposure and subsequent BRET2 measurements of G protein coupling. Left, replacement of the LPHN3 ECD with PAR protects the TA from inducing TA-dependent G protein induction. Middle, thrombin-mediated cleavage and removal of PAR exposes the TA, resulting in TA-dependent activation generating a decrease in BRET2 ratio. Right, illustration of PAR-LPHN3 TA cleavage site. Thrombin cleaves PAR (pink sequence) following arginine (red arrow), exposing an N-terminal serine followed by the activating phenylalanine present in the LPHN3 TA sequence (light blue sequence). (C) Thrombin-mediated LPHN3 TA exposure induces Gα13 coupling using TRUPATH G protein sensors. Transfected cells were subjected to increasing concentrations of thrombin for 10 min followed by BRET2 measurements. (D) Schematic diagram of PAR-LPHN3tv5 (NCBI: NM_001347371.2). (E) Basal G protein coupling of PAR-LPHN3tv5 using the indicated set of TRUPATH BRET2 sensors. (F) PAR-LPHN3tv5 TA-exposure-dependent G protein coupling. (G) Schematic diagram of PAR-LPHN3tv7 (NCBI: NM_001359828.1). (H) Same as (E) except for PAR-LPHN3tv7. (I) Same as (F) except for PAR-LPHN3tv7. (J) Schematic diagram of PAR-LPHN3tv9 (NCBI: NM_001359830.1). LPHN3tv9 contains the same intracellular loop 3 as LPHN3tv7 but differs from LPHN3tv5 and LPHN3tv7 by exhibiting a distinct, shorter intracellular tail sequence. (K) Same as (E) except for PAR-LPHN3tv9. (L) Same as (F) except for PAR-LPHN3tv9. Numerical data are means ± SEM from four independent biological replicates (depicted as open circles in bar graphs). Statistical significance was assessed by two-way ANOVA (****p < 0.0001) in (C) and one-way ANOVA for remaining panels (**p < 0.01; ***p < 0.001). Asterisks depict ANOVA results. See Figure S4 for additional PAR-LPHN3 data.
Figure 4.
Figure 4.. Total and splice-site-specific Lphn3 spatial expression in the developing mouse hippocampus
(A) Representative images of the postnatal day 5, 10, and 21 mouse hippocampus labeled for RNA in situ probes for pan-Lphn3 transcripts together with a probe specific for the C-terminal tail sequence (Ct-Lphn3) that is present in Lphn3tv5 and Lphn3tv7 but not Lphn3tv9. (B) Representative high-magnification 60× images of in situ hybridizations in the hippocampal CA1 region at postnatal day 5, 10, and 21. Top, representative merged channel image; bottom, zoom in of white boxed area from the left with individual channels separated for pan-Lphn3 (green) and Ct-Lphn3 (red). (C) Quantifications of CA1 RNA in situ results. The total channel intensity of green (pan-Lphn3) or red (Ct-Lphn3) signal was compared with the area occupied by DAPI for each respective image. (D and E) Same as (B) and (C) except for the hippocampal CA3 region. (F and G) Same as (B) and (C) except for the hippocampal dentate gyrus (DG). Numerical data are means ± SEM from 3–4 independent biological replicates. See Figure S5 for additional Lphn3 RNA in situ quantifications.
Figure 5.
Figure 5.. Full-length Mm CELSR1–3 are capable of GαsS coupling
(A) BRET2 assays with full-length Mm CELSR1 and the complete panel of TRUPATH sensors in GKO HEK293 cells to test G protein coupling. Basal activity of PAR-LPHN3tv5 with Gαi1 or Gα13 was used as the control in all experiments. Data are from 5 independent biological replicates, as depicted by open circles in graphs. (B) Heatmap illustrating G protein coupling of full-length Mm CELSR1. (C) Copy-dependent full-length Mm CELSR1 coupling to GαsS. GKO HEK293 cells were transfected with increasing amounts of full-length Mm CELSR1 and BRET2 measurements conducted compared with cells transfected with the same total amount of empty vector. Data are from 3 independent biological replicates. (D) Full-length Mm CELSR2 G protein coupling via BRET2. Experiments were conducted as in (A) except for CELSR2. Data are from 4 independent biological replicates. (E) Heatmap illustrating G protein coupling of full-length Mm CELSR2. (F) Copy-dependent full-length Mm CELSR2 coupling to GαsS. Experiments were performed as in (C), and data are from 3 independent biological replicates. (G) Full-length Mm CELSR3 G protein coupling via BRET2. Experiments were conducted as in (A) except for CELSR3. Data are from 4 independent biological replicates. (H) Heatmap illustrating G protein coupling of full-length Mm CELSR3. (I) Copy-dependent full-length Mm CELSR3 coupling to GαsS. Experiments were performed as in (C), and data are from 3 independent biological replicates. Numerical data are means ± SEM from 3–5 independent biological replicates (depicted as open circles in bar graphs), as indicated in the figure legends. Statistical significance was assessed by one-way ANOVA (***p < 0.001). Asterisks depict one-way ANOVA results. See Figure S6 for additional CELSR BRET2 data.
Figure 6.
Figure 6.. Partially overlapping Celsr1–3 spatial expression during hippocampal circuit assembly
(A) Representative image of the postnatal day 5, 10, and 21 mouse hippocampus co-labeled with RNA in situ probes for Celsr1–3 and DAPI. (B) Representative high-magnification images of in situ hybridizations in the hippocampal CA1 region at postnatal days 5, 10, and 21. Top, representative merged channel image; bottom, zoom in highlighting the white boxed pyramidal cell layer area from the top with individual channels separated for Celsr1 (magenta), Celsr2 (red), and Celsr3 (green). (C) Quantifications of CA1 RNA in situ data. The total channel intensity of green (Celsr3), red (Celsr2), or far-red (Celsr1) signal was compared with the area occupied by DAPI for each respective image. (D) Same as (B) except for the hippocampal CA3 region at postnatal days 5, 10, and 21. (E) Quantifications of CA3-region RNA in situ data. Similar to (C) except for the hippocampal CA3 at postnatal days 5, 10, and 21. (F) Same as (B) except for the hippocampal DG at postnatal days 5, 10, and 21. (G) Quantifications of RNA in situ data from the DG. Similar to (C) except for the hippocampal DG at postnatal days 5, 10, and 21. (H and I) Double immunohistochemistry (IHC) and RNA in situ hybridizations for the neuronal marker NeuN together with Celsr2/3 RNA. (H) Representative postnatal day 21 hippocampus co-labeled for NeuN (IHC; green), Celsr2 (RNA in situ; red), Celsr3 (RNA in situ; magenta), and DAPI. (I) Representative high-magnification image of the postnatal day 21 hippocampal CA1, CA3, and DG from double IHC/RNA in situ experiments. Top, merged image depicting IHC for NeuN (green) together with RNA in situ hybridizations for Celsr2 (red), Celsr3 (magenta), and DAPI. Bottom, individual channel images for the center area of top highlighting Celsr2/3 distribution. Numerical data are means ± SEM from 3–4 independent biological replicates. See Figure S7 for additional Celsr1–3 spatial expression data.
Figure 7.
Figure 7.. CELSRs engage distinct GαsS induction mechanisms
(A) Plasmid dose-dependent WT CELSR2 and T2357A CELSR2 GαsS coupling. Experiments were conducted as in Figure 5, except full-length T2357A CELSR2 was analyzed in parallel to full-length WT CELSR2. (B) Left, schematic diagram for PAR-CELSR2. Right, illustration of PAR-CELSR2 cleavage site. Thrombin cleaves PAR (pink sequence) following arginine (blue arrow), exposing an N-terminal serine followed by the TA sequence (light green sequence). (C) G protein coupling following acute TA exposure in PAR-CELSR2 using the complete panel of TRUPATH sensors. BRET2 measurements were conducted for four independent biological replicates. TA-induced coupling of PAR-LPHN3tv7 with GαoB or with Gα13 were used as controls. (D) Strategy for acute exposure of a native tethered agonist., A SNAP tag-linker-FLAG sequence was fused immediately upstream the native tethered agonist sequence for LPHN3tv7 or CELSR2. Enterokinase cleaves immediately following DDDK/ in FLAG, exposing the native TA peptide. The sequence on the right shows fusion region for CELSR2. (E) Validation of surface expression and enterokinase-mediated cleavage of SNAP tags. HEK293T cells were transfected with indicated experimental or control (empty vector [EV]) plasmids in 24-well plates, treated with 32 U enterokinase vs. control, and labeled for cell-impermeable SNAP ligand conjugated to Alexa Fluor 488. Cells were subsequently fixed and immunolabeled for the C-terminal HA tag as an internal control. (F) Gα13 coupling of indicated conditions. Transfected cells plated into 96-well plates were treated with 5.5 U/well enterokinase (EK) or vehicle for 15 min, and BRET2 was subsequently measured. β2-AR treated with 10 nM ISO and EV treated with EK were used as a controls. Data are from 6 independent biological replicates. (G) GαsS coupling in indicated conditions. Same as (F) except the GαsS TRUPATH sensors were used. (H) Multiple sequence alignment of the GAIN region of human LPHN3 and mouse CELSR1–3. Putative residues for TA-mediated agonism of CELSR1–3, which were systematically mutated to alanine to examine their contribution to GαsS induction, are highlighted in green. (I) GαsS coupling in indicated full-length WT, C2466A, L2469A, and M2470A CELSR1 conditions. Data are from 5 independent biological replicates. (J) Same as (I) except for full-length WT, F2359A, L2362A, and M2363A CELSR2. Data are from 4 independent biological replicates. (K) Same as (I) except for full-length WT, L2514A, and M2515A CELSR3. Data are from 5 independent biological replicates. Numerical data are means ± SEM from 3–6 independent biological replicates (depicted as open circles in bar graphs), as indicated in the figure legends. Statistical significance was assessed by two-way ANOVA (A) or one-way ANOVA (*p < 0.05; ***p < 0.001). Asterisks depict ANOVA results. See Figure S8 for additional data regarding Mm CELSR2 G protein/β-arrestin coupling and Figure S9 for surface expression and autoproteolysis assays for conditions in (H)–(K).

Update of

References

    1. Roth BL, Irwin JJ, and Shoichet BK (2017). Discovery of new GPCR ligands to illuminate new biology. Nat. Chem. Biol. 13, 1143–1151. - PMC - PubMed
    1. Folts CJ, Giera S, Li T, and Piao X (2019). Adhesion G Protein-Coupled receptors as drug targets for neurological diseases. Trends Pharmacol. Sci. 40, 278–293. - PMC - PubMed
    1. Morgan RK, Anderson GR, Araç D, Aust G, Balenga N, Boucard A, Bridges JP, Engel FB, Formstone CJ, Glitsch MD, et al. (2019). The expanding functional roles and signaling mechanisms of adhesion G protein-coupled receptors. Ann. N. Y. Acad. Sci. 1456, 5–25. - PMC - PubMed
    1. Paavola KJ, and Hall RA (2012). Adhesion G protein-coupled receptors: signaling, pharmacology, and mechanisms of activation. Mol. Pharmacol. 82, 777–783. - PMC - PubMed
    1. Liebscher I, Ackley B, Araç D, Ariestanti DM, Aust G, Bae BI, Bista BR, Bridges JP, Duman JG, Engel FB, et al. (2014). New functions and signaling mechanisms for the class of adhesion G protein-coupled receptors. Ann. N. Y. Acad. Sci. 1333, 43–64. - PMC - PubMed

Publication types

LinkOut - more resources