. 2023 May 24;9(21):eade7692.
doi: 10.1126/sciadv.ade7692. Epub 2023 May 26.

Multiomic signals associated with maternal epidemiological factors contributing to preterm birth in low- and middle-income countries

Affiliations

Multiomic signals associated with maternal epidemiological factors contributing to preterm birth in low- and middle-income countries

Camilo A Espinosa et al. Sci Adv. .

Abstract

Preterm birth (PTB) is the leading cause of death in children under five, yet comprehensive studies are hindered by its multiple complex etiologies. Epidemiological associations between PTB and maternal characteristics have been previously described. This work used multiomic profiling and multivariate modeling to investigate the biological signatures of these characteristics. Maternal covariates were collected during pregnancy from 13,841 pregnant women across five sites. Plasma samples from 231 participants were analyzed to generate proteomic, metabolomic, and lipidomic datasets. Machine learning models showed robust performance for the prediction of PTB (AUROC = 0.70), time-to-delivery (r = 0.65), maternal age (r = 0.59), gravidity (r = 0.56), and BMI (r = 0.81). Time-to-delivery biological correlates included fetal-associated proteins (e.g., ALPP, AFP, and PGF) and immune proteins (e.g., PD-L1, CCL28, and LIFR). Maternal age negatively correlated with collagen COL9A1, gravidity with endothelial NOS and inflammatory chemokine CXCL13, and BMI with leptin and structural protein FABP4. These results provide an integrated view of epidemiological factors associated with PTB and identify biological signatures of clinical covariates affecting this disease.


Figures

Fig. 1.
Fig. 1.. Study overview.
(A) Maternal clinical data and plasma samples were collected from a cohort of 13,841 pregnant women across five sites in four low- and middle-income countries (LMICs). Plasma samples taken during early and mid pregnancy from a subcohort of 231 of these women were further analyzed to generate targeted lipidomic, untargeted metabolomic, and targeted proteomic datasets. Clinical data from the full cohort were used for the prediction of preterm birth (PTB). Multiomic profiling data from the multiomics subcohort were used for interomic correlation analysis and for the prediction of maternal clinical covariates. Clinical data from the full cohort and multiomic data from the multiomics subcohort were used for the epidemiological multiomic integration. (B) Raster plot depicting the gestational age (GA) at sampling for each woman in the multiomics subcohort stratified by site of origin, where each line represents an individual woman and the dark blue circles and light blue circles represent sampling dates and delivery dates, respectively. The dashed red line at 37 weeks of GA indicates the boundary between preterm (PTB) and term births.
Fig. 2.
Fig. 2.. Multiomic characterization of early and mid pregnancy.
Plasma samples taken during early and mid pregnancy from a subcohort of 231 women were analyzed to generate targeted lipidomic, untargeted metabolomic, and targeted proteomic datasets. (A) Quantification of the number of measurements (features) of each different omic analyzed. (B) Estimation of the modularity—i.e., the degree of internal correlation between features in a given omic dataset—using the number of principal components needed to explain 90% of the variance. (C) A two-dimensional representation of the multiomic correlation space was generated by first calculating the correlation matrix of the feature space and then using the UMAP dimensionality reduction algorithm for visualization, where green, purple, and brown circles represent lipidomic, metabolomic, and proteomic features, respectively. (D and E) Interomic and intraomic Spearman correlations were quantified and assessed for significance using a cutoff value of Bonferroni-adjusted Spearman P < 0.05, which corresponded to an absolute Spearman Rho > 0.38. (D) Distribution of all correlations by absolute strength of association for the multiomic dataset (dark blue) and a random dataset (light blue), where each simulated feature was generated through bootstrapping of the true feature distribution. (E) Visualization of significant interomic correlations. Left: Chord diagram showing the relative distribution of significant interomic correlations, where the outer ring depicts each individual omic and links correspond to interomic correlations, with colors assigned as shown in the legend. The size of the links is proportional to the total number of significant interactions normalized to the total number of possible correlations between each omic pair. Right: Quantification of the number of significant weak (0.38 to 0.6), moderate (0.6 to 0.8), and strong (0.8 to 1.0) absolute correlations between each omic pair.
Fig. 3.
Fig. 3.. An epidemiological model for the prediction of PTB.
A cross-validated gradient-boosted tree (XGBoost) model for the prediction of PTB was trained on the epidemiological data of the full cohort of 13,841 pregnant women. (A) Distribution of the cross-validated preterm risk scores—the probability PTB assigned by the epidemiological model to each participant—stratified by PTB status (P = 6.1 × 10−147, N = 13,841). (B) Receiver operating characteristic (ROC) curve for the epidemiological model [area under the ROC curve (AUROC) = 0.70, 95% CI: 0.69 to 0.71]. (C) Precision-recall curve (PRC) for the epidemiological model [area under the PRC (AUPRC) = 0.27, 95% CI: 0.25 to 0.29]. (D) Correlation network of the maternal and fetal covariates collected during the study, where nodes are grouped by clinical categories and were arranged into a two-dimensional layout using a minimum spanning tree. Each node represents a different covariate, where the color of the node represents the strength of the univariate association of the covariate with PTB and the size of the node represents the predictability of the covariate using multiomic data from the multiomics subcohort. Edges were drawn between significantly associated covariates after adjusting for multiple hypothesis testing, and edge thickness represents the strength of the Spearman correlation between the two covariates. (E) A cross-validated XGBoost model was built for the prediction of PTB on the full cohort of women using only the covariates from each of the clinical categories used, and the performance of each model was visualized using an ROC curve. See the Supplementary Materials for more details on the clinical covariates included in each category. The gray shadows in the ROC curve and PRC plots represent the 95% CI of the respective curves.
Fig. 4.
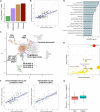
Fig. 4.. Multiomic modeling of the maternal proteome, metabolome, and lipidome predicts time-to-delivery.
A cross-validated gradient-boosted tree (XGBoost) model for the prediction of time from sampling to delivery was trained on each individual omic as well as the combined multiomic dataset. (A) Comparison of the cross-validated performance of each model for the prediction of time-to-delivery. (B) Time-to-delivery predictions of the combined multiomic model (Pearson’s r = 0.65, 95% CI: 0.57 to 0.72, P = 2.6 × 10⁻²⁸, RMSE = 3.7 weeks, MAE = 3.0 weeks, N = 226). (C) Two-dimensional UMAP visualization of the multiomic features significantly correlated with time-to-delivery. Each circle represents a feature, with sizes proportional to Spearman correlation with time-to-delivery, and colors representing modality. (D) Gene Ontology (GO) overrepresentation analysis performed on the plasma proteomic features significantly correlated with time-to-delivery as assessed using Fisher’s exact test. (E) Metabolic pathway enrichment analysis performed on the metabolomic features significantly correlated with time-to-delivery. (F) Participants were randomly split into a training set (N = 159, 70%) and a test set (N = 67, 30%) to build a minimal XGBoost model for the prediction of time-to-delivery. Left: Cross-validated model predictions in the training set (Pearson’s r = 0.64, 95% CI: 0.54 to 0.73, P = 7.4 × 10⁻²⁰, RMSE = 3.9 weeks, MAE = 3.1 weeks, N = 159). Right: Model predictions in the test set (Pearson’s r = 0.68, 95% CI: 0.53 to 0.79, P = 1.7 × 10⁻¹⁰, RMSE = 3.4 weeks, MAE = 2.8 weeks, N = 67). (G) A cross-validated XGBoost model for the prediction of GA at sampling was trained on the combined multiomic dataset. Boxplot depicts the discrepancy between predicted GA and ultrasound GA stratified by PTB status. The blue lines and blue shadows in scatterplots represent the regression line and 95% CI of the predicted values versus the ground truth.
Fig. 5.
Fig. 5.. CXCL13 and eNOS are age-independent markers of pregnancy memory.
Cross-validated gradient-boosted tree (XGBoost) models for the prediction of maternal age and gravidity were trained on each individual omic as well as the combined multiomic dataset. (A) Comparison of the cross-validated performance of each model for the prediction of maternal age and gravidity. (B) Left: Maternal age predictions of the combined multiomic model (Pearson’s r = 0.59, 95% CI: 0.50 to 0.67, P = 9.0 × 10⁻²³, RMSE = 5.0 years, MAE = 3.8, N = 229). Right: Gravidity predictions of the combined multiomic model (Pearson’s r = 0.56, 95% CI: 0.47 to 0.64, P = 1.1 × 10⁻²⁰, RMSE = 2.0, MAE = 1.5, N = 231). The blue line and blue shadow represent the regression line and 95% CI of the predicted values versus the ground truth. (C) Example features significantly associated with maternal age, gravidity, or both. (D) Tile chart depicting the strength of the association between the top features significantly correlated with maternal age and gravidity, where a darker color depicts a stronger association. (E) CXCL13 (left) and eNOS (right) levels in maternal plasma in early and mid pregnancy stratified by gravidity. (F) Validation of findings in plasma proteome in an independent set of early pregnancy samples in the AMANHI and GAPPS biorepositories (N = 70). CXCL13 (left) and eNOS (right) levels in early pregnancy stratified by nulliparity. (G) Validation of findings in plasma proteome in an independent cohort from Lucile Packard Children’s Hospital at Stanford (N = 17). CXCL13 levels in early pregnancy stratified by nulliparity.
Fig. 6.
Fig. 6.. Predictive modeling of the maternal BMI.
A cross-validated gradient-boosted tree (XGBoost) model for the prediction of maternal BMI was trained on each individual omic as well as the combined multiomic dataset. (A) Comparison of the cross-validated performance of each model for the prediction of maternal BMI. (B) Maternal BMI predictions of the combined multiomic model (Pearson’s r = 0.81, 95% CI: 0.76 to 0.85, P = 8.7 × 10−54, RMSE = 3.3, MAE = 2.5, N = 226). The blue line and blue shadow represent the regression line and 95% CI of the predicted values versus the ground truth. (C) Two-dimensional UMAP visualization of the multiomic features significantly correlated with maternal BMI. Each circle represents a feature, with sizes proportional to Spearman correlation with maternal BMI, and colors representing modality. (D) GO overrepresentation analysis performed on the plasma proteomic features significantly correlated with maternal BMI as assessed using Fisher’s exact test. (E) Metabolic pathway enrichment analysis performed on the metabolomic features significantly correlated with maternal BMI.

References

    1. Chawanpaiboon S., Vogel J. P., Moller A.-B., Lumbiganon P., Petzold M., Hogan D., Landoulsi S., Jampathong N., Kongwattanakul K., Laopaiboon M., Lewis C., Rattanakanokchai S., Teng D. N., Thinkhamrop J., Watananirun K., Zhang J., Zhou W., Gülmezoglu A. M., Global, regional, and national estimates of levels of preterm birth in 2014: A systematic review and modelling analysis. Lancet Glob. Health 7, e37–e46 (2019). - PMC - PubMed
    1. Saigal S., Doyle L. W., An overview of mortality and sequelae of preterm birth from infancy to adulthood. Lancet 371, 261–269 (2008). - PubMed
    1. Vogel J. P., Chawanpaiboon S., Moller A.-B., Watananirun K., Bonet M., Lumbiganon P., The global epidemiology of preterm birth. Best Pract. Res. Clin. Obstet. Gynaecol. 52, 3–12 (2018). - PubMed
    1. Espinosa C., Becker M., Marić I., Wong R. J., Shaw G. M., Gaudilliere B., Aghaeepour N., Stevenson D. K.; Prematurity Research Center at Stanford , Data-driven modeling of pregnancy-related complications. Trends Mol. Med. 27, 762–776 (2021). - PMC - PubMed
    1. Peterson L. S., Stelzer I. A., Tsai A. S., Ghaemi M. S., Han X., Ando K., Winn V. D., Martinez N. R., Contrepois K., Moufarrej M. N., Quake S., Relman D. A., Snyder M. P., Shaw G. M., Stevenson D. K., Wong R. J., Arck P., Angst M. S., Aghaeepour N., Gaudilliere B., Multiomic immune clockworks of pregnancy. Semin. Immunopathol. 42, 397–412 (2020). - PMC - PubMed