. 2023 Jul 1;325(1):E46-E61.
doi: 10.1152/ajpendo.00263.2022. Epub 2023 May 24.

O-linked N-acetylglucosamine modification is essential for physiological adipose expansion induced by high-fat feeding

Affiliations

O-linked N-acetylglucosamine modification is essential for physiological adipose expansion induced by high-fat feeding

Akiko Nakamoto et al. Am J Physiol Endocrinol Metab. .

Abstract

Adipose tissues accumulate excess energy as fat and heavily influence metabolic homeostasis. O-linked N-acetylglucosamine (O-GlcNAc) modification (O-GlcNAcylation), which involves the addition of N-acetylglucosamine to proteins by O-GlcNAc transferase (Ogt), modulates multiple cellular processes. However, little is known about the role of O-GlcNAcylation in adipose tissues during body weight gain due to overnutrition. Here, we report on O-GlcNAcylation in mice with high-fat diet (HFD)-induced obesity. Mice with knockout of Ogt in adipose tissue achieved using adiponectin promoter-driven Cre recombinase (Ogt-FKO) gained less body weight than control mice under HFD. Surprisingly, Ogt-FKO mice exhibited glucose intolerance and insulin resistance, despite their reduced body weight gain, as well as decreased expression of de novo lipogenesis genes and increased expression of inflammatory genes, resulting in fibrosis at 24 weeks of age. Primary cultured adipocytes derived from Ogt-FKO mice showed decreased lipid accumulation. Both primary cultured adipocytes and 3T3-L1 adipocytes treated with OGT inhibitor showed increased secretion of free fatty acids. Medium derived from these adipocytes stimulated inflammatory genes in RAW 264.7 macrophages, suggesting that cell-to-cell communication via free fatty acids might be a cause of adipose inflammation in Ogt-FKO mice. In conclusion, O-GlcNAcylation is important for healthy adipose expansion in mice. Glucose flux into adipose tissues may be a signal to store excess energy as fat.NEW & NOTEWORTHY We evaluated the role of O-GlcNAcylation in adipose tissue in diet-induced obesity using adipose tissue-specific Ogt knockout mice. We found that O-GlcNAcylation in adipose tissue is essential for healthy fat expansion and that Ogt-FKO mice exhibit severe fibrosis upon long-term overnutrition. O-GlcNAcylation in adipose tissue may regulate de novo lipogenesis and free fatty acid efflux to the degree of overnutrition. We believe that these results provide new insights into adipose tissue physiology and obesity research.

Keywords: O-GlcNAcylation; adipose inflammation; insulin resistance; leptin; obesity.


Conflict of interest statement

No conflicts of interest, financial or otherwise, are declared by the authors.

Figures

None
Graphical abstract
Figure 1.
Figure 1.
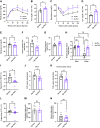
O-linked N-acetylglucosamine (O-GlcNAc) transferase knockout (Ogt-FKO) mice gained less body weight and fat mass than control mice under a high-fat diet (HFD). Mice were fed a HFD for 4, 8, or 16 wk starting at 8 wk of age. A: schematic diagram of Ogt-FKO mouse generation. B: body weights of Ogt-FKO and control mice (Ogt-FKO: n = 5; Ogt-flox: n = 6). RD, regular chow diet. C: representative Western blot analysis of OGT and O-GlcNAcylation (RL2 antibody) in epididymal white adipose tissue (eWAT) and inguinal white adipose tissue (iWAT) at 12 weeks of age. D: representative images of eWAT from Ogt-FKO and Ogt-flox mice at 24 wk of age. E: weights of eWAT and iWAT from Ogt-FKO and control mice (n = 6 each). F: body composition of Ogt-FKO and control mice (n = 10 each). G: daily food intake of Ogt-FKO and control mice at 12 wk (n = 5 each) and 16 wk of age (Ogt-FKO: n = 8; Ogt-flox: n = 6); w.o., weeks old. H: energy expenditure over a 24-h period of Ogt-FKO and control mice (n = 10 each). The bar graph depicts energy expenditure (EE) in each group. I: respiratory exchange ratio (RER) over a 24-h period of Ogt-FKO and control mice (n = 10 each). Data are expressed as means ± SE; *P < 0.05, **P < 0.01, ***P < 0.001; ns, not statistically significant.
Figure 2.
Figure 2.
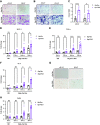
Glucose intolerance and insulin resistance in O-linked N-acetylglucosamine (O-GlcNAc) transferase knockout (Ogt-FKO) mice under high-fat diet (HFD). A and B: glucose changes during intraperitoneal glucose tolerance tests (IPGTTs) and the area under the curve (AUC) of IPGTTs of Ogt-FKO and Ogt-flox control mice (n = 5 each) after 8 wk of HFD. C and D: glucose changes during intraperitoneal insulin tolerance tests (IPITTs) and the AUC of IPITTs of Ogt-FKO and control mice (n = 5 each). EL: blood glucose (E), glucose infusion rate (F), glucose turnover (G), hepatic glucose output (H), suppression of hepatic glucose output (HGO; I), 2-deoxy-[1-14C]glucose (2-DG) uptake in epididymal white adipose tissue (eWAT) (J), 2-DG uptake in gastrocnemius muscle (K), and suppression of free fatty acids (FFA; L) measured during hyperinsulinemic-euglycemic clamp studies after 5 wk of HFD (Ogt-FKO: n = 10; Ogt-flox: n = 8). M: intrahepatic triglyceride (n = 4 each). N: intramuscular triglyceride (n = 10 each). Data are expressed as means ± SE; *P < 0.05, **P < 0.01; ns, not statistically significant.
Figure 3.
Figure 3.
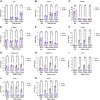
Severe fibrosis and inflammation in adipose tissues of O-linked N-acetylglucosamine (O-GlcNAc) transferase knockout (Ogt-FKO) and Ogt-flox control mice under high-fat diet (HFD). Mice were fed a HFD for 4, 8, or 16 wk, starting at 8 wk of age. A and B: staining with hematoxylin and eosin (A) and Masson trichrome (B) of Ogt-FKO and control mice at 24 wk of age. C: quantitative PCR (qPCR) analysis of Cola1 expression in epididymal white adipose tissue (eWAT) and inguinal white adipose tissue (iWAT) at 24 wk (n = 5 each). DF and H: time course of qPCR analysis of the indicated genes in iWAT at 8 wk (Ogt-FKO: n = 4; control: n = 5), 12 wk (n = 5 each), 16 wk (n = 8 each), and 24 wk (n = 6 each) of age. MCP-1, monocyte chemoattractant protein-1; RD, regular chow diet; w.o., weeks old. G: F4/80 staining of Ogt-FKO control mice at 16 wk of age/8 wk of HFD. Data are expressed as means ± SE; *P < 0.05, **P < 0.01, ***P < 0.001; ns, not statistically significant.
Figure 4.
Figure 4.
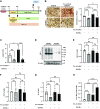
Expression profile of genes related to adipogenesis, adipokines, and de novo lipogenesis in inguinal white adipose tissue (iWAT) tissue under high-fat diet (HFD). Mice were fed a HFD for 4, 8, or 16 wk, starting at 8 wk of age. AK: quantitative PCR (qPCR) analysis of expression of the indicated genes in iWAT at 8 wk [O-linked N-acetylglucosamine (O-GlcNAc) transferase knockout (Ogt-FKO): n = 4; Ogt-flox: n = 5], 12 wk (n = 5 each), 16 wk (n = 8 each), and 24 wk (n = 6 each) of age. Data are expressed as means ± SE; **P < 0.01, ***P < 0.001; ns, not statistically significant. RD, regular chow diet; LPL, lipoprotein lipase; PPARγ, peroxisome proliferator-activated receptor-γ; C/EBP, CCAAT/enhancer binding protein; SCD, stearoyl-coenzyme A desaturase; SREBP-1c. sterol response element binding protein-1c; w.o., weeks old.
Figure 5.
Figure 5.
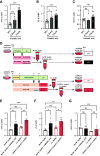
Pharmacological inhibition of O-linked N-acetylglucosamine (O-GlcNAc) modification (O-GlcNAcylation) in primary adipocytes decreased expression of adipokine genes and increased expression of inflammation-related genes. A: schematic of process by which SV cell fractions were isolated from inguinal white adipose tissue (iWAT) and differentiated to white adipocytes. B: Western blot analysis of O-GlcNAcylation (RL2 antibody) in primary adipocytes, with or without OSMI-1 treatment (12.5, 25, 50 μM) for 48 h. CI: quantitative PCR (qPCR) analysis of de novo lipogenesis gene, leptin, adiponectin, and inflammation-related gene expression in primary adipocytes, with or without OSMI-1 treatment (n = 4 each). Data are expressed as means ± SE; *P < 0.05, **P < 0.01, ***P < 0.001; ns, not statistically significant. DMSO, dimethyl sulfoxide; SREBP-1c. sterol response element binding protein-1c; MCP-1, monocyte chemoattractant protein-1.
Figure 6.
Figure 6.
Expression profile of genes related to adipogenesis, adipokines, and de novo lipogenesis in the primary adipocytes derived from O-linked N-acetylglucosamine (O-GlcNAc) transferase knockout (Ogt-FKO) mice. A: primary adipocyte differentiation observed by phase contrast microscopy. B: oil red O staining of primary adipocytes. CE: quantitative PCR (qPCR) analysis of de novo lipogenesis gene expression in primary adipocytes (n = 3 each). F and G: qPCR analysis of leptin and adiponectin expression in primary adipocytes (n = 3 each). H and I: qPCR analysis of lipid uptake genes expression in primary adipocytes (n = 3 each). JL: qPCR analysis of genes related to adipogenesis in primary adipocytes (n = 3 each). Data are expressed as means ± SE; *P < 0.05, **P < 0.01, ***P < 0.001; ns, not statistically significant. LPL, lipoprotein lipase; PPARγ, peroxisome proliferator-activated receptor-γ; C/EBP, CCAAT/enhancer binding protein; SCD, stearoyl-coenzyme A desaturase; SREBP-1c. sterol response element binding protein-1c.
Figure 7.
Figure 7.
Inhibition of O-linked N-acetylglucosamine (O-GlcNAc) modification (O-GlcNAcylation) in FA-treated 3T3-L1 adipocytes increased release of free fatty acids. A: schematic of process by which 3T3-L1 cells were differentiated to adipocytes. Oleic acid (250 μM) was added for fatty acid (FA) enrichment. B: oil red O staining of 3T3-L1 adipocytes, with or without FA-enriched medium and OSMI-1 treatment. The bar graph depicts quantification of the stained lipid droplets in each group. Quantification was performed using the eluted oil red O stain via measurement of absorbance at 492 nm. C and EG: quantitative PCR (qPCR) analysis of expression of the indicated genes in 3T3-L1 adipocytes, with or without FA-enriched medium and OSMI-1 treatment (n = 3 each). MCP-1, monocyte chemoattractant protein-1. D: Western blot analysis of O-GlcNAcylation (RL2 antibody) in 3T3-L1 adipocytes, with or without OSMI-1 treatment (50 μM, 24 h). H: FFA concentration in the medium with or without FA-enriched medium and OSMI-1 treatment (n = 3 each). Data are expressed as means ± SE; *P < 0.05, ***P < 0.001; ns, not statistically significant. DMSO, dimethyl sulfoxide.
Figure 8.
Figure 8.
Induction of inflammatory changes in RAW 264.7 macrophages with soluble factors in 3T3-L1 conditioned medium. AC: quantitative PCR (qPCR) analysis of RAW 264.7 cells treated with palmitic acid (0.25 and 0.5 mM for 24 h; n = 8 each). MCP-1, monocyte chemoattractant protein-1. D: process by which RAW 264.7 cells were treated with conditioned medium prepared from 3T3-L1 adipocytes cultured in fatty acid (FA)-enriched media; OA, oleic acid. EG: qPCR analysis of expression of the indicated genes in RAW 264.7 cells treated with conditioned medium (n = 4 each). ). MCP-1, monocyte chemoattractant protein-1. Data are expressed as means ± SE; *P < 0.05, **P < 0.01, ***P < 0.001; ns, not statistically significant. BSA, bovine serum albumin.
Figure 9.
Figure 9.
Acute leptin supplementation improves glucose homeostasis in O-linked N-acetylglucosamine (O-GlcNAc) transferase knockout (Ogt-FKO) mice. A: daily food intake of Ogt-FKO and control mice during either saline or leptin subcutaneous supplementation for 14 days after 8 weeks of high-fat diet (HFD) (Ogt-FKO: n = 8; Ogt-flox: n = 6). BG: acute leptin supplementation; mice received a bolus intraperitoneal injection of leptin (80 μg/kg) before intraperitoneal glucose tolerance tests (IPGTTs) or intraperitoneal insulin tolerance tests (IPITTs). B and C: blood glucose level changes (B) and area under the curve (AUC) (C) during IPGTTs (n = 4 each). D and E: blood glucose level changes (D) and AUC (E) during IPITTs (n = 4 each). F and G: plasma leptin concentration changes during IPGTTs (F) or IPITTs (G) after leptin injection (0, 30, and 120 minutes). Data are expressed as means ± SE; *P < 0.05, **P < 0.01; ns, not statistically significant.

References

    1. Schweiger M, Schreiber R, Haemmerle G, Lass A, Fledelius C, Jacobsen P, Tornqvist H, Zechner R, Zimmermann R. Adipose triglyceride lipase and hormone-sensitive lipase are the major enzymes in adipose tissue triacylglycerol catabolism. J Biol Chem 281: 40236–40241, 2006. doi:10.1074/jbc.M608048200. - DOI - PubMed
    1. Merkel M, Eckel RH, Goldberg IJ. Lipoprotein lipase: genetics, lipid uptake, and regulation. J Lipid Res 43: 1997–2006, 2002. doi:10.1194/jlr.r200015-jlr200. - DOI - PubMed
    1. Ferré P, Foufelle F. Hepatic steatosis: a role for de novo lipogenesis and the transcription factor SREBP-1c. Diabetes Obes Metab 12, Suppl 2: 83–92, 2010. doi:10.1111/j.1463-1326.2010.01275.x. - DOI - PubMed
    1. Virtanen KA, Lönnroth P, Parkkola R, Peltoniemi P, Asola M, Viljanen T, Tolvanen T, Knuuti J, Rönnemaa T, Huupponen R, Nuutila P. Glucose uptake and perfusion in subcutaneous and visceral adipose tissue during insulin stimulation in nonobese and obese humans. J Clin Endocrinol Metab 87: 3902–3910, 2002. doi:10.1210/jcem.87.8.8761. - DOI - PubMed
    1. Strawford A, Antelo F, Christiansen M, Hellerstein MK. Adipose tissue triglyceride turnover, de novo lipogenesis, and cell proliferation in humans measured with 2H2O. Am J Physiol Endocrinol Metab 286: E577–E588, 2004. doi:10.1152/ajpendo.00093.2003. - DOI - PubMed

Publication types

Substances

LinkOut - more resources