. 2023 Jul 7;51(12):e67.
doi: 10.1093/nar/gkad373.

Deep integrative models for large-scale human genomics

Collaborators, Affiliations

Deep integrative models for large-scale human genomics

Arnór I Sigurdsson et al. Nucleic Acids Res. .

Abstract

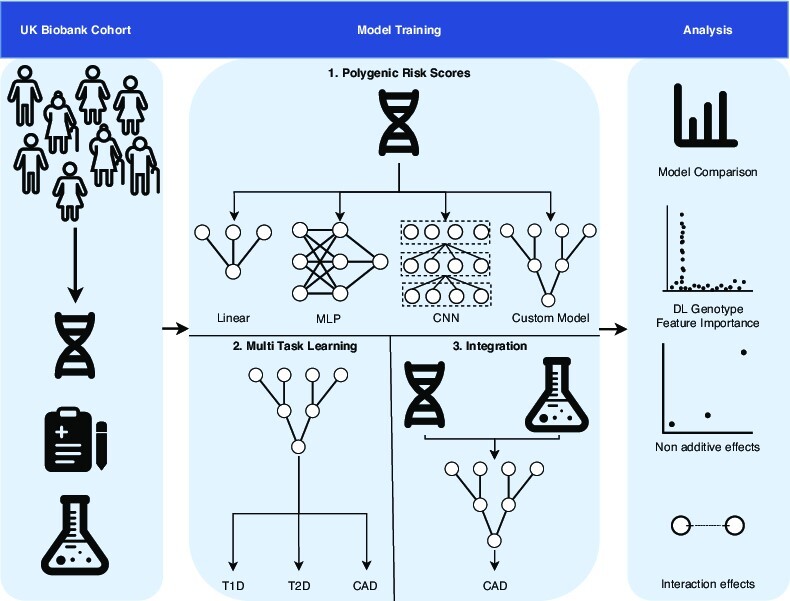
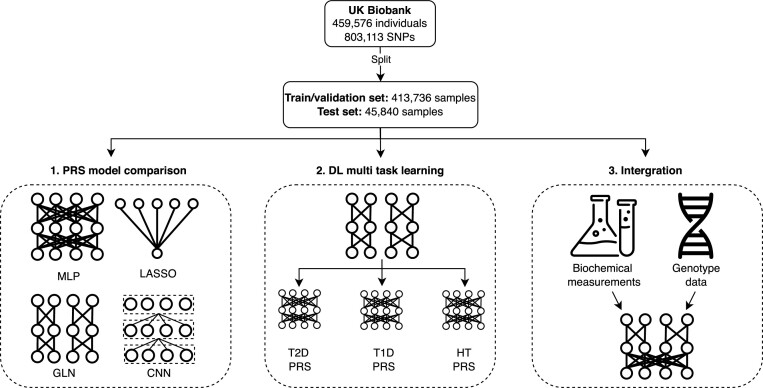
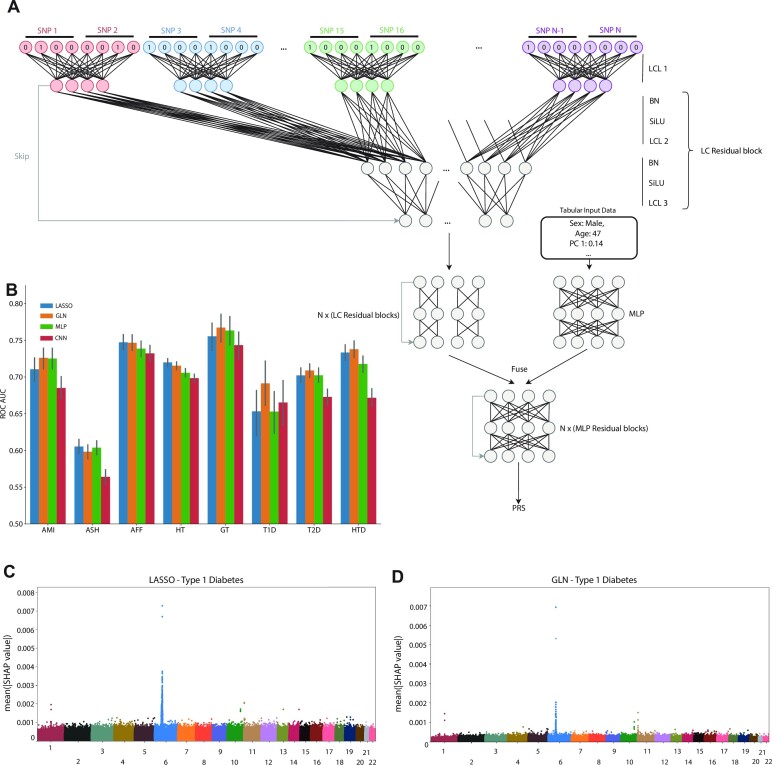
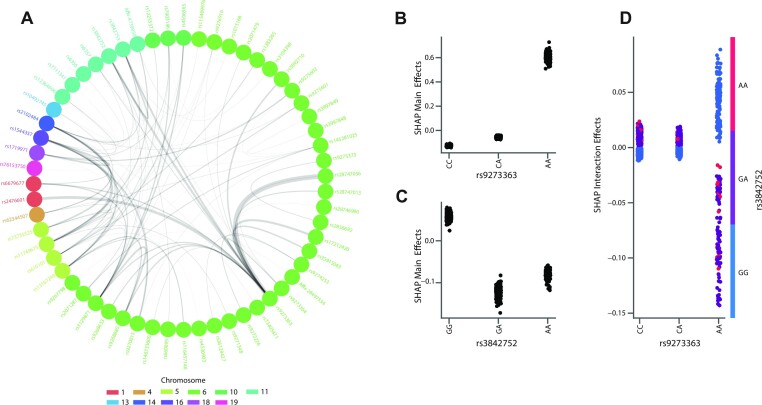
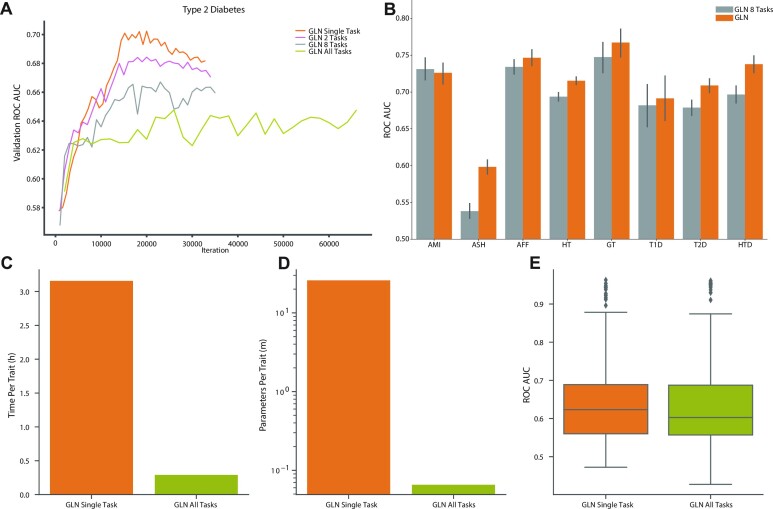
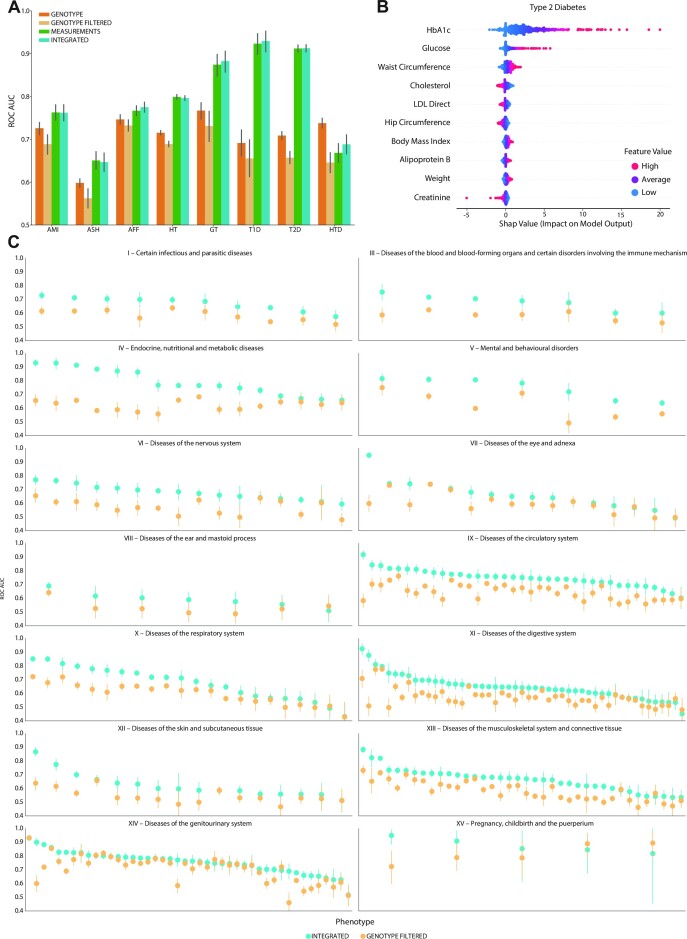
Polygenic risk scores (PRSs) are expected to play a critical role in precision medicine. Currently, PRS predictors are generally based on linear models using summary statistics, and more recently individual-level data. However, these predictors mainly capture additive relationships and are limited in data modalities they can use. We developed a deep learning framework (EIR) for PRS prediction which includes a model, genome-local-net (GLN), specifically designed for large-scale genomics data. The framework supports multi-task learning, automatic integration of other clinical and biochemical data, and model explainability. When applied to individual-level data from the UK Biobank, the GLN model demonstrated a competitive performance compared to established neural network architectures, particularly for certain traits, showcasing its potential in modeling complex genetic relationships. Furthermore, the GLN model outperformed linear PRS methods for Type 1 Diabetes, likely due to modeling non-additive genetic effects and epistasis. This was supported by our identification of widespread non-additive genetic effects and epistasis in the context of T1D. Finally, we constructed PRS models that integrated genotype, blood, urine, and anthropometric data and found that this improved performance for 93% of the 290 diseases and disorders considered. EIR is available at https://github.com/arnor-sigurdsson/EIR.


Figures

Graphical Abstract
Graphical Abstract
Figure 1.
Figure 1.
Study overview. A diagram showing the high-level steps taken for the study. First, deep learning models (MLP, CNN, GLN) were compared with linear methods (LASSO) to examine their feasibility in PRS prediction. Second, a single DL model trained to predict up to 338 disease traits at the same time from large-scale genotype data. Finally, DL models were used to integrate biochemical and genotype data for prediction.
Figure 2.
Figure 2.
Genome-local-net (GLN) model architecture and performance. (A) Model architecture. The model uses a locally connected layer (LCL) with a kernel width covering two SNPs and four weight sets as the first layer. The output of the first layer subsequently goes through residual blocks composed of LCLs. The genomic representation is then fused with the tabular representation, which then is propagated through FC based residual blocks. A final set of BN-SiLU-FC layers is used to compute the final output. (B) Comparison of LASSO (blue), GLN (orange), MLP (green) and CNN (red) performance on the test set across eight traits in AUC-ROC. All models were adjusted for age, sex, and the first 10 genomic PCs. Bars represent the 95% CI from 1000 bootstrap replicates on the held-out test set. AMI: acute myocardial infarction, ASH: asthma, AFF: atrial fibrillation and flutter, HT: hypertension, GT: gout, T1D: type 1 diabetes, T2D: type 2 diabetes, HTD: hypothyroidism. (C) SNP feature importance distribution for type 1 diabetes for LASSO, showing high importance in and around the HLA region. The importance values represent average absolute SHAP values, and were aggregated across 10 randomly seeded training runs, computed on the validation set. Each point represents a variant, and the points are colored according to chromosomes. (D) SNP feature importance distribution for type 1 diabetes for GLN, showing high importance values in and around the HLA region. The importance values represent average absolute SHAP values, and were aggregated across 10 randomly seeded training runs, computed on the validation set. Each point represents a variant, and the points are colored according to chromosomes.
Figure 3.
Figure 3.
Interaction effects among highly important SNPs for type 1 diabetes (T1D). (A) A network showing the interaction between different SNPs for T1D. The top 200 important SNPs (according to average absolute SHAP values computed on the validation set) across 10 training runs with the GLN model were studied for interaction effects between them using gradient boosted decision trees (GBDT). The 200 strongest interaction effects among all SNP combinations are plotted in the graph. Each node represents a variant, and the edge widths represent the strength of the interaction between the connected variants. The node colors represent which chromosome variants reside in. The network shows particularly strong interaction effects between various SNPs on chr6, but also widespread interaction effects between chromosomes. (B) Main effects of chr6 SNP rs9273363 on T1D, with the AA genotype having a strong effect in increasing risk. The y-axis values represent the main effect influence of a given rs9273363 genotype on the trained GBDT model output logits. (C) Main effects of chr11 SNP rs3842752 on T1D, with the GG genotype having a moderate effect in increasing T1D risk. The y-axis values represent the main effect influence of a given rs3842752 genotype on the trained GBDT model output logits. (D) Interaction effects between chr6 SNP rs9273363 and chr11 SNP rs3842752. The x-axis represents the rs9273363 genotype, the y-axis represents the interaction effect influence on the trained GBDT model output logits and the colors represent the GG (blue), GA (purple) and AA (red) genotypes of rs3842752. The vertical dispersion seen for the AA genotype of rs9273363 indicates that genotype combinations explored have different effects for different samples. This can be due to other SNPs having an additional interaction effect on rs9273363 and rs3842752, which can be seen in Figure 2A where the SNPs not only interact with each other, but multiple other SNPs.
Figure 4.
Figure 4.
Genome-local-net (GLN) multi-task (MT) predictions. (A) Comparison of validation curves in ROC-AUC for type 2 diabetes (T2D) as more tasks are added alongside the single task type 2 diabetes prediction (orange). The two task model (pink) is trained jointly on T2D and hypertension. The eight task model (gray) is trained on the eight benchmark traits showed in Figure 2B. The model trained on all tasks (green) is trained on the total set of 338 diseases considered in this work. The single and two task runs show signs of overfitting, as validation performance peaks and starts to deteriorate around 20K iterations. The eight and all MT runs do not show as clear signs of overfitting, but overall performance is worse. (B) Comparison of single task (orange) and MT performance (gray) for the 8 benchmark traits on the held-out test set. Bars represent the 95% CI from 1000 bootstrap replicates on the held out test-set. AMI: acute myocardial infarction, ASH: asthma, AFF: atrial fibrillation and flutter, HT: hypertension, GT: gout, T1D: type 1 diabetes, T2D: type 2 diabetes, HTD: hypothyroidism. (C) Comparison of training time per trait for the all task MT model (green) and single task training (orange). (D) Comparison of number of parameters per trait for the all task MT model (green) and single task (orange) training. (E) Overall performance on the held-out test set of the all task GLN MT model (green) and single task (orange) training.
Figure 5.
Figure 5.
Integrating genotype and clinical data with genome-local-net (GLN). (A) Comparison of model performance using genotype (orange), genotype filtered (light orange), measurement (green) and integrated (teal) data in ROC-AUC on the held-out test set. Bars represent the 95% CI from 1000 bootstrap replicates on the held-out test set. AMI: acute myocardial infarction, ASH: asthma, AFF: atrial fibrillation and flutter, HT: hypertension, GT: gout, T1D: type 1 diabetes, T2D: type 2 diabetes, HTD: hypothyroidism. (B) Feature importance and impact of integration measurement values on the GLN model prediction for T1D. For a given feature, each dot represents a sample in the test set. The colors indicate the actual feature value. For example, a strong trend of high glycated haemoglobin value influencing the model to make a positive prediction for T2D can be seen. (C) Summary of ROC-AUC performance on the held-out test set across all the 290 traits that had a time measured column associated with them, with Integrated data (teal) compared with genotype filtered data (light orange), filtered for time of diagnosis. Each subplot represents an ICD10 chapter. Bars represent the 95% CI from 1000 bootstrap replicates on the held-out test set.

References

    1. Khera A.V., Chaffin M., Aragam K.G., Haas M.E., Roselli C., Choi S.H., Natarajan P., Lander E.S., Lubitz S.A., Ellinor P.T.et al. .. Genome-wide polygenic scores for common diseases identify individuals with risk equivalent to monogenic mutations. Nat. Genet. 2018; 50:1219–1224. - PMC - PubMed
    1. Inouye M., Abraham G., Nelson C.P., Wood A.M., Sweeting M.J., Dudbridge F., Lai F.Y., Kaptoge S., Brozynska M., Wang T.et al. .. Genomic risk prediction of coronary artery disease in 480,000 Adults. J. Am. College Cardiol. 2018; 72:1883–1893. - PMC - PubMed
    1. Mavaddat N., Michailidou K., Dennis J., Lush M., Fachal L., Lee A., Tyrer J.P., Chen T.-H., Wang Q., Bolla M.K.et al. .. Polygenic risk scores for prediction of breast cancer and breast cancer subtypes. Am. J. Hum. Genet. 2019; 104:21–34. - PMC - PubMed
    1. Torkamani A., Wineinger N.E., Topol E.J.. The personal clinical utility of polygenic risk scores. Nat. Rev. Genet. 2018; 19:581–590. - PubMed
    1. Lambert S.A., Abraham G., Inouye M.. Towards clinical utility of polygenic risk scores. Hum. Mol. Genet. 2019; 28:R133–R142. - PubMed

Publication types