

STellaris: a web server for accurate spatial mapping of single cells based on spatial transcriptomics data
- PMID: 37224539
- PMCID: PMC10320151
- DOI: 10.1093/nar/gkad419
STellaris: a web server for accurate spatial mapping of single cells based on spatial transcriptomics data
Abstract
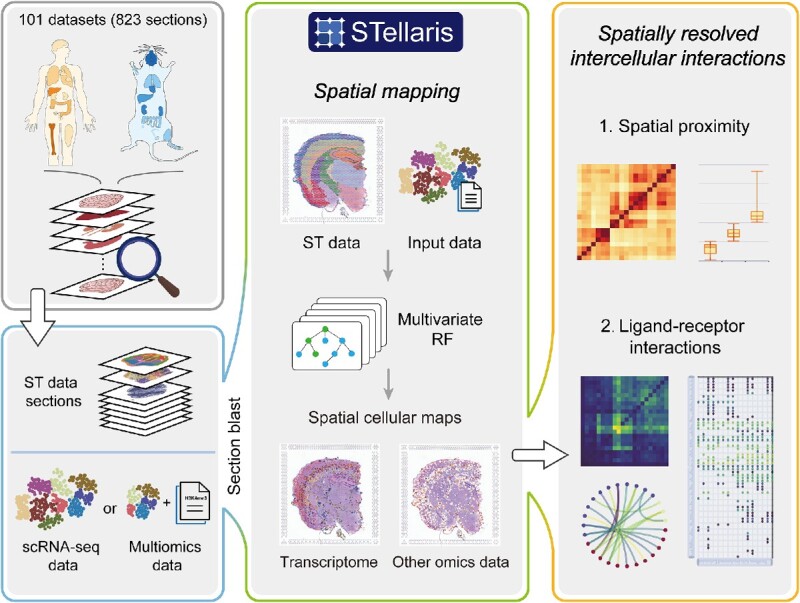
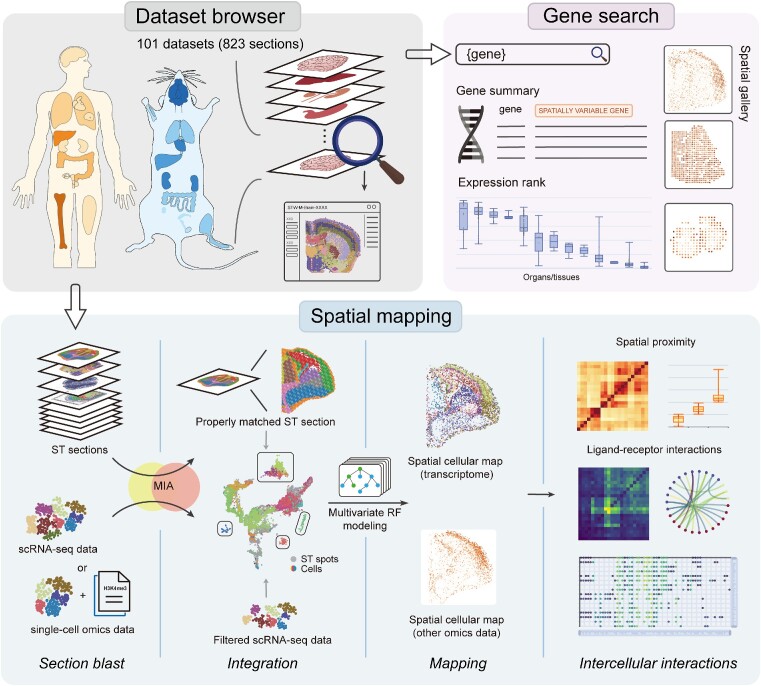
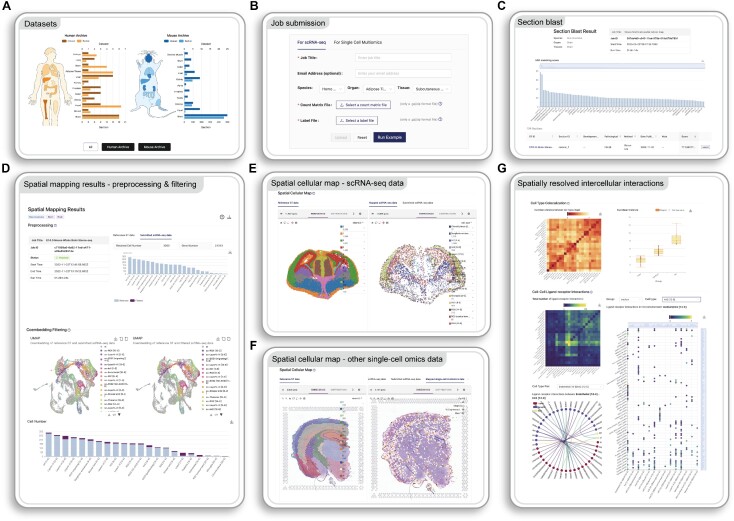
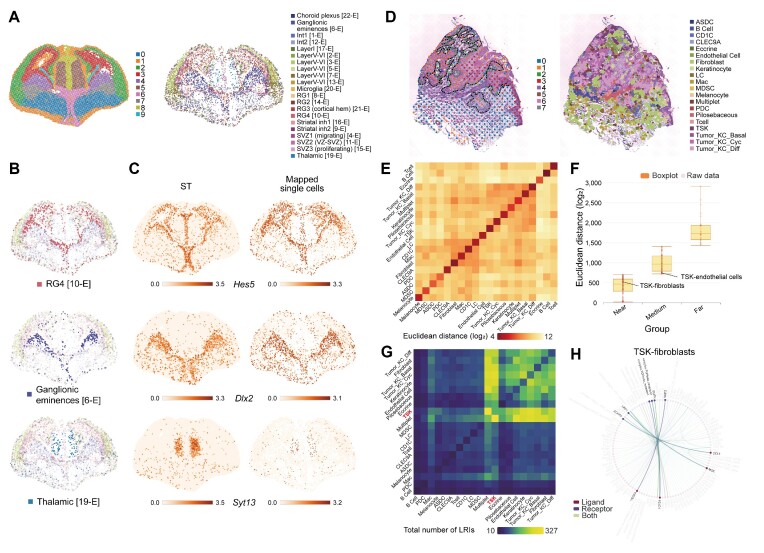
Single-cell RNA sequencing (scRNA-seq) provides insights into gene expression heterogeneities in diverse cell types underlying homeostasis, development and pathological states. However, the loss of spatial information hinders its applications in deciphering spatially related features, such as cell-cell interactions in a spatial context. Here, we present STellaris (https://spatial.rhesusbase.com), a web server aimed to rapidly assign spatial information to scRNA-seq data based on their transcriptomic similarity with public spatial transcriptomics (ST) data. STellaris is founded on 101 manually curated ST datasets comprising 823 sections across different organs, developmental stages and pathological states from humans and mice. STellaris accepts raw count matrix and cell type annotation of scRNA-seq data as the input, and maps single cells to spatial locations in the tissue architecture of properly matched ST section. Spatially resolved information for intercellular communications, such as spatial distance and ligand-receptor interactions (LRIs), are further characterized between annotated cell types. Moreover, we also expanded the application of STellaris in spatial annotation of multiple regulatory levels with single-cell multiomics data, using the transcriptome as a bridge. STellaris was applied to several case studies to showcase its utility of adding value to the ever-growing scRNA-seq data from a spatial perspective.
© The Author(s) 2023. Published by Oxford University Press on behalf of Nucleic Acids Research.
Figures
Similar articles
-
scMAGS: Marker gene selection from scRNA-seq data for spatial transcriptomics studies.Comput Biol Med. 2023 Mar;155:106634. doi: 10.1016/j.compbiomed.2023.106634. Epub 2023 Feb 9. Comput Biol Med. 2023. PMID: 36774895
-
webSCST: an interactive web application for single-cell RNA-sequencing data and spatial transcriptomic data integration.Bioinformatics. 2022 Jun 27;38(13):3488-3489. doi: 10.1093/bioinformatics/btac350. Bioinformatics. 2022. PMID: 35604082
-
SPANN: annotating single-cell resolution spatial transcriptome data with scRNA-seq data.Brief Bioinform. 2024 Jan 22;25(2):bbad533. doi: 10.1093/bib/bbad533. Brief Bioinform. 2024. PMID: 38279647 Free PMC article.
-
Computational solutions for spatial transcriptomics.Comput Struct Biotechnol J. 2022 Sep 1;20:4870-4884. doi: 10.1016/j.csbj.2022.08.043. eCollection 2022. Comput Struct Biotechnol J. 2022. PMID: 36147664 Free PMC article. Review.
-
Novel insights from spatial transcriptome analysis in solid tumors.Int J Biol Sci. 2023 Sep 4;19(15):4778-4792. doi: 10.7150/ijbs.83098. eCollection 2023. Int J Biol Sci. 2023. PMID: 37781515 Free PMC article. Review.
Cited by
-
SCAN: Spatiotemporal Cloud Atlas for Neural cells.Nucleic Acids Res. 2024 Jan 5;52(D1):D998-D1009. doi: 10.1093/nar/gkad895. Nucleic Acids Res. 2024. PMID: 37930842 Free PMC article.
-
SpatialRef: a reference of spatial omics with known spot annotation.Nucleic Acids Res. 2025 Jan 6;53(D1):D1215-D1223. doi: 10.1093/nar/gkae892. Nucleic Acids Res. 2025. PMID: 39417483 Free PMC article.
-
STEM enables mapping of single-cell and spatial transcriptomics data with transfer learning.Commun Biol. 2024 Jan 6;7(1):56. doi: 10.1038/s42003-023-05640-1. Commun Biol. 2024. PMID: 38184694 Free PMC article.
-
SRT-Server: powering the analysis of spatial transcriptomic data.Genome Med. 2024 Jan 26;16(1):18. doi: 10.1186/s13073-024-01288-6. Genome Med. 2024. PMID: 38279156 Free PMC article.
References
Publication types
MeSH terms
Associated data
LinkOut - more resources
Full Text Sources
Molecular Biology Databases
